. 2021 Sep;17(9):2257-2272.
doi: 10.1080/15548627.2020.1821548. Epub 2020 Oct 12.

BNIP3L/Nix-induced mitochondrial fission, mitophagy, and impaired myocyte glucose uptake are abrogated by PRKA/PKA phosphorylation

Affiliations

BNIP3L/Nix-induced mitochondrial fission, mitophagy, and impaired myocyte glucose uptake are abrogated by PRKA/PKA phosphorylation

Simone C da Silva Rosa et al. Autophagy. 2021 Sep.

Abstract

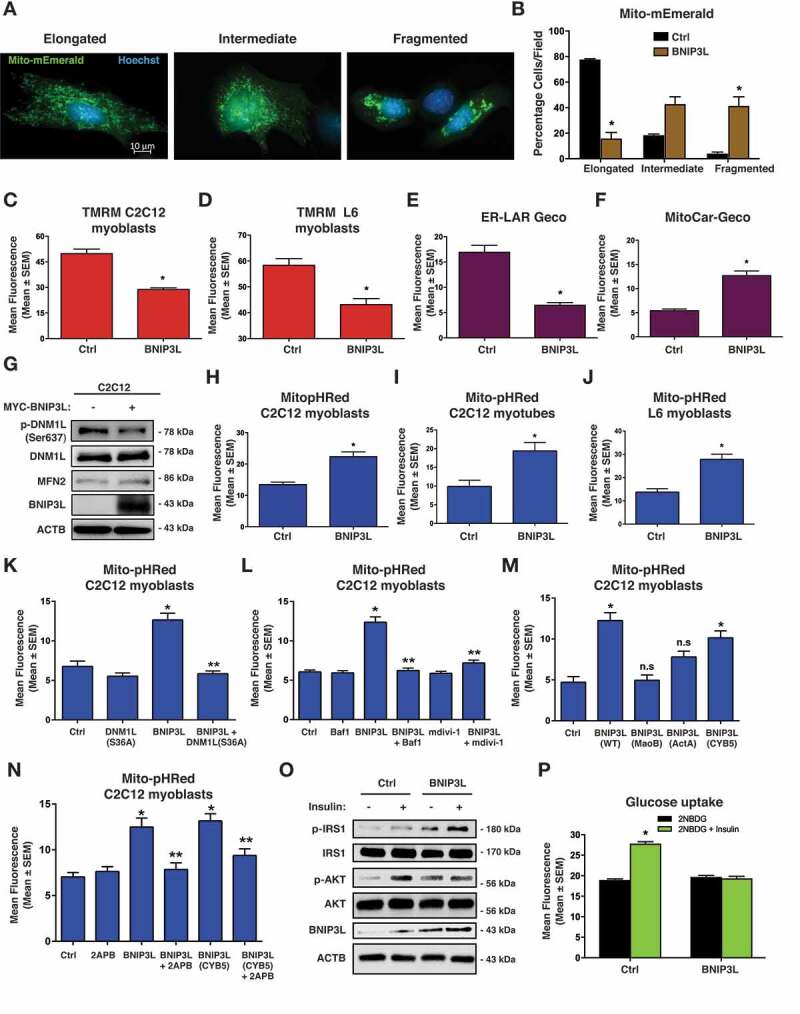
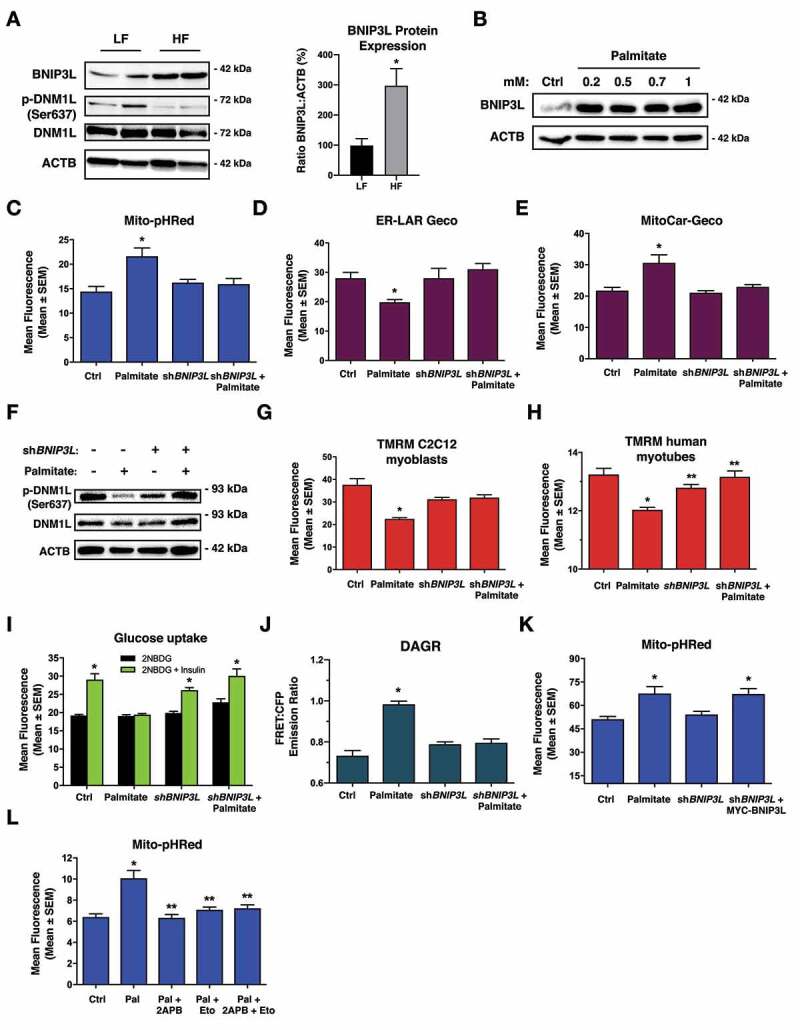
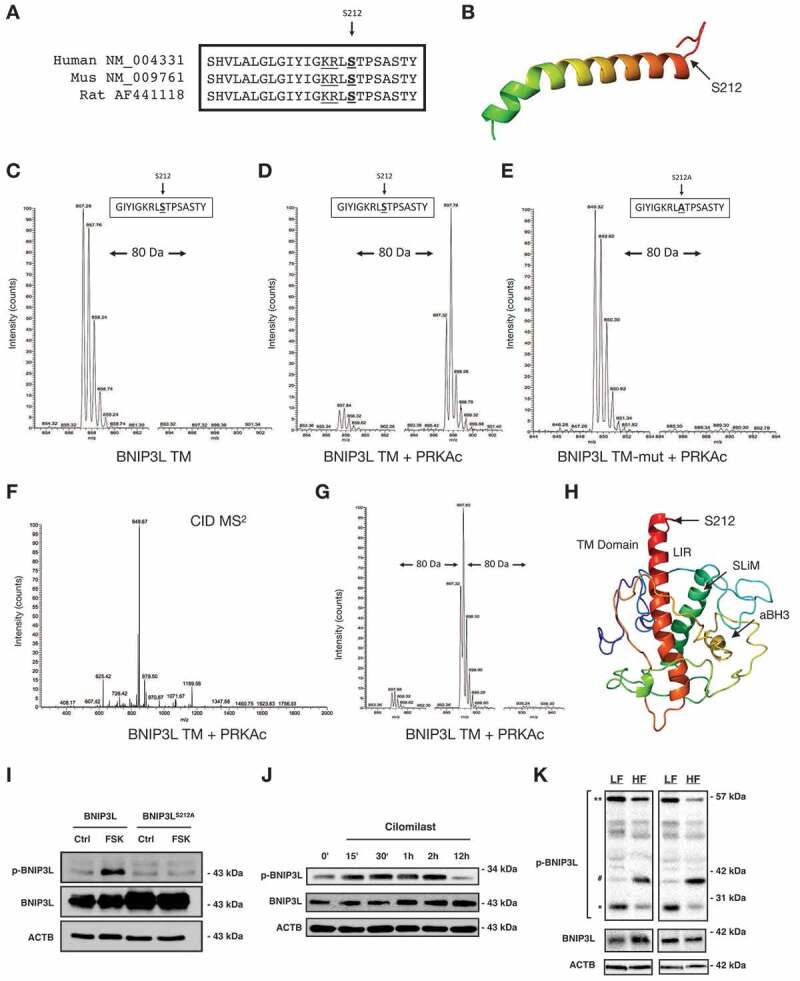
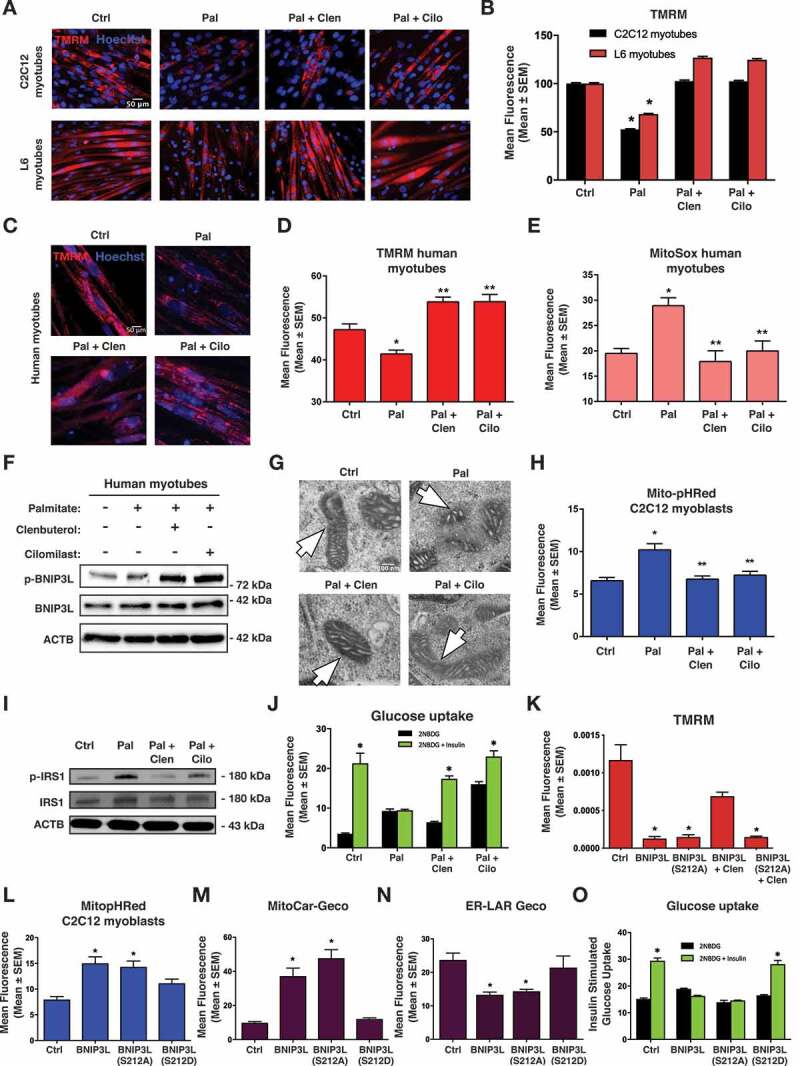
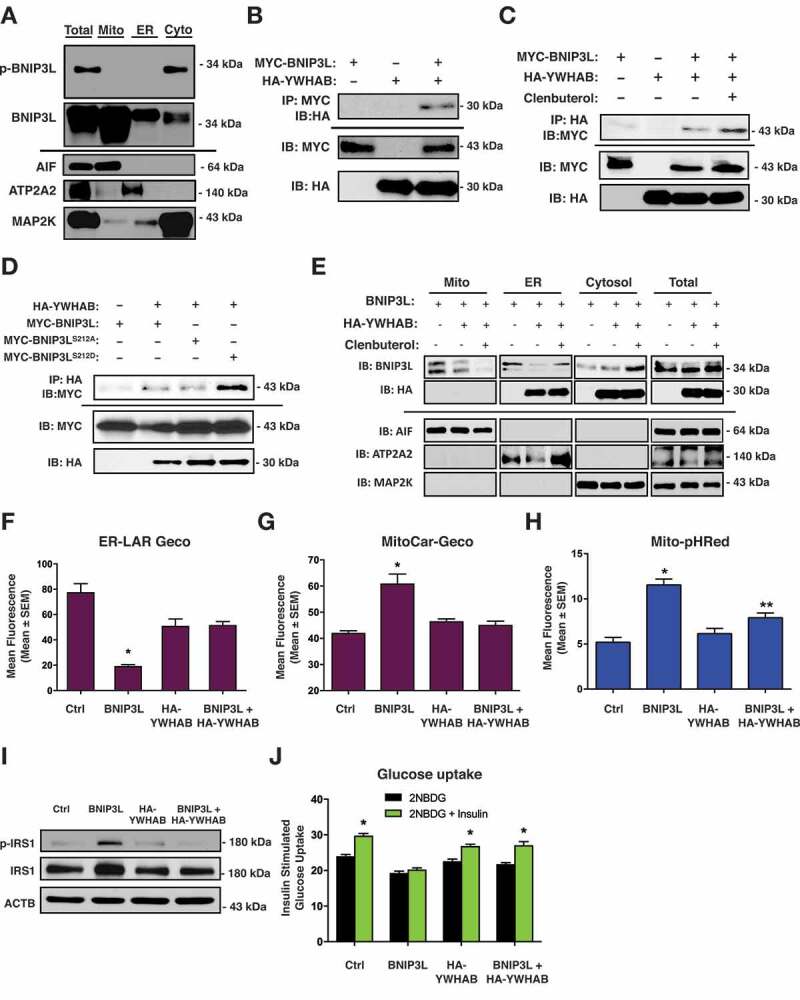
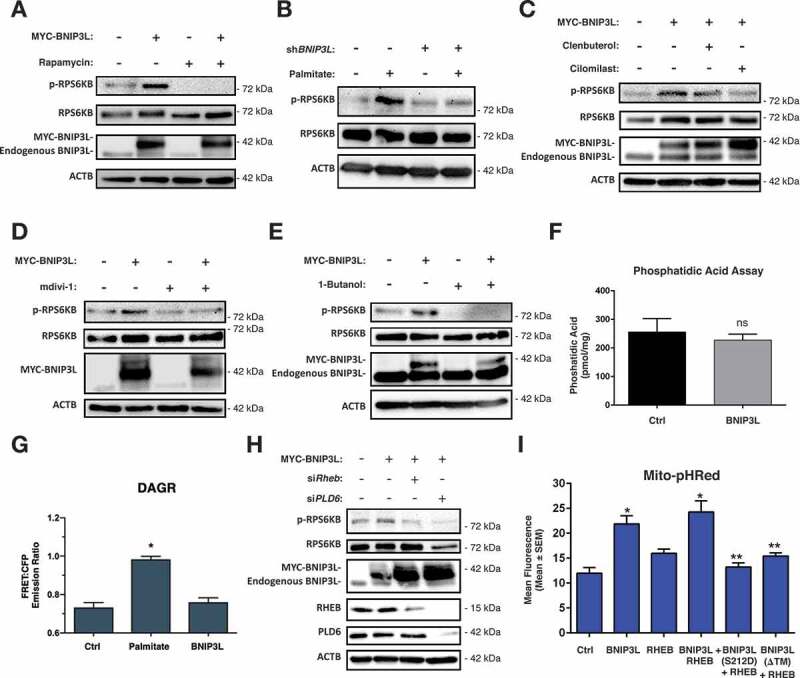
Lipotoxicity is a form of cellular stress caused by the accumulation of lipids resulting in mitochondrial dysfunction and insulin resistance in muscle. Previously, we demonstrated that the mitophagy receptor BNIP3L/Nix is responsive to lipotoxicity and accumulates in response to a high-fat (HF) feeding. To provide a better understanding of this observation, we undertook gene expression array and shot-gun metabolomics studies in soleus muscle from rodents on an HF diet. Interestingly, we observed a modest reduction in several autophagy-related genes. Moreover, we observed alterations in the fatty acyl composition of cardiolipins and phosphatidic acids. Given the reported roles of these phospholipids and BNIP3L in mitochondrial dynamics, we investigated aberrant mitochondrial turnover as a mechanism of impaired myocyte insulin signaling. In a series of gain-of-function and loss-of-function experiments in rodent and human myotubes, we demonstrate that BNIP3L accumulation triggers mitochondrial depolarization, calcium-dependent activation of DNM1L/DRP1, and mitophagy. In addition, BNIP3L can inhibit insulin signaling through activation of MTOR-RPS6KB/p70S6 kinase inhibition of IRS1, which is contingent on phosphatidic acids and RHEB. Finally, we demonstrate that BNIP3L-induced mitophagy and impaired glucose uptake can be reversed by direct phosphorylation of BNIP3L by PRKA/PKA, leading to the translocation of BNIP3L from the mitochondria and sarcoplasmic reticulum to the cytosol. These findings provide insight into the role of BNIP3L, mitochondrial turnover, and impaired myocyte insulin signaling during an overfed state when overall autophagy-related gene expression is reduced. Furthermore, our data suggest a mechanism by which exercise or pharmacological activation of PRKA may overcome myocyte insulin resistance.Abbreviations: BCL2: B cell leukemia/lymphoma 2; BNIP3L/Nix: BCL2/adenovirus E1B interacting protein 3-like; DNM1L/DRP1: dynamin 1-like; FUNDC1: FUN14 domain containing 1; IRS1: insulin receptor substrate 1; MAP1LC3A/LC3: microtubule-associated protein 1 light chain 3 alpha; MFN1: mitofusin 1; MFN2: mitofusin 2; MTOR: mechanistic target of rapamycin kinase; OPA1: OPA1 mitochondrial dynamin like GTPase; PDE4i: phosphodiesterase 4 inhibitor; PLD1: phospholipase D1; PLD6: phospholipase D family member 6; PRKA/PKA: protein kinase, AMP-activated; PRKCD/PKCδ: protein kinase C, delta; PRKCQ/PKCθ: protein kinase C, theta; RHEB: Ras homolog enriched in brain; RPS6KB/p70S6K: ribosomal protein S6 kinase; SQSTM1/p62: sequestosome 1; YWHAB/14-3-3β: tyrosine 3-monooxygenase/tryptophan 5-monooxygenase activation protein beta.

Keywords: Insulin signaling; MTOR; Nix; PKA; mitochondria; mitophagy; muscle.


Conflict of interest statement

No potential conflict of interest was reported by the authors.

Figures

Figure 1.
Figure 1.
BNIP3L regulates mitochondrial dynamics and mitophagy. (A-B) C2C12 myoblast cells were transfected with Mito-mEmerald to assess mitochondrial morphology (left). Quantification of C2C12 myoblast cells transfected with BNIP3L or empty vector control (right). (C-D) Quantification of C2C12 myoblast cells (C) or L6 myoblasts (D) transfected with BNIP3L or an empty vector control; stained with TMRM. (E) Quantification of C2C12 myoblasts transfected with ER-LAR-GECO, BNIP3L, or an empty vector control. (F) Quantification of C2C12 myoblasts transfected with Mito-CAR-GECO, BNIP3L, or an empty vector control. (G) C2C12 cells were transfected with BNIP3L or empty vector. Protein extracts were analyzed as indicated. (H-J) Quantification of (H) C2C12 myoblasts, (I) C2C12 myotubes, and (J) L6 myoblasts cells transfected with BNIP3L, Mito-pHRed, or an empty vector control. (K) C2C12 cells were transfected with Mito-pHRed, BNIP3L, a dominant negative DNM1L/Drp1 (S36A), or an empty vector control and quantified. (L) C2C12 cells were transfected with Mito-pHRed, BNIP3L, or an empty vector control. Cells were treated with Bafilomycin (6 nM, 3 h) or with the mitochondrial fission inhibitor (mdivi-1, 20 µM, 1 h). (M) Quantification of C2C12 myoblast cells transfected with Mito-pHRed, BNIP3L, mitochondrial targeted BNIP3L fusion constructs BNIP3L-MaoB or BNIP3L-ActA, the ER/SR targeted BNIP3L construct BNIP3L-CYB5, or an empty vector control. (N) C2C12 myoblast cells were transfected with Mito-pHRed, BNIP3L, BNIP3L-CYB5, or an empty vector control. Cells were treated with 2-aminoethoxydiphenyl borate (2APB 10 µM, 1 h), or DMSO as control vehicle and quantified. (O) L6 myotubes were transfected with BNIP3L or empty vector followed by 15 min of insulin stimulation (10 nM). Protein extracts were analyzed as indicated. (P) L6 myotubes were transfected with BNIP3L or an empty vector control. Insulin stimulated glucose uptake (10 nM) was determined by 2NBDG fluorescence and quantified. Data are represented as mean ± S.E.M. *P < 0.05 compared with control, while **P < 0.05 compared with treatment, determined by 1-way or 2-way ANOVA
Figure 2.
Figure 2.
Knockdown of BNIP3L improves mitochondrial function and insulin sensitivity. (A) Western blot analysis of rat soleus muscle exposed to high fat (HF) or low fat (LF) diet for 12-weeks (left). Quantification of BNIP3L expression relative to actin (n = 4)(right). (B) C2C12 myoblast cells were treated overnight with increasing doses of palmitate conjugated to 2% albumin in low-glucose media. Protein extracts were analyzed as indicated. (C) C2C12 myoblast cells were transfected with Mito-pHRed, shBNIP3L, or a scrambled control shRNA. Cells were treated overnight with palmitate (200 µM). (D) Quantification of C2C12 myoblasts transfected with ER-LAR-GECO and treated as in (C). (E) Quantification of C2C12 myoblast cells transfected with Mito-CAR-GECO and treated as in (C). (F) C2C12 myoblast cells were transfected with shBNIP3L or a scrambled control shRNA, followed by palmitate treatment as described in (C). Protein extracts were analyzed as indicated. (G) C2C12 myoblast and (H) human myotube cells were transfected with shBNIP3L or a control shRNA. Cells were treated overnight with palmitate as in (C), stained for TMRM and quantified. (I) L6 myotubes were transfected with shBNIP3L or a control shRNA. Cells were treated overnight with palmitate as in (C). Insulin stimulated glucose uptake (10 nM) was determined by 2NBDG fluorescence and quantified. (J) C2C12 myoblast cells as transfected as in (H), along with DAGR, a diacylglycerol biosensor. Cells were analyzed by using the emission ratio of YFP:CFP (FRET Ratio). (K) Quantification of C2C12 myoblast cells transfected as in (H), along with MYC-BNIP3L and treated as in (C). (L) C2C12 cells were transfected with Mito-pHRed. Cells were pre-treated overnight with etomoxir (100 µM) and palmitate, as described in (C), followed by co-treatment with 2APB (10 µM, 2 h) or DMSO as control vehicle and quantified. Data are represented as mean ± S.E.M. *P < 0.05 compared with control, while **P < 0.05 compared with treatment, determined by t-test, 1-way or 2-way ANOVA
Figure 3.
Figure 3.
PRKA phosphorylates BNIP3L at Ser212. (A) Amino acid sequence alignment for human, mouse and rat BNIP3L. (B) Schematic BNIP3L transmembrane domain and the location of Ser212. (C) SIM scan of the wild-type peptide spanning the PRKA site of BNIP3L. The unphosphorylated peptide has 857.28 m/z (z = 2+). (D) Putative phosphorylation showing an increased m/z of 40 that corresponds to PO3 (M = 80.00 Da). (E) SIM scan of mutated peptide (S212A) incubated with kinase, as in (D). (F) MS2 spectra following collision-induced dissociation of the precursor ion in (D, m/z = 897.78). A neutral loss of 49 m/z confirms phosphorylation. (G) SIM scanning showing BNIP3L peptide is not phosphorylated at two residues within the peptide. (H) BNIP3L structure modeled using Phyre2 engine. (I) 3T3 cells were transfected with wild type BNIP3L or a BNIP3L mutant where Ser212 is converted to alanine (S212A) and treated with 10 μM forskolin for 2 h. Protein extracts were immunoblotted, as indicated. (J) C2C12 myoblast cells were treated with 10 μM cilomilast or vehicle for multiple time points. Protein extracts were immunoblotted, as indicated. (K) p-BNIP3L is decreased as total BNIP3L increases in soleus muscle of rodents treated with high fat (HF) or low fat (LF) diet for 12-weeks. *predicted molecular weight, **predicted dimer weight, #aligned with total BNIP3L
Figure 4.
Figure 4.
Clenbuterol and cilomilast inhibit palmitate-induced mitochondrial defects. (A) 5-day differentiated C2C12 myotubes and L6 myotubes were treated overnight with palmitate (200 µM) conjugated to 2% albumin in low glucose media. Control cells were treated with 2% albumin alone. Myotubes were treated with clenbuterol (500 nM, 2 h), cilomilast (10 μM, 2 h) or DMSO control vehicle and stained with TMRM (red) and Hoechst (blue) and imaged by standard fluorescence microscopy. (B) Quantification of (A). (C) 7-day differentiated human myotubes were treated and stained as in (A). (D) Quantification of (C). (E) 7-day differentiated human myotubes were stained with MitoSOX and quantified. (F) 7-day differentiated human myotubes were treated as in (A). Protein extracts were immunoblotted, as indicated. (G) C2C12 myoblast cells were treated as in (A) and imaged via electron microscopy. Mitochondria are indicated by arrows. (H) C2C12 myoblasts were transfected with Mito-pHRed and treated as in (A). (I) L6 myotube were treated as in (A) and protein extracts were immunoblotted, as indicated. (J) Insulin stimulated glucose uptake (10 nM) was determined by 2NBDG fluorescence in treated L6 myotubes and quantified. (K) C2C12 myoblast cells were transfected with BNIP3L wild type and BNIP3LS212A followed by clenbuterol treatment (500 nM, 2 h). Cells were stained with TMRM and imaged by standard fluorescence microscopy. (L-N) C2C12 myoblasts cells were transfected with BNIP3L, BNIP3LS212A, or BNIP3LS212D with Mito-pHRed (L), Mito-Car-Geco (M), and ER-Lar-Geco (N). (O) L6 myotubes cells were transfected with BNIP3L, BNIP3LS212A, or BNIP3LS212D. Insulin stimulated uptake (10 nM) was determined by 2NBDG fluorescence and quantified. Data are represented as mean ± S.E.M. *P < 0.05 compared with control, while **P < 0.05 compared with treatment, determined by 1-way or 2-way ANOVA
Figure 5.
Figure 5.
P-BNIP3L interacts with YWHAB proteins to determine subcellular location. (A) C2C12 myoblasts were subjected to subcellular fractionation. Protein extracts were immunoblotted for p-BNIP3L and total BNIP3L, as indicated. (B) 293 T cells were transfected with MYC-BNIP3L or HA-YWHAB. Extracts were immunoprecipitated (IP) with a MYC antibody and immunoblotted (IB), as indicated. (C) C2C12 myoblasts were transfected as in (B) and treated with clenbuterol (500 nM, 2 h). Extracts were immunoprecipitated (IP) with HA antibody and immunoblotted (IB), as indicated. (D) C2C12 myoblasts were transfected with HA-YWHAB, MYC-BNIP3L, MYC-BNIP3LS212A or MYC-BNIP3LS212D. Extracts were immunoprecipitated (IP) with HA antibody and immunoblotted (IB), as indicated. (E) C2C12 myoblasts were transfected with either MYC-BNIP3L or HA-YWHAB, followed by clenbuterol treatment (500 nM, 2 h). Extracts were fractioned and protein extracts were immunoblotted, as indicated. (F) C2C12 myoblasts cells were transfected with BNIP3L wild type, HA-YWHAB, and ER-Lar-Geco. (G) C2C12 myoblasts cells were transfected with BNIP3L wild type, HA-YWHAB, and mitoCar-Geco. (H) C2C12 myoblasts cells were transfected with BNIP3L wild type, HA-YWHAB, and Mito-pHRed. (I-J) L6 myotubes were transfected with BNIP3L wild type, HA-YWHAB. Proteins were immunoblotted as indicated (I) and insulin stimulated glucose uptake (10 nM) was determined by 2NBDG fluorescence and quantified (J). Data are represented as mean ± S.E.M. *P < 0.05 compared with control, while **P < 0.05 compared with treatment, determined by 1-way or 2-way ANOVA
Figure 6.
Figure 6.
BNIP3L-induced MTOR-RPS6KB activation. (A) C2C12 myoblast cells transfected with MYC-BNIP3L or an empty vector control. Cells were treated with Rapamycin (500 nM, 1 h) or DMSO as vehicle control. Proteins were immunoblotted as indicated. (B) C2C12 myoblast cells transfected with shBNIP3L, or a scramble control shRNA, and treated overnight with palmitate (200 µM) conjugated to 2% albumin in low-glucose media. Proteins were immunoblotted as indicated. (C) C2C12 myoblast cells were transfected as in (A), and were treated with clenbuterol (500 nM), cilomilast (10 μM) or vehicle for 2 h. Proteins were immunoblotted as indicated. (D) C2C12 myoblast cells were transfected as in (A). Cells were treated with mdivi-1 (20 µM) or vehicle for 1 h. Proteins were immunoblotted as indicated. (E) C2C12 myoblast cells were transfected as in (A) and treated with 1-butanol (1%) for 30 min. Proteins were immunoblotted as indicated. (F) C2C12 myoblast cells were transfected as in (A), followed by phosphatidic acid assay and quantification. (G) C2C12 myoblast cells were transfected as in (A), along with the diacylglycerol biosensor DAGR. Cells were treated overnight with palmitate and analyzed by FRET imaging. (H) C2C12 myoblast cells were transfected with MYC-BNIP3L, siRHEB, siPLD6. Proteins were immunoblotted as indicated. (I) C2C12 myoblast cells were transfected with MYC-BNIP3L, RHEB, MYC-BNIP3LS212D, MYC-BNIP3L-ΔTM, along with Mito-pHRed. Cells were imaged by standard fluorescence and quantified. Data are represented as mean ± S.E.M. *P < 0.05 compared with control, while **P < 0.05 compared with treatment, determined by 1-way or 2-way ANOVA

Similar articles

Cited by

References

    1. Gordon JW, Dolinsky VW, Mughal W, et al. Targeting skeletal muscle mitochondria to prevent type 2 diabetes in youth. Biochem Cell Biol. 2015;93:452–465. - PubMed
    1. Hesselink MKC, Schrauwen-Hinderling V, Schrauwen P.. Skeletal muscle mitochondria as a target to prevent or treat type 2 diabetes mellitus. Nat Rev Endocrinol. 2016;12:633–645. - PubMed
    1. Samuel VT, Shulman GI.. The pathogenesis of insulin resistance: integrating signaling pathways and substrate flux. J Clin Invest. 2016;126:12–22. - PMC - PubMed
    1. Erion DM, Shulman GI. Diacylglycerol-mediated insulin resistance. Nat Med. 2010;16:400–402. - PMC - PubMed
    1. Schenk S, Horowitz JF. Acute exercise increases triglyceride synthesis in skeletal muscle and prevents fatty acid-induced insulin resistance. J Clin Invest. 2007;117:1690–1698. - PMC - PubMed

Publication types

Grants and funding