Multicenter Study
. 2020 Oct 12;15(10):e0240250.
doi: 10.1371/journal.pone.0240250. eCollection 2020.

Multicenter analysis of sputum microbiota in tuberculosis patients

Affiliations
Multicenter Study

Multicenter analysis of sputum microbiota in tuberculosis patients

Claudia Sala et al. PLoS One. .

Abstract

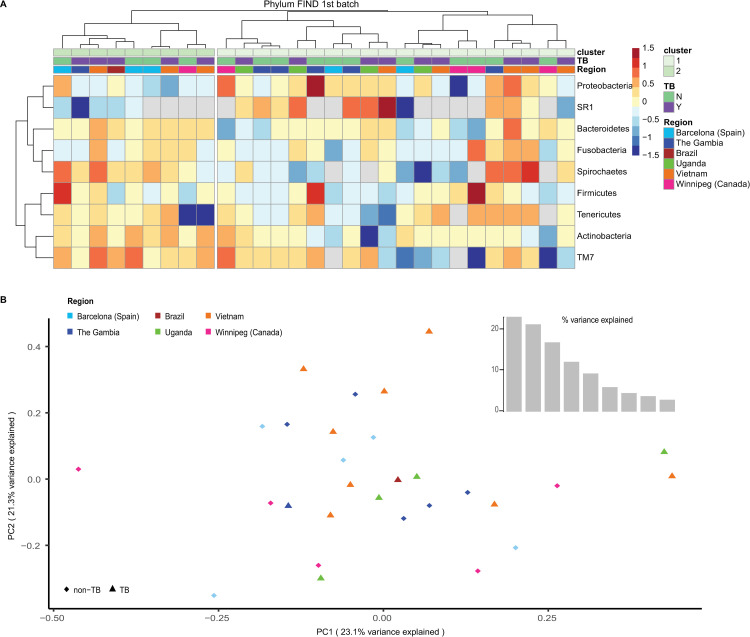
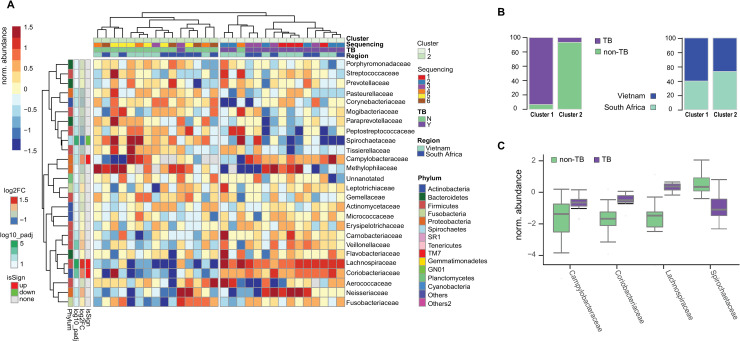
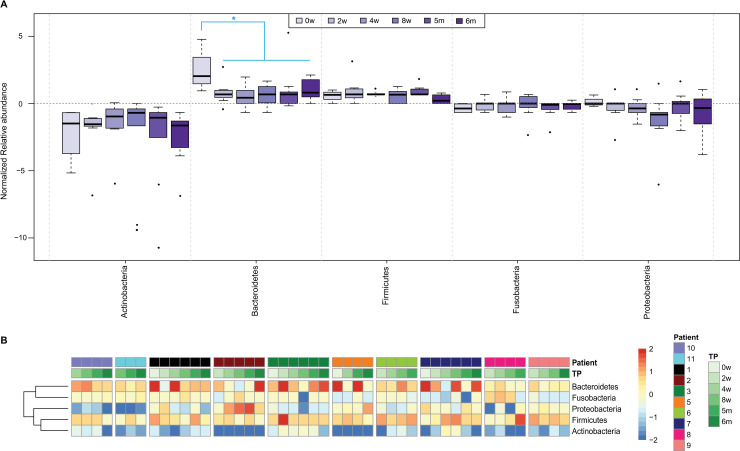
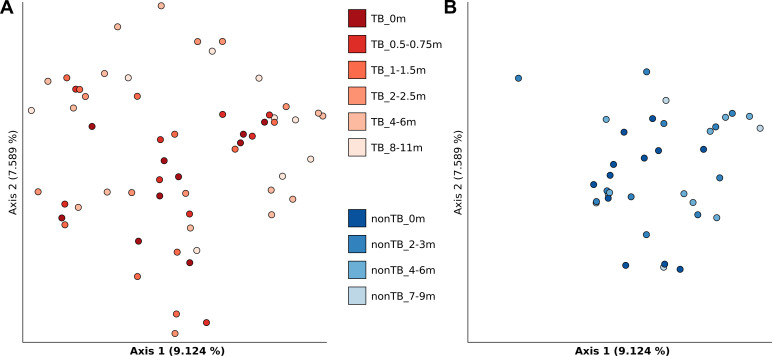
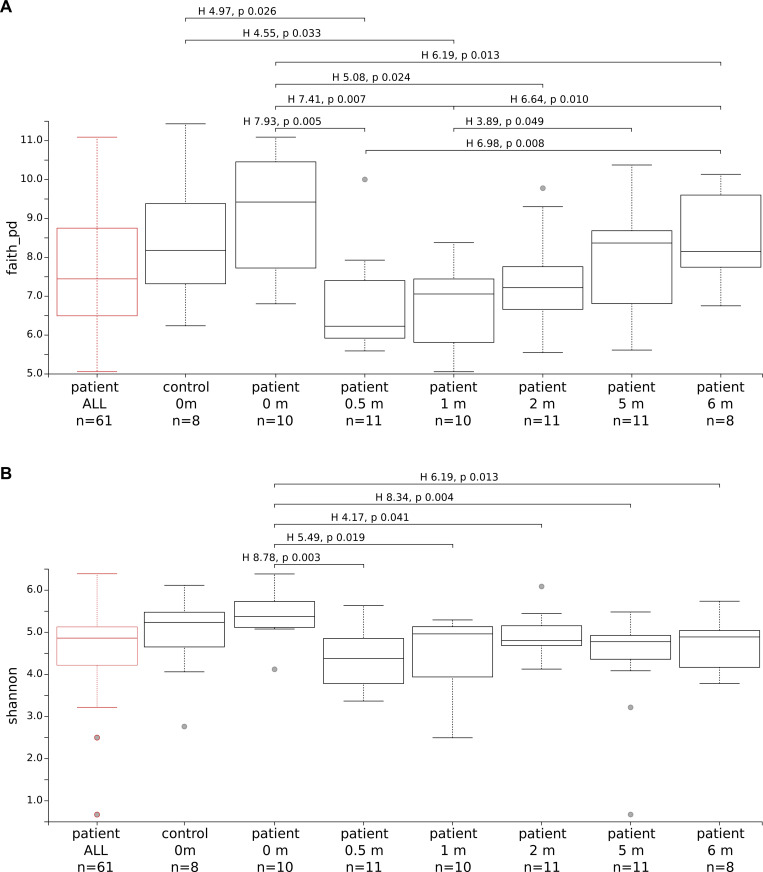
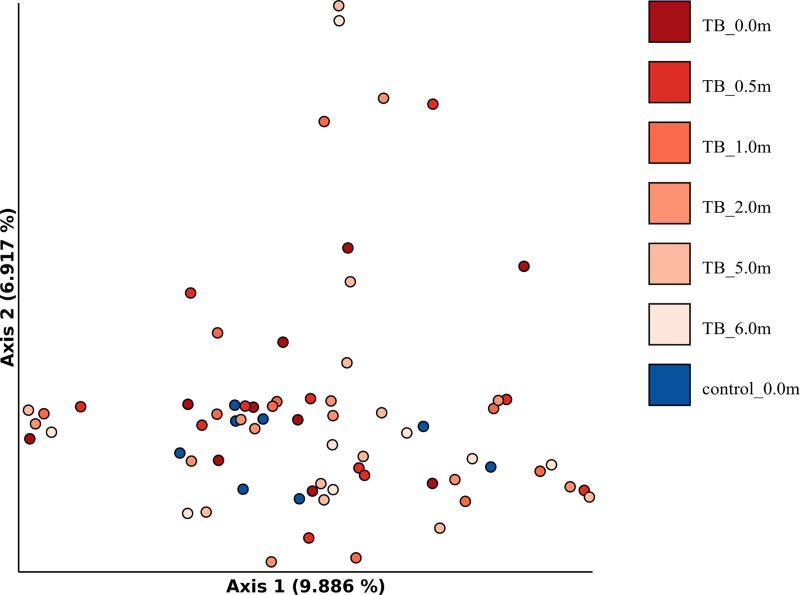
The impact of tuberculosis and of anti-tuberculosis therapy on composition and modification of human lung microbiota has been the object of several investigations. However, no clear outcome has been presented so far and the relationship between M. tuberculosis pulmonary infection and the resident lung microbiota remains vague. In this work we describe the results obtained from a multicenter study of the microbiota of sputum samples from patients with tuberculosis or unrelated lung diseases and healthy donors recruited in Switzerland, Italy and Bangladesh, with the ultimate goal of discovering a microbiota-based biomarker associated with tuberculosis. Bacterial 16S rDNA amplification, high-throughput sequencing and extensive bioinformatic analyses revealed patient-specific flora and high variability in taxon abundance. No common signature could be identified among the individuals enrolled except for minor differences which were not consistent among the different geographical settings. Moreover, anti-tuberculosis therapy did not cause any important variation in microbiota diversity, thus precluding its exploitation as a biomarker for the follow up of tuberculosis patients undergoing treatment.


Conflict of interest statement

The authors have declared that no competing interests exist.

Figures

Fig 1
Fig 1. Analysis of the first batch of samples received from FIND.
A. Heatmap of Phylum abundances across samples. Hierarchical clustering did not segregate the data according to disease (TB in violet, non-TB in green) nor to the region of origin. B. PCoA (PC1 vs. PC2) displaying all of the samples, colored according to the country. The different shapes (triangle or circle) indicate TB and non-TB samples, respectively. No segregation could be observed. The percentage of variance explained for the first components is shown in the inset.
Fig 2
Fig 2. Analysis of the second batch of samples received from FIND.
A. Heatmap of Family abundances across samples. The hierarchical clustering shows a segregation for the majority of the TB (violet) and non-TB samples (green). No segregation is observed for the sequencing batch or the region of origin. Annotations of rows provide the strengths and significances of Families in TB samples compared to non-TB samples (differential abundance analysis–see methods - significant if absolute log2 Fold-Change > 1 and adjusted p-value < 0.05). B. Barplots quantifying the representations of TB and non-TB samples in the two clusters obtained in A as well as their region of origin. C. Abundance distributions of representative Families identified in A in TB and non-TB samples.
Fig 3
Fig 3. Analysis of samples received from CHUV.
A. Phylum abundances per time-points. A significant change could only be observed for Bacteroidetes between time-point 0 and the other five time-points (pairwise t-test, with adjusted p-value < 0.01). B. Heatmap of Phylum abundances across samples and scaled by bacteria. Hierarchical clustering was applied to Phyla. Samples are ordered by patient (different colors) and by time-point (TP).
Fig 4
Fig 4. Principal component analysis (PCoA) of the sputum samples collected in Italy, based on Bray-Curtis distances.
A. Samples collected from tuberculosis (TB) patients. The different colors indicate the various time-points. B. Samples collected from pneumonia (nonTB) patients. The different colors correspond to the various time-points.
Fig 5
Fig 5
Alpha diversity for the sputum samples received from Bangladesh. A. Faith Phylogenetic Diversity. B. Shannon index. Samples from controls and TB patients are listed on the X-axis. TB patients are grouped according to the time-point. Grey dots represent outliers. Pairwise Kruskal-Wallis statistics are shown for p-values smaller than 0.05. The “patient ALL” group (red) was tested separately against the controls (test not statistically significant). Kruskal-Wallis test for all groups was 19.05 (p-value 0.004) for Faith Phylogenetic Diversity and 14.94 (p-value 0.021) for Shannon index.
Fig 6
Fig 6. Principal component analysis (PCoA) of the sputum samples collected in Bangladesh.
The analysis is based on Bray-Curtis distances and shows control and TB patients at the different time-points.

References

    1. WHO. Global Tuberculosis Report 2019. 2019.
    1. Brites D, Gagneux S. The Nature and Evolution of Genomic Diversity in the Mycobacterium tuberculosis Complex. Adv Exp Med Biol. 2017;1019: 1–26. 10.1007/978-3-319-64371-7_1 - DOI - PubMed
    1. Miotto P, Zhang Y, Cirillo DM, Yam WC. Drug resistance mechanisms and drug susceptibility testing for tuberculosis. Respirol Carlton Vic. 2018;23: 1098–1113. 10.1111/resp.13393 - DOI - PubMed
    1. du Bruyn E, Peton N, Esmail H, Howlett PJ, Coussens AK, Wilkinson RJ. Recent progress in understanding immune activation in the pathogenesis in HIV-tuberculosis co-infection. Curr Opin HIV AIDS. 2018;13: 455–461. 10.1097/COH.0000000000000501 - DOI - PubMed
    1. Müller J, Tanner R, Matsumiya M, Snowden MA, Landry B, Satti I, et al. Cytomegalovirus infection is a risk factor for tuberculosis disease in infants. JCI Insight. 2019;4 10.1172/jci.insight.130090 - DOI - PMC - PubMed

Publication types