. 2021 Mar;69(3):655-680.
doi: 10.1002/glia.23919. Epub 2020 Oct 12.

Intranasal mesenchymal stem cell therapy to boost myelination after encephalopathy of prematurity

Affiliations

Intranasal mesenchymal stem cell therapy to boost myelination after encephalopathy of prematurity

Josine E G Vaes et al. Glia. 2021 Mar.

Abstract

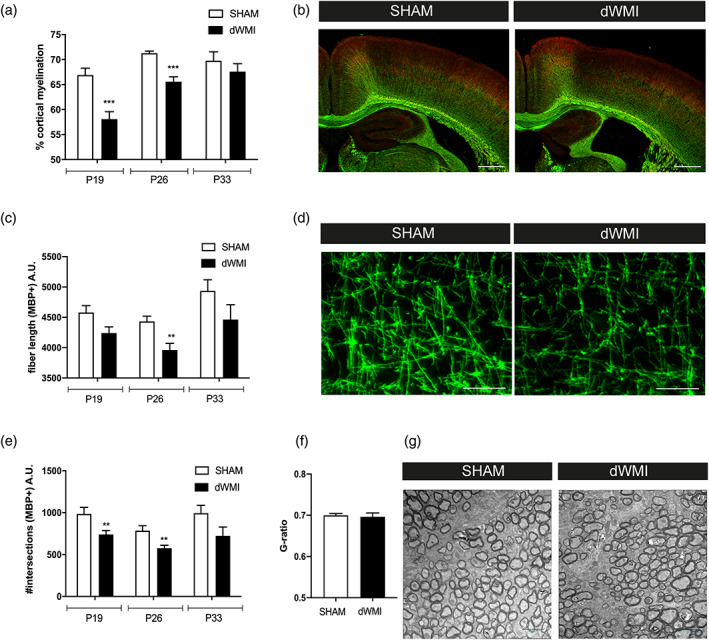
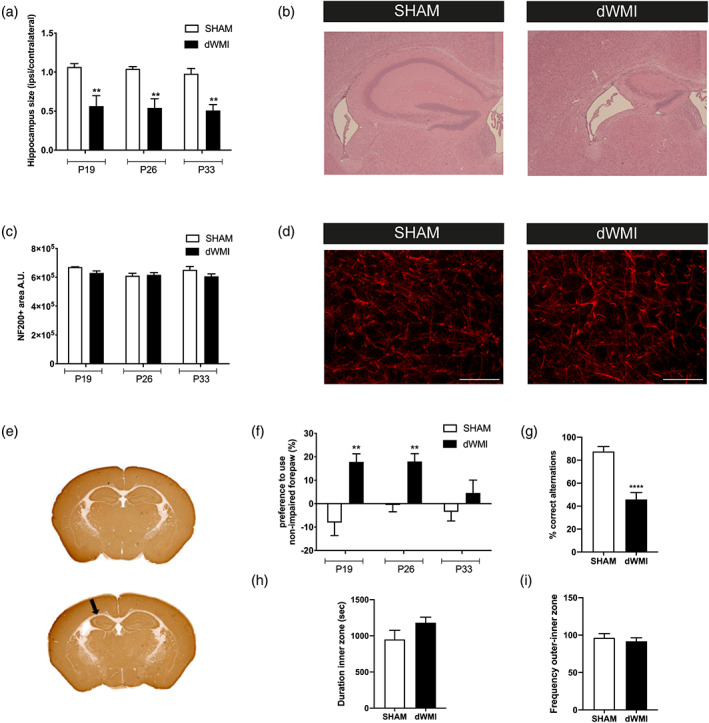
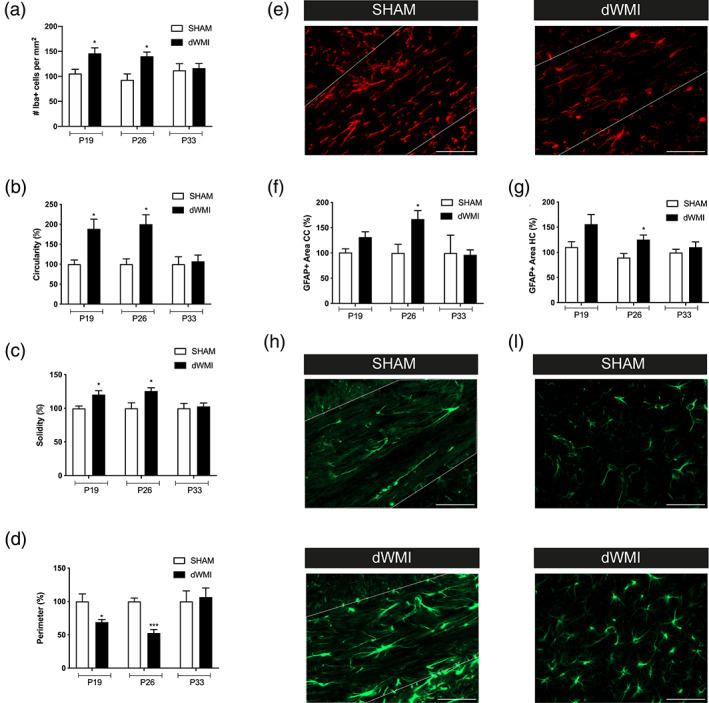
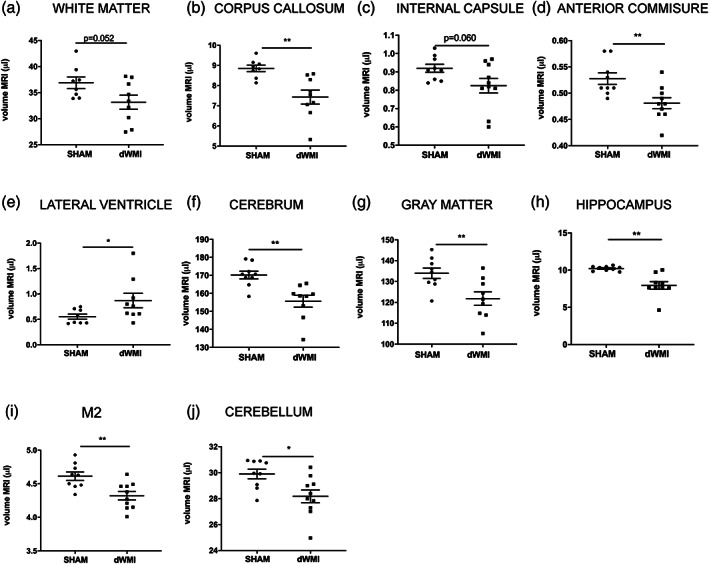
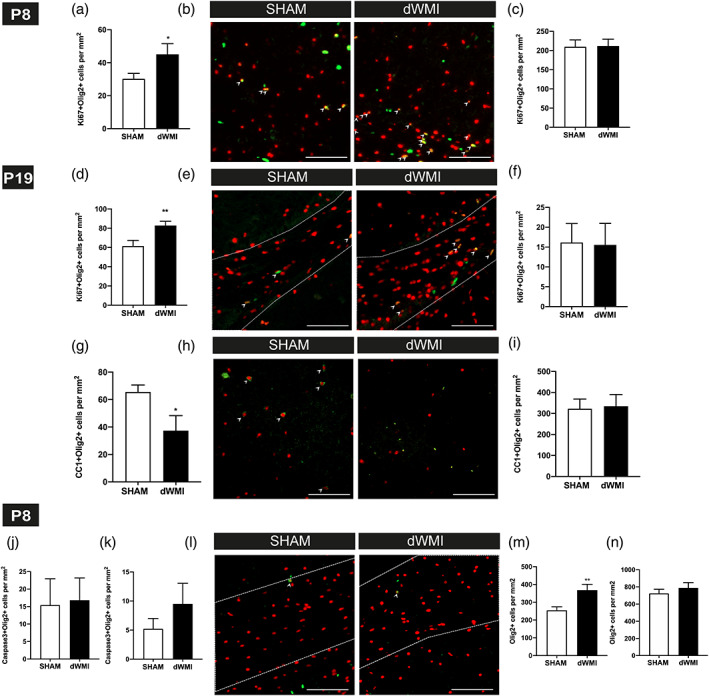
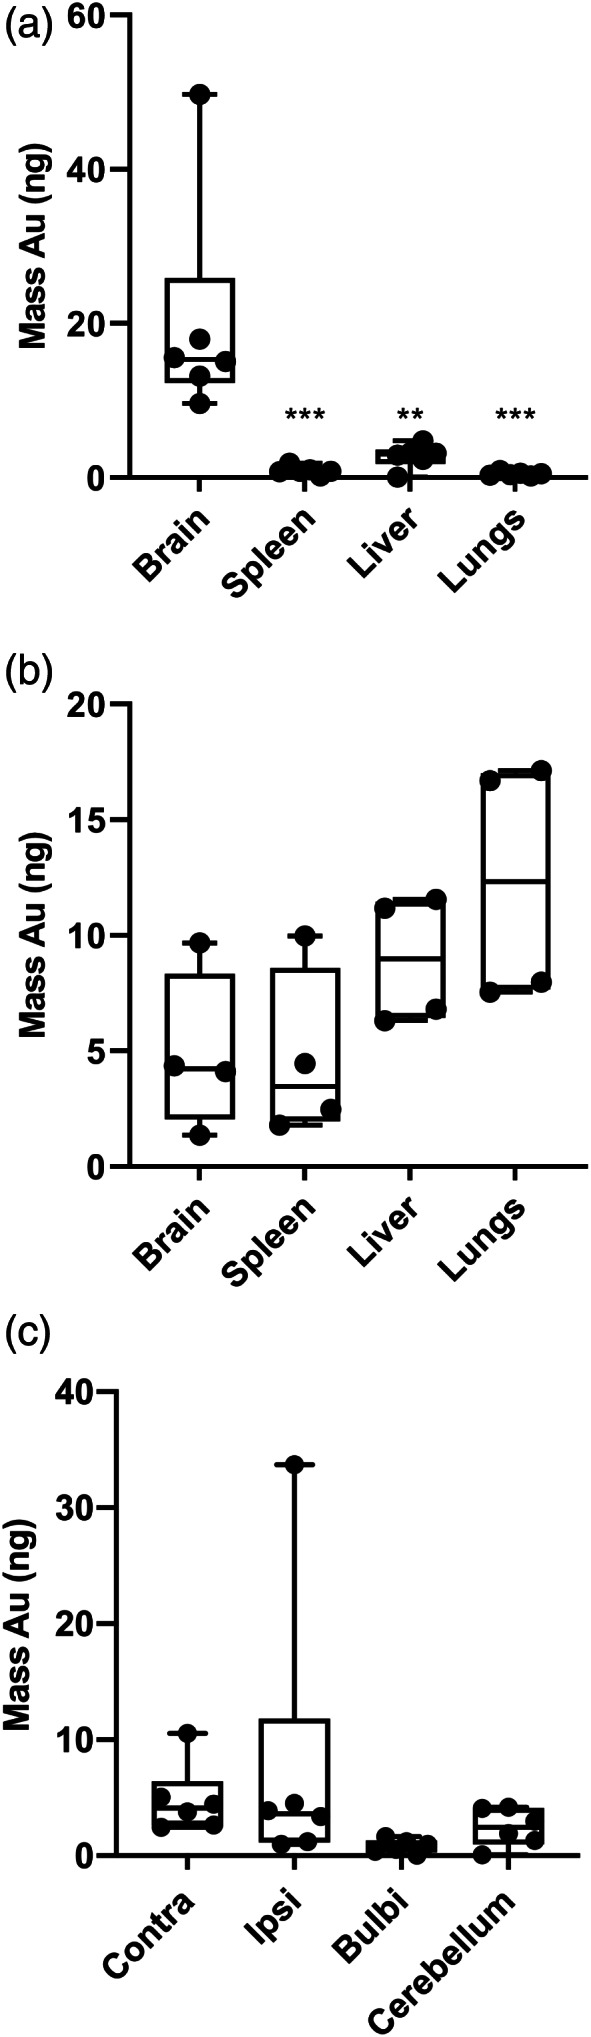
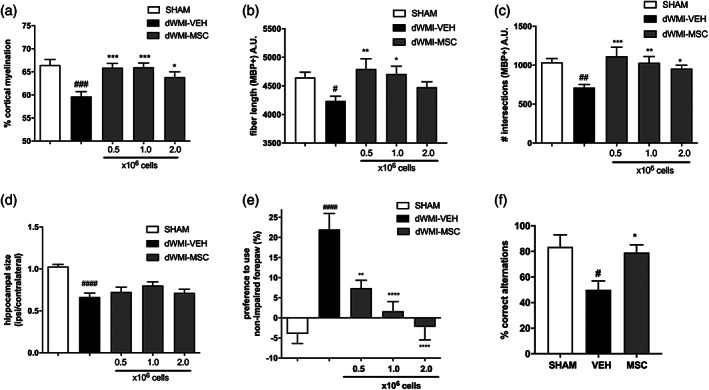
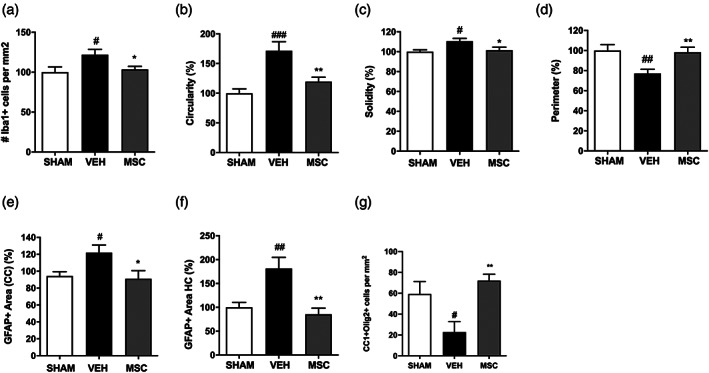
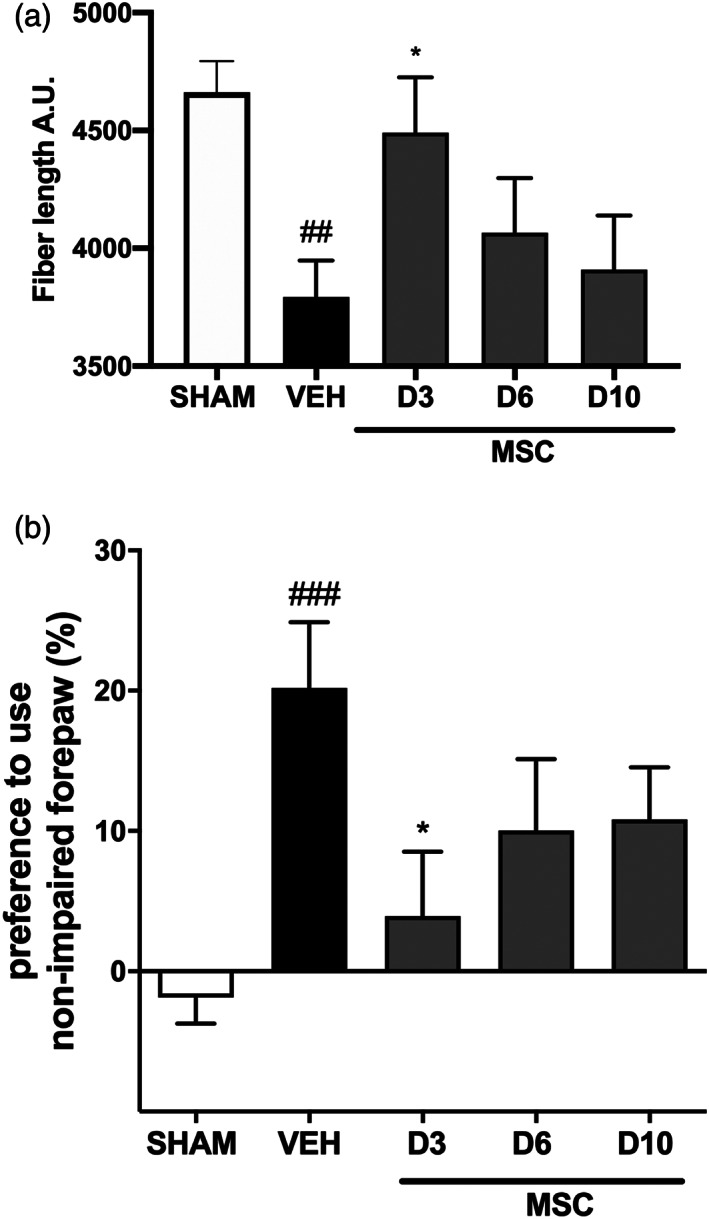
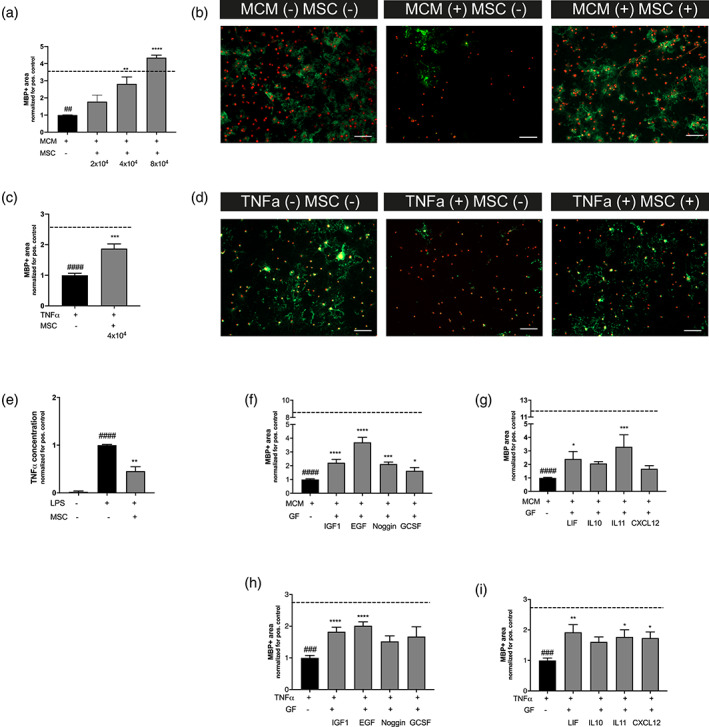
Encephalopathy of prematurity (EoP) is a common cause of long-term neurodevelopmental morbidity in extreme preterm infants. Diffuse white matter injury (dWMI) is currently the most commonly observed form of EoP. Impaired maturation of oligodendrocytes (OLs) is the main underlying pathophysiological mechanism. No therapies are currently available to combat dWMI. Intranasal application of mesenchymal stem cells (MSCs) is a promising therapeutic option to boost neuroregeneration after injury. Here, we developed a double-hit dWMI mouse model and investigated the therapeutic potential of intranasal MSC therapy. Postnatal systemic inflammation and hypoxia-ischemia led to transient deficits in cortical myelination and OL maturation, functional deficits and neuroinflammation. Intranasal MSCs migrated dispersedly into the injured brain and potently improved myelination and functional outcome, dampened cerebral inflammationand rescued OL maturation after dWMI. Cocultures of MSCs with primary microglia or OLs show that MSCs secrete factors that directly promote OL maturation and dampen neuroinflammation. We show that MSCs adapt their secretome after ex vivo exposure to dWMI milieu and identified several factors including IGF1, EGF, LIF, and IL11 that potently boost OL maturation. Additionally, we showed that MSC-treated dWMI brains express different levels of these beneficial secreted factors. In conclusion, the combination of postnatal systemic inflammation and hypoxia-ischemia leads to a pattern of developmental brain abnormalities that mimics the clinical situation. Intranasal delivery of MSCs, that secrete several beneficial factors in situ, is a promising strategy to restore myelination after dWMI and subsequently improve the neurodevelopmental outcome of extreme preterm infants in the future.

Keywords: diffuse white matter injury; encephalopathy of prematurity; mesenchymal stem cells; microglia; oligodendrocytes; preterm birth; regenerative medicine.


Figures

FIGURE 1
FIGURE 1
The combination of postnatal hypoxia/ischemia and systemic inflammation at P5 (dWMI model) causes a delay in myelination in neonatal mice. (a) Mice exposed to the double‐hit model displayed a transient reduction in cortical myelination (P19 SHAM n = 11 dWMI n = 11, P26 n = 7 in both groups, P33 SHAM n = 4 dWMI n = 5). (b) Representative fluorescent images (×2.5) of the ipsilateral cortex of a sham‐operated control mouse (left) and dWMI mouse (right) stained for axonal marker NF200 (red) and myelin marker MBP (green). Scale bars: 500 μm. (c, e) Microstructural changes in MBP+ fibers following dWMI induction were observed at P19 and P26, assessed by measuring fiber length (c) and number of intersections (e) (P19 SHAM n = 11 dWMI n = 11, P26 n = 8 in both groups, P33 SHAM n = 4 dWMI n = 5). (d) Representative fluorescent images (×40) of MBP+ axons in the ipsilateral cortex of a sham‐operated control mouse (left) and dWMI mouse (right). Scale bars: 100 μm (f) G‐ratio analyses (axonal diameter divided by the fiber diameter including the myelin sheath) reveal no changes in myelin enwrapment at P33 in SHAM (n = 3) and dWMI (n = 4) animals. (g) Representative electron microscopy images of the caudal corpus callosum in SHAM and dWMI animals at P33. Scale bars: 2 μm. **p < .01; ***p < .001 sham‐operated control versus dWMI animals at the specified timepoint [Color figure can be viewed at wileyonlinelibrary.com]
FIGURE 2
FIGURE 2
dWMI induction causes functional impairments in absence of cortical axonal deficits or acute neuronal loss. (a) Mice with dWMI displayed a persistent unilateral reduction in ipsilateral hippocampal size compared with sham‐control mice (P19/26 SHAM n = 7 dWMI = 7, P33 SHAM n = 4 dWMI n = 5). (b) Representative images of the ipsilateral HE‐stained hippocampus of a sham‐operated control mouse (left) and dWMI mouse (right). (c) No significant changes in NF200+ area were observed in the ipsilateral cortex of sham‐control (P19 n = 4, P26 n = 7, P33 n = 4) versus dWMI (P19 n = 4, P26 n = 7, P33 n = 5) animals. (d) Representative fluorescent images (×40) of NF200+ axons in the ipsilateral cortex of a sham‐control mouse (left) and dWMI mouse (right). Scale bars: 100 μm (e) Representative whole brain images stained for MAP2 at P19 showing reduced hippocampal area (arrow) but no further indications of overt neuronal loss. (f) dWMI animals (P19 n = 6, P26 n = 7, and P33 n = 7) performed worse compared with sham‐controls (P19 n = 8, P26 n = 8, and P33 n = 5) animals in the cylinder rearing test up to P26, indicating unilateral motor impairment. (g) Compared with sham‐control animals (n = 8), dWMI mice (n = 8) made less correct spontaneous alterations in the T‐maze at P26. (h,i) No changes in time spent in the inner zone (h) or frequency of inner zone entry (i) between sham‐control (n = 11) and dWMI (n = 11) were observed in the open field test at P26. **p < .01;****p < .0001 sham‐operated control versus dWMI animals at the specified timepoint [Color figure can be viewed at wileyonlinelibrary.com]
FIGURE 3
FIGURE 3
Microglia and astrocyte activity is transiently increased in dWMI animals. (a) dWMI induction leads to a transient rise in microglia (Iba+) numbers in the corpus callosum (P19 SHAM n = 6 dWMI n = 9, P26 SHAM n = 6 dWMI n = 10, P33 SHAM n = 7 dWMI n = 8). (b–d) Microglia in the corpus callosum of dWMI animals (P19/26/33 n = 8) demonstrate a more pro‐inflammatory phenotype with increased cell circularity (b) solidity (c), and decrease in cell perimeter (d) up to P26 compared with sham‐control (P19/26 n = 5, P33 n = 7, normalized to control values) mice. (e) Representative fluorescent images (×40) of Iba + cells in the corpus callosum (white outline) in a sham‐control (left) and dWMI animal (right). Scale bars: 100 μm (f, g) Quantification of GFAP+ area revealed increased astrocyte reactivity in dWMI animals (P19 n = 14, P26 n = 8, P33 n = 5, normalized to control values) compared with sham‐controls (P19 n = 10, P26 n = 7, P33 n = 4) in the corpus callosum and hippocampus at P26. (h,i). Representative fluorescent images (×40) of GFAP+ staining in the corpus callosum (h) and hippocampus (i) in a sham‐control (upper) and dWMI (lower) animal. Scale bars: 100 μm. *p < .05; ***p < .001 sham‐operated control versus dWMI animals at the specified timepoint [Color figure can be viewed at wileyonlinelibrary.com]
FIGURE 4
FIGURE 4
dWMI induction leads to global volumetric deficits on postmortem MRI. (a–j) dWMI animals (n = 9) displayed a reduction in volume (μl) of multiple white and gray matter structures compared with sham‐controls (n = 9) at P26. *p < .05; **p < .01. Nearly significant p values are indicated in (a) and (c)
FIGURE 5
FIGURE 5
dWMI is associated with an early proliferative response of the OL lineage, followed by maturation arrest. (a,c) dWMI induction leads to an early increase (P8) of Ki67+/Olig2+ cells in the cortex (a), indicative of a proliferative response of the OL lineage. This proliferative response is absent in the corpus callosum (c) (SHAM n = 10, dWMI n = 7). (b) Representative fluorescent images of the cortex of a sham‐control (left) and dWMI (right) animal at P8, double‐stained for Ki67 (green) and Olig2 (red). Double‐positive cells are marked with an arrowhead. Scale bars: 100 μm. (d,f) dWMI mice (n = 12) showed a higher quantity of Ki67 + Olig2+ cells in the corpus callosum (d) compared with sham‐controls (n = 12) at P19, indicative of increased OL proliferation. No differences in Ki67 + Olig2+ cells were found in the cortex (f). (e) Representative fluorescent images (x20) of the corpus callosum (white outline), double‐stained for Ki67 (green) and Olig2 (red), of a sham‐control (left) and dWMI (right) mouse at P19. Double‐positive cells are marked with an arrowhead. Scale bars: 100 μm. (g,i) At P19, a lower quantity of mature (CC1+/Olig+) OLs was observed in the cortex (g) of dWMI animals (n = 5), compared with sham‐control animals (n = 5). We did not detect differences in the number of mature CC1+/Olig2+) OLs in the corpus callosum (i). (h) Representative fluorescent images of the P19 cortex, double‐stained for CC1(green) and Olig2 (red), of a sham‐control (left) and dWMI (right) mouse. Double‐positive cells are marked with an arrowhead. Scale bars: 100 μm. (j, k) At P8, no significant changes in the number of cleaved caspase3+/Olig2+ cells were observed in the corpus callosum (j) or cortex (k) of dWMI (n = 9) versus sham‐control (n = 10) mice. (l) Representative fluorescent images of the corpus callosum (white outline), double‐stained for cleaved caspase 3 (green) and Olig2 (red) of a sham‐control (left) and dWMI (right) animal at P8. Double‐positive cells are marked with an arrowhead. Scale bars: 100 μm. (m, n) dWMI induction is associated with an increase in Olig2+ cells, representing the total OL population, in the cortex (m), but not in the corpus callosum (n) (SHAM n = 10, dWMI n = 7). *p < .05; **p < .01 sham‐operated control versus dWMI animals [Color figure can be viewed at wileyonlinelibrary.com]
FIGURE 6
FIGURE 6
Intranasally administered silica coated gold nanoparticle‐labeled MSCs evenly distribute throughout the brain after dWMI induction. (a,b) After intranasal administration of nanoparticle‐labeled MSCs at D3 (i.e., P8) after injury induction or sham operation, the highest mass of gold was observed in the brain for dWMI animals (n=6) (a) versus peripheral organs in sham‐control animals (n=6) (b). (c) Gold nanoparticles, used to label MSCs, were evenly distributed throughout the brain parts after dWMI **p < .01; ***p < .001 peripheral organs versus brain
FIGURE 7
FIGURE 7
Intranasal MSC treatment boosts myelination and rescues motor and cognitive impairments in dWMI mice. (a) Intranasal administration of 0.5 × 106 (n = 11), 1.0 × 106 (n = 11), and 2.0 × 106 (n = 14) MSCs restores MBP+ coverage of the cortex up to sham‐control levels (n = 13), when compared with vehicle treatment (n = 12). (b,c) An intranasal dose of 0.5 × 106 and 1.0 × 106 MSCs completely restored myelin complexity assessed by fiber length (b) and the number of intersections (c), to sham‐control level (SHAM n = 13, VEH n = 16, 0.5 × 106 MSCs n = 12, 1.0 × 106 MSCs n = 13, and 2.0 × 106 MSCs n = 13). (d) Intranasal MSC treatment does not restore hippocampal size (SHAM n = 14, VEH n = 14,0.5 × 106 MSCs n = 18, 1.0 × 106 MSCs n = 18, and 2.0 × 106 MSCs n = 16). (e) Motor performance measured with the cylinder rearing test improved after MSC treatment (SHAM n = 14, VEH n = 14, 0.5 × 106 MSCs n = 12, 1.0 × 106 MSCs n = 15, and 2.0 × 106 MSCs n = 11). (f) Intranasal treatment with 0.5 × 106 MSCs restores the percentage of correct alternations in the T‐maze up to sham‐control levels in dWMI mice (SHAM n = 4, VEH n = 4, and 0.5 × 106 MSCs n = 8). #p < .05; ##p < .01; ###p < .001; ####p < .0001 vehicle‐treated dWMI animals versus sham‐controls; *p < .05; **p < .01; ***p < .001; ****p < .0001 MSC‐treated dWMI animals versus vehicle‐treated dWMI animals
FIGURE 8
FIGURE 8
Intranasal MSC treatment dampens the neuro‐inflammatory response and restores OL maturation following dWMI (a) Quantification of microglia density in the corpus callosum revealed a reduction of Iba1 + cells after MSC treatment compared with vehicle treatment (SHAM n = 9, VEH n = 10, MSC n = 14). (b–d) Microglia morphology analyses assessed by cell circularity (b), solidity (c), and perimeter (d), showed a less pro‐inflammatory phenotype following MSC treatment compared with vehicle treatment (SHAM n = 9, VEH n = 11, MSC n = 12, normalized to control values). (e,f) A reduction in GFAP+ area in the corpus callosum (e) and hippocampus (f) was observed following intranasal MSC treatment compared with vehicle‐treatment (SHAM n = 8, VEH n = 8, MSC n = 8, normalized to control values). G. Intranasal administration of 0.5 × 106 MSCs restored CC1+/Olig2+ cells numbers up to sham‐control levels in dWMI animals, indicating a boost in OL lineage maturation (SHAM n = 6, VEH n = 6, MSC n = 13). #p < .05; ##p < .01; ###p < .001 vehicle‐treated dWMI animals versus sham‐controls; *p < .05; **p < .01 MSC‐treated dWMI versus vehicle‐treated dWMI animals
FIGURE 9
FIGURE 9
Delayed intranasal administration reduces the regenerative potential of MSCs. (a). Fiber length, a microstructural myelin parameter, was restored in dWMI animals that received MSC treatment at 3 days after injury induction. Delay in MSC treatment to 6 or 10 days led to a reduction in treatment efficacy (SHAM n = 13, VEH n = 13, MSC‐day 3 n = 14, MSC‐day 6 n = 9, MSC‐day 10 n = 9). (b) The beneficial effect of MSC treatment on motor performance, measured with the cylinder rearing test, was partially lost when MSC treatment was postponed to day 6 or day 10 after dWMI induction (SHAM n = 18, VEH n = 14, MSC‐day 3 n = 7, MSC‐day 6 n = 11, MSC‐day 10 n = 9). ##p < .01; ###p < .001 vehicle‐treated dWMI animals versus sham‐controls; *p < .05; MSC‐day three treated dWMI versus vehicle‐treated dWMI animals
FIGURE 10
FIGURE 10
The MSCs secretome boosts OL maturation and attenuates microglia activation in vitro. (a) MCM + LPS causes a reduction in MBP+ area (dashed line represents MBP+ area in MCM‐LPS control condition), MSC treatment with 4 × 104 or 8 × 104 MSCs in a noncontact co‐culture significantly improves OL maturation (n = 3 independent experiments, 3–4 observations per experiment normalized for the positive control, for example, cells exposed to MCM + LPS). (b) Representative fluorescent images (×10) of primary cultured oligodendrocytes stained for oligodendrocyte marker Olig2 (red) and myelin component MBP (green). Cells were exposed to MCM‐LPS (MCM−) or MCM + LPS (MCM+) and 4 × 104 MSCs (MSC+) in a noncontact gel‐insert. Scale bars: 100 μm. (c) Exposure to 10 ng/ml TNFα leads to a reduction in MBP production (dashed line represents MBP+ area in medium without TNFα), MSC treatment with 4x10⁴ MSCs in a noncontact co‐culture significantly boosts OL maturation (n = 2 independent experiments, 3–4 observations per experiment, normalized for the positive control, for example, cells exposed to TNFα). (d) Representative fluorescent images (×10) of primary cultured oligodendrocytes stained for oligodendrocyte marker Olig2 (red) and myelin component MBP (green). Cells were exposed to medium with (+) or without (−) 10 ng/ml TNFα and 4 × 104 MSCs (MSC+) in noncontact gel‐insert. Scale bars: 100 μm. (e). Treatment with 4 × 104 MSCs in a noncontact gel‐insert attenuates microglial TNFα production (n = 2 independent experiments, two observations per experiment, normalized for the positive control, for example, cells exposed to LPS). (f,g) Addition of IGF1, EGF, Noggin, GCSF, LIF, and IL11 but not IL10 and CXCL12 significantly improves MBP+ area by primary cultured oligodendrocytes following MCM + LPS exposure (dashed line represents MBP+ area in MCM‐LPS control condition) (n = 2 independent experiments, 3–4 observations per experiment normalized for the positive control, for example, cells exposed to MCM + LPS). (h,i) Addition of IGF1, EGF, LIF, IL11, and CXCL12 but not Noggin, G‐CSF, and IL10 boosts OL maturation after TNFα‐induced OL maturational arrest (dashed line represents MBP+ area in medium without TNFα) (n = 2 independent experiments, 3–4 observations per experiment, normalized for the positive control, for example, cells exposed to TNFα). ##p < .01; ###p < .001; ####p < .0001 MCM+ or TNF+ condition (black bars) versus MCM‐ or TNFα‐ control (dashed line), respectively; *p < .05; **p < .01; ***p < .001; ****p < .0001 factor‐exposed MCM+ or TNF+ condition (gray bars) versus MCM+ or TNF+ control condition (black bars) [Color figure can be viewed at wileyonlinelibrary.com]

Similar articles

Cited by

References

    1. Allin, M. P. , Kontis, D. , Walshe, M. , Wyatt, J. , Barker, G. J. , Kanaan, R. A. , … Nosarti, C. (2011). White matter and cognition in adults who were born preterm. PLoS One, 6(10), e24525 10.1371/journal.pone.0024525 - DOI - PMC - PubMed
    1. Back, S. A. (2017). White matter injury in the preterm infant: Pathology and mechanisms. Acta Neuropathologica, 134(3), 331–349. 10.1007/s00401-017-1718-6 - DOI - PMC - PubMed
    1. Back, S. A. , & Miller, S. P. (2014). Brain injury in premature neonates: A primary cerebral dysmaturation disorder? Annals of Neurology, 75(4), 469–486. 10.1002/ana.24132 - DOI - PMC - PubMed
    1. Baxi, E. G. , DeBruin, J. , Jin, J. , Strasburger, H. J. , Smith, M. D. , Orthmann‐Murphy, J. L. , … Calabresi, P. A. (2017). Lineage tracing reveals dynamic changes in oligodendrocyte precursor cells following cuprizone‐induced demyelination. Glia, 65(12), 2087–2098. 10.1002/glia.23229 - DOI - PMC - PubMed
    1. Behrens, T. E. , Berg, H. J. , Jbabdi, S. , Rushworth, M. F. , & Woolrich, M. W. (2007). Probabilistic diffusion tractography with multiple fibre orientations: What can we gain? NeuroImage, 34(1), 144–155. 10.1016/j.neuroimage.2006.09.018 - DOI - PMC - PubMed

Publication types