. 2020 Oct 12;21(1):709.
doi: 10.1186/s12864-020-07114-8.

Predicting and clustering plant CLE genes with a new method developed specifically for short amino acid sequences

Affiliations

Predicting and clustering plant CLE genes with a new method developed specifically for short amino acid sequences

Zhe Zhang et al. BMC Genomics. .

Erratum in

Abstract

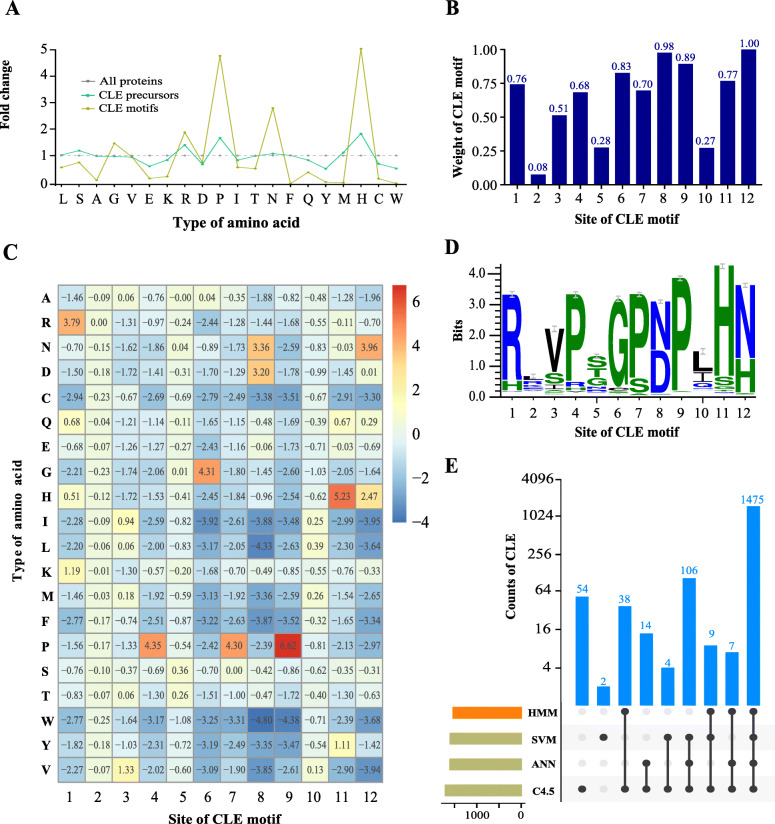
Background: The CLV3/ESR-RELATED (CLE) gene family encodes small secreted peptides (SSPs) and plays vital roles in plant growth and development by promoting cell-to-cell communication. The prediction and classification of CLE genes is challenging because of their low sequence similarity.

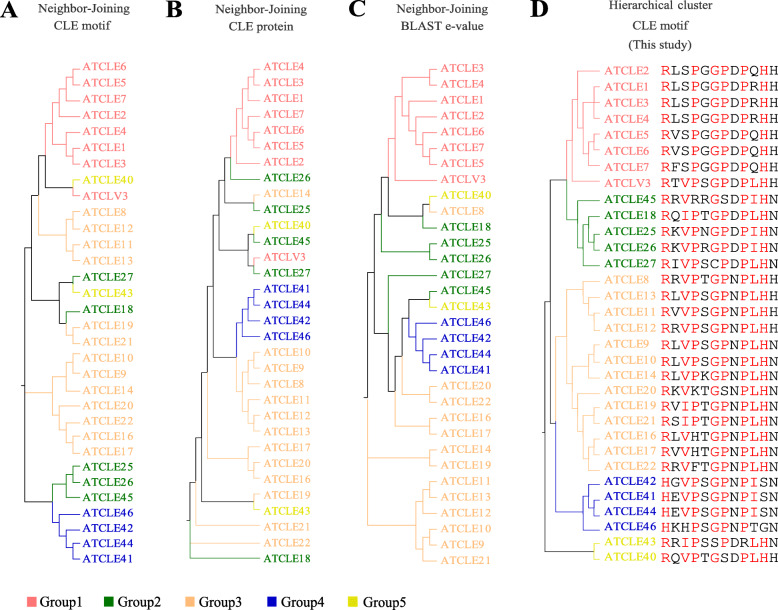
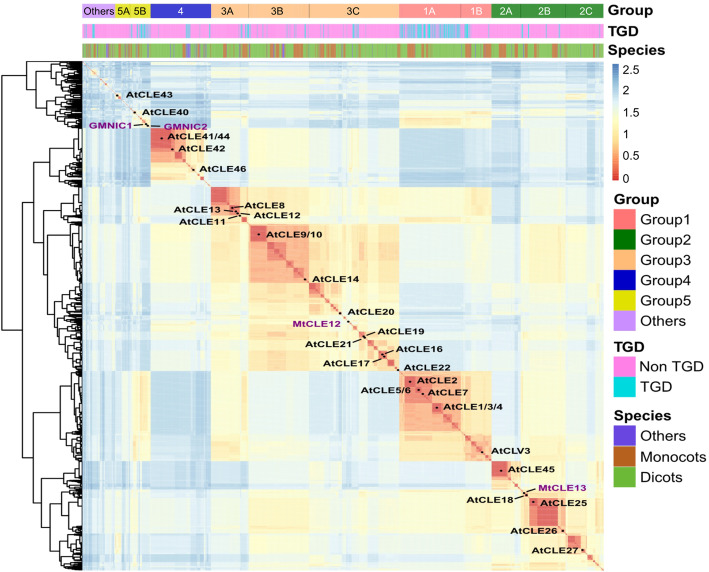
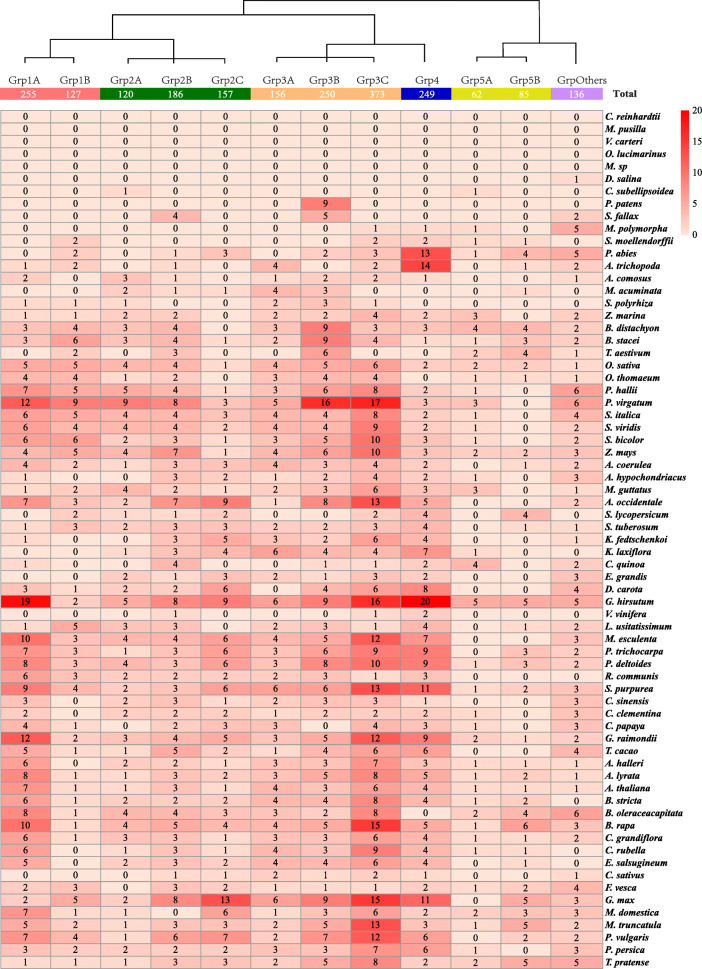
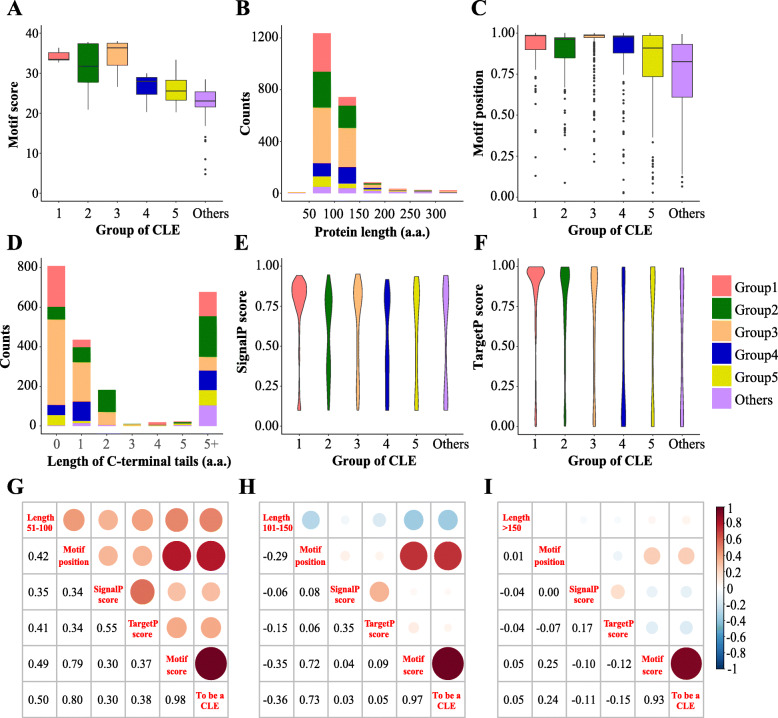
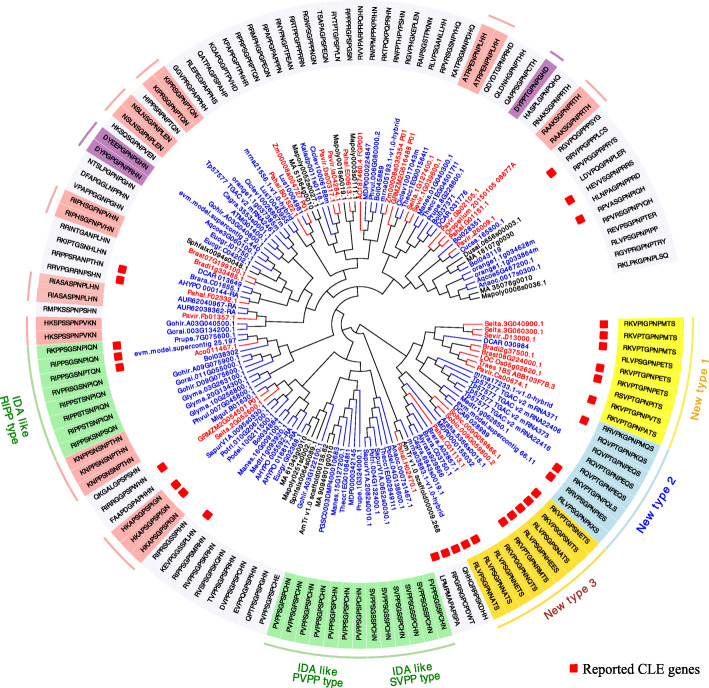
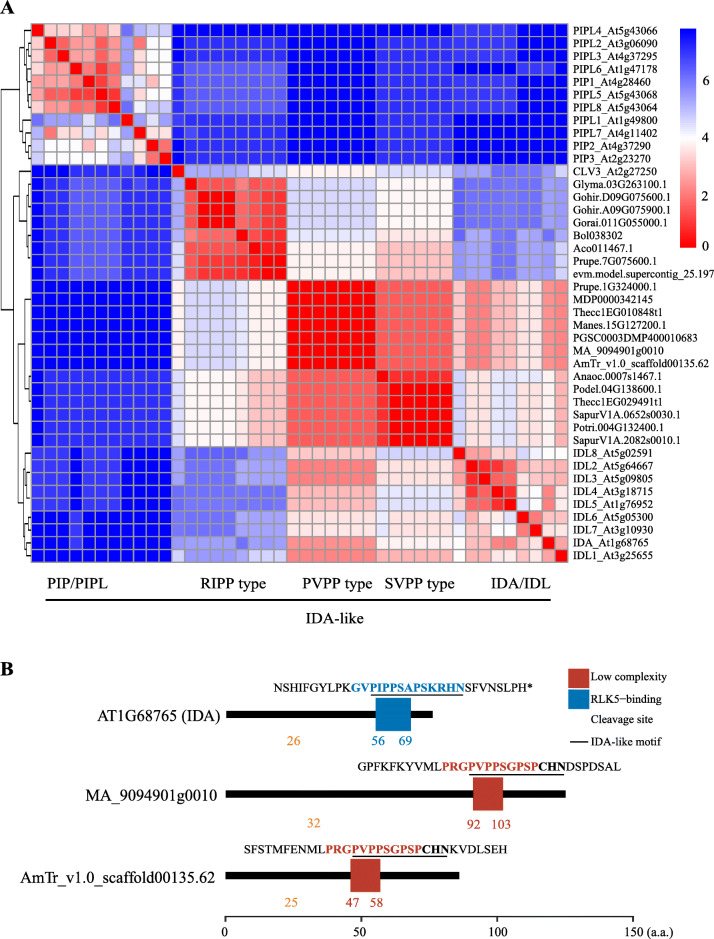
Results: We developed a machine learning-aided method for predicting CLE genes by using a CLE motif-specific residual score matrix and a novel clustering method based on the Euclidean distance of 12 amino acid residues from the CLE motif in a site-weight dependent manner. In total, 2156 CLE candidates-including 627 novel candidates-were predicted from 69 plant species. The results from our CLE motif-based clustering are consistent with previous reports using the entire pre-propeptide. Characterization of CLE candidates provided systematic statistics on protein lengths, signal peptides, relative motif positions, amino acid compositions of different parts of the CLE precursor proteins, and decisive factors of CLE prediction. The approach taken here provides information on the evolution of the CLE gene family and provides evidence that the CLE and IDA/IDL genes share a common ancestor.

Conclusions: Our new approach is applicable to SSPs or other proteins with short conserved domains and hence, provides a useful tool for gene prediction, classification and evolutionary analysis.

Keywords: CLE; Euclidean distance; Evolution; Gene clustering; Gene prediction; Machine learning; Peptide hormone.


Conflict of interest statement

The authors declare that they have no competing interests.

Figures

Fig. 1
Fig. 1
Methods and results for predicting CLE genes. a Fold changes in the amino acid frequencies in CLE precursors and CLE motifs from 69 species. The amino acid composition of all proteins was used as a control (set to 1.0). The grey, aquamarine and lemon colored lines indicate all proteins, CLE precursors and CLE motifs, respectively. b Weight at each site of the CLE motif. c Score matrix of CLE motifs. The amino acids are indicated at the left using single letter codes. The numbers in the grid represent the score of each amino acid at sites 1 through 12. d Weblogo of the 12-residue CLE motif from the 1529 reported CLE genes [7]. e UpSet plot for visualizing the intersecting sets of CLE genes predicted by different methods. The number of CLE genes at each intersection was labeled in blue on the top of the appropriate column
Fig. 2
Fig. 2
Clustering analysis of Arabidopsis CLE motifs. Phylogenetic tree of AtCLE motifs (a), full-length proteins without signal peptides (b) and log-normalized rank of all-vs-all BLAST e-values generated using the NJ method based on the evolutionary distances (c), which were computed using the Poisson correction method (a, b), and Euclidean distances (c). d Clustering of the AtCLE motifs based on the Euclidean distance of each pair of sequences in a site-weight dependent manner. The tree was constructed using the HCL method. The names of the CLE motifs are indicated with different colors
Fig. 3
Fig. 3
Clustering analysis of CLE motifs in plants. The heat map shows the Euclidean distance of 2156 CLE motifs in 69 plant species. Red represents short distances. Blue represents long distances. A shorter Euclidean distance implies a higher degree of motif similarity. CLE motifs were clustered based on the Euclidean distance of each pair of sequences in a site-weight dependent manner. The clustering tree was generated using the HCL method. The information on the classification of the CLE motifs is shown on the top of the heatmap. All CLE motifs were clustered into six major groups: Group 1–5 and Group “others”. “TGD” and “Non-TGD” indicate whether the motif was from a potential tandem gene duplication (TGD). “Species” indicates that a motif was from a dicot, monocot or other type of plant species
Fig. 4
Fig. 4
Evolution of CLE genes in plants. The number of CLE candidate genes from each group in each species was counted and indicated in the grid. The 2156 CLE candidates were from 12 groups and 69 species. The abundance of CLE candidates in each group is indicated with different shades of red. A darker shade of red indicates more group members. A lighter shade of red indicates fewer group members. The Latin name of each species is indicated on the right. The group name is indicated at the top of the grid. The total number of CLE candidates in each subgroup is indicated in the appropriate box. The clustering tree on the top is a simplified version of the tree from Fig. 3
Fig. 5
Fig. 5
Statistical analysis of the major characteristics of CLE precursors in plants. The major characteristics of 2156 CLE precursor proteins were analyzed, including CLE motif scores (a), protein lengths (b), CLE motif positions (c), lengths of the C-terminal tails (d), and SignalP (e) and TargetP scores (f). Different groups are represented with different colors (a-f). Histogram: the height of the column represents the CLE candidate counts (b, d). The line in the box represents the median value. The upper and lower boundary of the box represents the upper and lower quartile values, respectively. The top and bottom of the line represents the maximum and minimum value of non-outliers, respectively. The points represent outliers (a, c). The widths of the violins represent the distribution density of the indicated value. The tails of the violins were trimmed to match the range of the data (e, f). g-i Correlation between the different characteristics of each CLE candidate in three ranges of protein length: 51–100, 101–150 and > 150 amino acid residues, respectively
Fig. 6
Fig. 6
Identification of novel CLE candidates in Group “others”. From the inside to the outside of the ring diagram: clustering tree, gene ID, reporting status, motif sequences, and annotation. The Gene IDs represented in red, blue and black indicate monocot, dicot and other plant species, respectively. Genes that have been reported are marked with red boxes. Candidate motifs of particular interest are highlighted with different colors. New types1, 2 and 3 are highlighted with yellow, light blue and gold, respectively. IDA-like CLE candidates are highlighted with light green. CLE candidates that appeared more than once in Group “others” are labeled with light red. CLE candidates starting with “DY” are indicated with purple
Fig. 7
Fig. 7
Clustering analysis of IDA-like CLE motifs and Arabidopsis IDA/IDL motifs. a Clustering of IDA-like CLE motifs and Arabidopsis IDA/IDL, PIP/PIPL and CLV3 motifs. The heat map indicates the Euclidean distance of each pair of motifs. Red represents short distances. Blue represents long distances. A shorter Euclidean distance implies a higher similarity. b Protein domain schematic diagram of Arabidopsis IDA and two “PVPP-type” IDA-like CLE candidates. Protein domains were predicted using SMART. Blue box: RLK5-binding domain; red-brown box: low complexity domain; pale-brown triangle: location of the cleavage site of the signal peptide for the secretory pathway; black underline: IDA or IDA-like motif

Similar articles

Cited by

References

    1. Ryan CA, Pearce G, Scheer J, Moura DS. Polypeptide hormones. Plant Cell. 2002;14(Suppl):S251–S264. doi: 10.1105/tpc.010484. - DOI - PMC - PubMed
    1. Matsubayashi Y, Sakagami Y. Peptide hormones in plants. Annu Rev Plant Biol. 2006;57:649–674. doi: 10.1146/annurev.arplant.56.032604.144204. - DOI - PubMed
    1. Murphy E, Smith S, De Smet I. Small signaling peptides in Arabidopsis development: how cells communicate over a short distance. Plant Cell. 2012;24(8):3198–3217. doi: 10.1105/tpc.112.099010. - DOI - PMC - PubMed
    1. Matsubayashi Y. Posttranslationally modified small-peptide signals in plants. Annu Rev Plant Biol. 2014;65:385–413. doi: 10.1146/annurev-arplant-050312-120122. - DOI - PubMed
    1. Clark SE, Running MP, Meyerowitz EM. CLAVATA1, a regulator of meristem and flower development in Arabidopsis. Development. 1993;119(2):397–418. - PubMed

LinkOut - more resources