

Time trends in the regional distribution of physicians, nurses and midwives in Europe
- PMID: 33046077
- PMCID: PMC7549210
- DOI: 10.1186/s12913-020-05760-y
Time trends in the regional distribution of physicians, nurses and midwives in Europe
Abstract
Background: Country-level data suggest large differences in the supply of health professionals among European countries. However, little is know about the regional supply of health professionals taking a cross-country comparative perspective. The aim of the study was to analyse the regional distribution of physicians, nurses and midwives in the highest and lowest density regions in Europe and examine time trends.
Methods: We used Eurostat data and descriptive statistics to assess the density of physicians, nurses and midwives at national and regional levels (Nomenclature of Territorial Units for Statistics (NUTS) 2 regions) for 2017 and time trends (2005-2017). To ensure cross-country comparability we applied a set of criteria (working status, availability over time, geographic availability, source). This resulted in 14 European Union (EU) countries and Switzerland being available for the physician analysis and eight countries for the nurses and midwives analysis. Density rates per population were analysed at national and NUTS 2 level, of which regions with the highest and lowest density of physicians, nurses and midwives were identified. We examined changes over time in regional distributions, using percentage change and Compound Annual Growth Rate (CAGR).
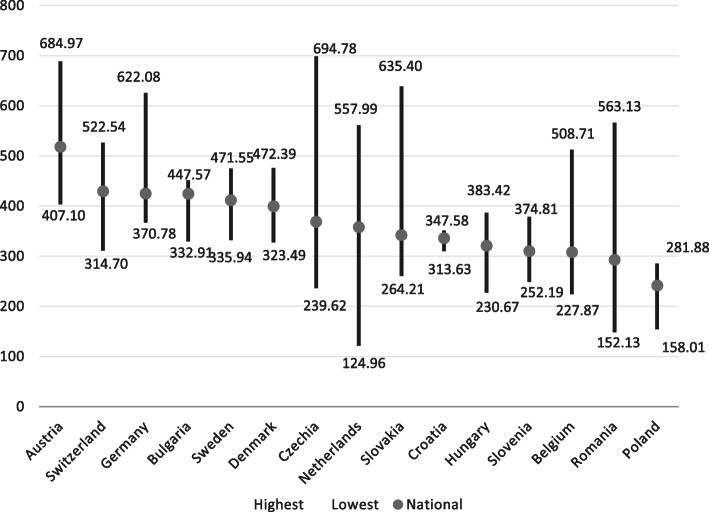
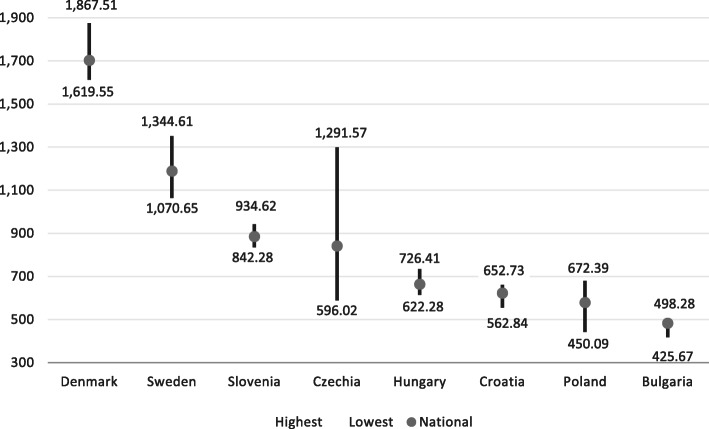
Results: There was a 2.4-fold difference in the physician density between the highest and lowest density countries (Austria national average: 513, Poland 241.6 per 100,000) and a 3.5-fold difference among nurses (Denmark: 1702.5, Bulgaria: 483.0). Differences by regions across Europe were higher than cross-country variations and varied up to 5.5-fold for physicians and 4.4-fold for nurses/midwives and did not improve over time. Capitals and/or major cities in all countries showed a markedly higher supply of physicians than more sparsely populated regions while the density of nurses and midwives tended to be higher in more sparsely populated areas. Over time, physician rates increased faster than density levels of nurses and midwives.
Conclusions: The study shows for the first time the large variation in health workforce supply at regional levels and time trends by professions across the European region. This highlights the importance for countries to routinely collect data in sub-national geographic areas to develop integrated health workforce policies for health professionals at regional levels.
Keywords: Europe; Health professionals; Health workforce distribution; Health workforce policy; Health workforce research; Rural; Shortage; Supply; Urban.
Conflict of interest statement
The authors (JW, CBM and UM) declare that they have no competing interests.
Figures
References
-
- Anand S, Bärnighausen T. Health workers at the core of the health system: Framework and research issues. Health Policy (New York). 2012. - PubMed
-
- WHO . Working togehter for health. Geneva: The World Health Report 2006; 2006.
-
- OECD. Health workforce policies in OECD countries: right jobs, right skills, right places [internet]. OECD health policy studies. Paris; 2016. Available from: https://www.oecd-ilibrary.org/social-issues-migration-health/health-work....
MeSH terms
LinkOut - more resources
Full Text Sources
