Impact of low and no alcohol beers on purchases of alcohol: interrupted time series analysis of British household shopping data, 2015-2018
- PMID: 33046462
- PMCID: PMC7552865
- DOI: 10.1136/bmjopen-2019-036371
Impact of low and no alcohol beers on purchases of alcohol: interrupted time series analysis of British household shopping data, 2015-2018
Abstract
Objective: To assess the impact of new low and no alcohol beers and reformulated beers in Great Britain on household purchases of grams of alcohol.
Design: Interrupted time series analysis.
Setting: Purchase data from Kantar Worldpanel's household shopping panel for 2015-2018.
Participants: 64 286 British households.
Interventions: Introduction of new no and low alcohol beers during 2017-2018 and reformulation of existing beers to contain less alcohol during 2018.
Main outcome measures: Average alcoholic strength of beer and number of grams of alcohol purchased by households.
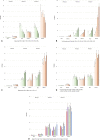
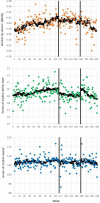
Results: As assessed by British household purchase data, 46 new low and no alcohol beer products were introduced during 2015-2018, with a step-jump in volume purchased occurring at the beginning of March 2017 (event 1). During 2015-2018, 33 beer products were reformulated to contain less alcohol, with a step-jump in volume purchased occurring during mid-March 2018 (event 2). Interrupted time series analyses found a combined associated impact of both events with relative reductions of alcohol by volume of beer between 1.2% and 2.3%; purchases of grams of alcohol within beer between 7.1% and 10.2%; and purchases of grams of alcohol as a whole between 2.6% and 3.9%. The reductions were greater for reformulation than for the introduction of new low and no alcohol products. Reductions were independently higher for younger age groups of shoppers and for households that bought the most alcohol.
Conclusions: Even though the events were associated with significant beneficial changes, the volume of purchases of new low and no alcohol beer products (2.6% of the volume of all beers purchased during 2018) and of new reformulated beer products (6.9% of the volume of all beers purchased during 2018) was very small. This indicates that there are future opportunities to increase the volume of such products so as to reduce the harm done by alcohol.
Keywords: epidemiology; public health; substance misuse.
© Author(s) (or their employer(s)) 2020. Re-use permitted under CC BY-NC. No commercial re-use. See rights and permissions. Published by BMJ.
Conflict of interest statement
Competing interests: PA declares receipt of funds from AB InBev Foundation, outside of the submitted work. Kantar Worldpanel reviewed the method description as it describes the purchase data.
Figures


References
MeSH terms
Grants and funding
LinkOut - more resources
Full Text Sources
Research Materials
