. 2020 Dec 15;89(1):e00618-20.
doi: 10.1128/IAI.00618-20. Print 2020 Dec 15.

Escherichia coli K12 Upregulates Programmed Cell Death Ligand 1 (PD-L1) Expression in Gamma Interferon-Sensitized Intestinal Epithelial Cells via the NF-κB Pathway

Affiliations

Escherichia coli K12 Upregulates Programmed Cell Death Ligand 1 (PD-L1) Expression in Gamma Interferon-Sensitized Intestinal Epithelial Cells via the NF-κB Pathway

Seul A Lee et al. Infect Immun. .

Abstract

Programmed cell death ligand-1 (PD-L1) is an immune checkpoint protein which is used by tumor cells for immune evasion. PD-L1 is upregulated in inflamed intestinal tissues. The intestinal tract is colonized by millions of bacteria, most of which are commensal bacterial species. We hypothesized that under inflammatory conditions, some commensal bacterial species contribute to increased PD-L1 expression in intestinal epithelium and examined this hypothesis. Human intestinal epithelial HT-29 cells with and without interferon (IFN)-γ sensitization were incubated with six strains of four enteric bacterial species. The mRNA and protein levels of PD-L1 in HT-29 cells were examined using quantitative real-time PCR and flow cytometry, respectively. The levels of interleukin (IL)-1β, IL-18, IL-6, IL-8, and tumor necrosis factor (TNF)-α secreted by HT-29 cells were measured using enzyme-linked immunosorbent assay. Apoptosis of HT-29 cells was measured using a caspase 3/7 assay. We found that Escherichia coli K12 significantly upregulated both PD-L1 mRNA and protein in IFN-γ-sensitized HT-29 cells. E. coli K12 induced the production of IL-8 in HT-29 cells, however, IL-8 did not affect HT-29 PD-L1 expression. Inhibition of the nuclear factor-kappa B pathway significantly reduced E. coli K12-induced PD-L1 expression in HT-29 cells. The other two E. coli strains and two enteric bacterial species did not significantly affect PD-L1 expression in HT-29 cells. Enterococcus faecalis significantly inhibited PD-L1 expression due to induction of cell death. Data from this study suggest that some gut bacterial species have the potential to affect immune function under inflammatory conditions via upregulating epithelial PD-L1 expression.

Keywords: E. coli K12; IFN-γ; PD-L1; inflammation; intestinal epithelial cells.


Figures

FIG 1
FIG 1
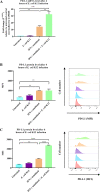
The effects of E. coli K12 on PD-L1 mRNA and protein expression in HT-29 cells. (A) PD-L1 mRNA expression levels in HT-29 cells infected with E. coli K12 for 4 h were measured by qRT-PCR. IFN-γ-sensitized HT-29 cells were used as the positive control and untreated cells were used as the negative control. HT-29 cells that were sensitized with IFN-γ and infected with E. coli K12 had a significantly higher PD-L1 mRNA expression (32.4-fold) than HT-29 cells without IFN-γ sensitization and infected with E. coli K12 (0.96-fold; P < 0.001), the untreated control (1-fold; P < 0.001), and uninfected IFN-γ-sensitized HT-29 cells (14.2-fold; P < 0.01). (B) PD-L1 protein expression levels in HT-29 cells infected with E. coli K12 for 4 h were measured by flow cytometric analysis. Untreated cells were used as the negative control and IFN-γ-treated cells were used as the positive control. The median fluorescence intensity (MFI) values in IFN-γ-sensitized HT-29 cells with and without E. coli K12 infection were 996 ± 110.0 and 984 ± 4.0, respectively, which were not significantly different from each other (P > 0.05). (C) PD-L1 protein expressions in HT-29 cells infected with E. coli K12 for 6 h were measured by flow cytometric analysis. A significantly higher increase in PD-L1 expression was observed in IFN-γ-sensitized HT-29 cells infected with E. coli K12 (2,357 ± 29.0) in comparison to the uninfected IFN-γ-sensitized HT-29 cells (952 ± 36.0) and the untreated controls (367 ± 16.5) (P < 0.0001). Statistical significance was measured by one-way analysis of variance with Dunnett’s test. Graphs are representative of the averages of triplicate experiments ± the standard error of the mean (SEM); **, P < 0.01; ***, P < 0.001; ****, P < 0.0001.
FIG 2
FIG 2
Production of cytokines in HT-29 cells induced by E. coli K12 and the effects of IL-8 on PD-L1 mRNA expression. (A) Concentrations of IL-8 in the cell culture supernatants were measured by ELISA after 4 h of infection with E. coli K12. The level of IL-8 production was significantly higher in IFN-γ-sensitized HT-29 cells infected with E. coli K12 (647.3 ± 4.1 pg/ml) than E. coli K12-infected HT-29 cells without IFN-γ sensitization (465.0 ± 22.5 pg/ml) (P < 0.001). The level of IL-8 production was also significantly higher in IFN-γ-sensitized HT-29 cells infected with E. coli K12 and E. coli K12-infected but nonsensitized HT-29 cells than the untreated cells (49.2 ± 2.3 pg/ml) (P < 0.0001). IFN-γ-sensitized HT-29 cells infected with E. coli K12 also produced a significantly higher level of IL-8 production than IFN-γ-sensitized HT-29 cells without bacterial infection (36.6 ± 1.2 pg/ml) (P < 0.0001). Untreated HT-29 cells and IFN-γ-sensitized HT-29 cells without bacterial infection showed no significant difference between their levels of IL-8 production (P > 0.05). (B) Concentrations of IL-8 in the cell culture supernatants were measured by ELISA after 6 h of infection with E. coli K12. No significant difference was found between E. coli K12-infected HT-29 cells with IFN-γ sensitization (839.0 ± 89.4 pg/ml) and without sensitization (876.1 ± 24.1 pg/ml) (P > 0.05). The level of IL-8 production was also significantly higher in IFN-γ-sensitized HT-29 cells infected with E. coli K12 and E. coli K12-infected but nonsensitized HT-29 cells than untreated cells (93.3 ± 0.1 pg/ml) (P < 0.001). IFN-γ-sensitized HT-29 cells infected with E. coli K12 also produced a significantly higher level of IL-8 production than IFN-γ-sensitized HT-29 cells without bacterial infection (76.3 ± 1.9 pg/ml) (P < 0.001). Untreated HT-29 cells and IFN-γ-sensitized HT-29 cells without bacterial infection showed no significant difference between their levels of IL-8 production (P > 0.05). (C) The effect of IL-8 on PD-L1 mRNA expression in HT-29 cells was examined by qRT-PCR. HT-29 cells were treated with different concentrations of recombinant IL-8 (400 pg/ml, 1, 10, 25, and 50 ng/ml) for 12 h and cells treated with IFN-γ were used as the positive control (50 ng/ml). IL-8 had no significant effect on PD-L1 mRNA level in HT-29 cells. One-way analysis of variance with Dunnett’s test was performed. Graphs are representative of averages of triplicate experiments ± SEM; ***, P < 0.001; ****, P < 0.0001.
FIG 3
FIG 3
The upregulation of PD-L1 expression induced by E. coli K12 in IFN-γ-sensitized HT-29 cells via the NF-κB pathway. (A) The NF-κB pathway inhibitor QNZ was used to investigate whether the PD-L1 upregulation in IFN-γ-sensitized HT-29 cells induced by E. coli K12 was via the NF-κB signaling pathway. Cells were treated with 10 or 20 μM QNZ. The mRNA level of PD-L1 was significantly decreased in IFN-γ-sensitized HT-29 cells infected with E. coli K12 in the presence of QNZ (14.8-fold for 20 μM; 19.7-fold for 10 μM) compared to the cells incubated without QNZ (33.1-fold) (P < 0.0001). (B) The levels of IL-8 productions were measured using the supernatants collected from the NF-κB inhibition assay. The level of IL-8 production was significantly decreased in IFN-γ-sensitized HT-29 cells treated with E. coli K12 in the presence of 10 (252.5 ± 4.0 pg/ml) or 20 μM (19.9 ± 1.1 pg/ml) of QNZ compared to the cells without QNZ (410.3 ± 9.4 pg/ml) (P < 0.0001). One-way analysis of variance (ANOVA) with Dunnett’s test was performed. Graphs are representative of averages of triplicate experiments ± SEM; ****, P < 0.0001.
FIG 4
FIG 4
The effect of heat-inactivated E. coli K12 on PD-L1 mR1NA expression in HT-29 cells. (A) The levels of PD-L1 mRNA expression in HT-29 cells infected with heat-inactivated E. coli K12 for 4 h were measured by qRT-PCR. The level of PD-L1 mRNA expression in IFN-γ-sensitized HT-29 cells infected with heat-inactivated E. coli K12 (12.3-fold) was reduced significantly in comparison to the IFN-γ-sensitized HT-29 cells infected with active E. coli K12 (22.8-fold) (P < 0.01); however, when comparing to the positive control (8.5-fold), the difference was statistically insignificant (P > 0.05). (B) CFU was assessed in order to investigate the growth rate of E. coli K12 at 4 h. The heat-inactivated E. coli did not grow. The CFU of non-heat-inactivated E. coli after 4 h were equivalent to 1.68 × 108 CFU/ml. One-way analysis of variance (ANOVA) with Dunnett’s test was performed. Graphs are representative of averages of triplicate experiments ± SEM (** = P < 0.01; *** = P < 0.001; **** = P < 0.0001 indicates statistical significance).
FIG 5
FIG 5
The effects of other E. coli strains and bacterial species on PD-L1 expression in HT-29 cells. (A) The levels of PD-L1 mRNA expression in HT-29 cells infected with E. coli strains M2326 and L20 for 4 h were measured by qRT-PCR. E. coli strain K12 was also included for the purpose of comparison. IFN-γ-sensitized HT-29 cells were used as the positive control and untreated cells were used as the negative control. The levels of PD-L1 mRNA expression were increased in IFN-γ-sensitized HT-29 cells infected with E. coli strains M2326 (17.8-fold) and L20 (16.5-fold), but their levels were not statistically significant compared to uninfected IFN-γ-sensitized HT-29 cells (14.1-fold) (P > 0.05). (B) The levels of PD-L1 mRNA expressions in HT-29 cells infected with B. vulgatus, C. koseri C20, or E. faecalis for 4 h were measured by qRT-PCR. The level of PD-L1 mRNA expression was increased in IFN-γ-sensitized HT-29 cells infected with C. koseri C20 (17.1-fold), but the level was not statistically significant compared to IFN-γ-sensitized HT-29 cells without bacterial infection (14.1-fold) (P > 0.05). B. vulgatus did not increase PD-L1 expression (14.1-fold). The level of PD-L1 expression was significantly lower in IFN-γ-sensitized HT-29 cells infected with E. faecalis (1.1-fold) than that of the IFN-γ-sensitized HT-29 cells without bacterial infection (14.1-fold) (P < 0.0001). Significance was assessed by one-way analysis of variance (ANOVA) with Dunnett’s test. Graphs are representative of averages of triplicate experiments ± SEM; **, P < 0.01; ****, P < 0.0001.
FIG 6
FIG 6
The effects of other E. coli strains and bacterial species on IL-8 production in HT-29 cells. (A) The concentrations of IL-8 in the cell culture supernatants were measured by ELISA after 4 h of infection with E. coli strains M2326 and L20. E. coli K12 was included for the purpose of comparison. Similar to E. coli strain K12 (597.2 ± 2.5 pg/ml), E. coli strains M2326 (322.2 ± 3.7 pg/ml) and L20 (354.6 ± 16.8 pg/ml) induced a higher IL-8 production in IFN-γ-sensitized HT-29 cells compared to HT-29 cells infected with the same strain without IFN-γ sensitization (428.8 ± 1.8 pg/ml, 235.1 ± 7.0 pg/ml, and 261.5 ± 13.9 pg/ml, respectively) (P < 0.001). (B) The concentrations of IL-8 in the cell culture supernatants were measured by ELISA after 4 h of infection with B. vulgatus, C. koseri C20, and E. faecalis. The levels of IL-8 productions were significantly higher in nonsensitized HT-29 cells infected with B. vulgatus (239.0 ± 7.1 pg/ml) and E. faecalis (80.5 ± 2.0 pg/ml) than those of the IFN-γ-sensitized HT-29 cells infected with B. vulgatus (109.9 ± 2.8 pg/ml; P < 0.0001) and E. faecalis (43.9 ± 0.6 pg/ml; P < 0.01). Nonsensitized HT-29 cells infected with C. koseri C20 (301.1 ± 2.3 pg/ml) also had a higher IL-8 production than IFN-γ-sensitized HT-29 cells infected with C. koseri C20 (287.2 ± 11.7 pg/ml); however, the difference was not statistically significant. Significance was assessed by one-way analysis of variance (ANOVA) with Dunnett’s test. Graphs are representative of averages of triplicate experiments ± SEM; **, P < 0.01; ***, P < 0.001; ****, P < 0.0001.

Similar articles

Cited by

References

    1. Dong H, Chen L. 2003. B7-H1 pathway and its role in the evasion of tumor immunity. J Mol Med (Berl) 81:281–287. doi:10.1007/s00109-003-0430-2. - DOI - PubMed
    1. Dong H, Zhu G, Tamada K, Chen L. 1999. B7-H1, a third member of the B7 family, co-stimulates T-cell proliferation and interleukin-10 secretion. Nat Med 5:1365–1369. doi:10.1038/70932. - DOI - PubMed
    1. Dong H, Strome SE, Salomao DR, Tamura H, Hirano F, Flies DB, Roche PC, Lu J, Zhu G, Tamada K, Lennon VA, Celis E, Chen L. 2002. Tumor-associated B7-H1 promotes T-cell apoptosis: a potential mechanism of immune evasion. Nat Med 8:793–800. doi:10.1038/nm730. - DOI - PubMed
    1. Ishida M, Iwai Y, Tanaka Y, Okazaki T, Freeman GJ, Minato N, Honjo T. 2002. Differential expression of PD-L1 and PD-L2, ligands for an inhibitory receptor PD-1, in the cells of lymphohematopoietic tissues. Immunol Lett 84:57–62. doi:10.1016/s0165-2478(02)00142-6. - DOI - PubMed
    1. Ishida Y, Agata Y, Shibahara K, Honjo T. 1992. Induced expression of PD‐1, a novel member of the immunoglobulin gene superfamily, upon programmed cell death. EMBO J 11:3887–3895. - PMC - PubMed

Publication types

MeSH terms