. 2021 Jan 1;27(1):213-225.
doi: 10.1158/1078-0432.CCR-20-2868. Epub 2020 Oct 12.

A Cyclin D1-Dependent Transcriptional Program Predicts Clinical Outcome in Mantle Cell Lymphoma

Affiliations

A Cyclin D1-Dependent Transcriptional Program Predicts Clinical Outcome in Mantle Cell Lymphoma

Santiago Demajo et al. Clin Cancer Res. .

Abstract

Purpose: Mantle cell lymphoma (MCL) is characterized by the t(11;14)(q13;q32) translocation leading to cyclin D1 overexpression. Cyclin D1 is a major cell-cycle regulator and also regulates transcription, but the impact of cyclin D1-mediated transcriptional dysregulation on MCL pathogenesis remains poorly understood. The aim of this study was to define a cyclin D1-dependent gene expression program and analyze its prognostic value.

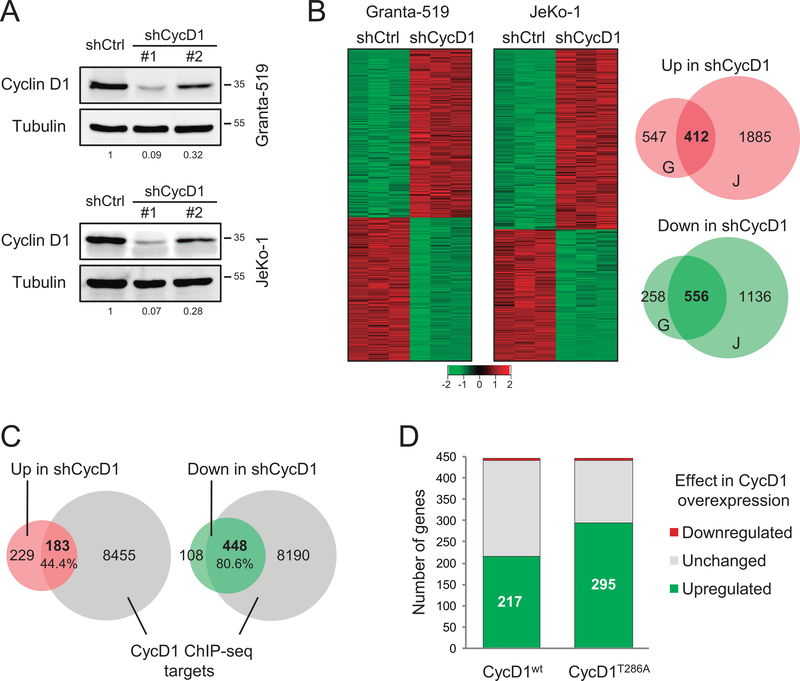
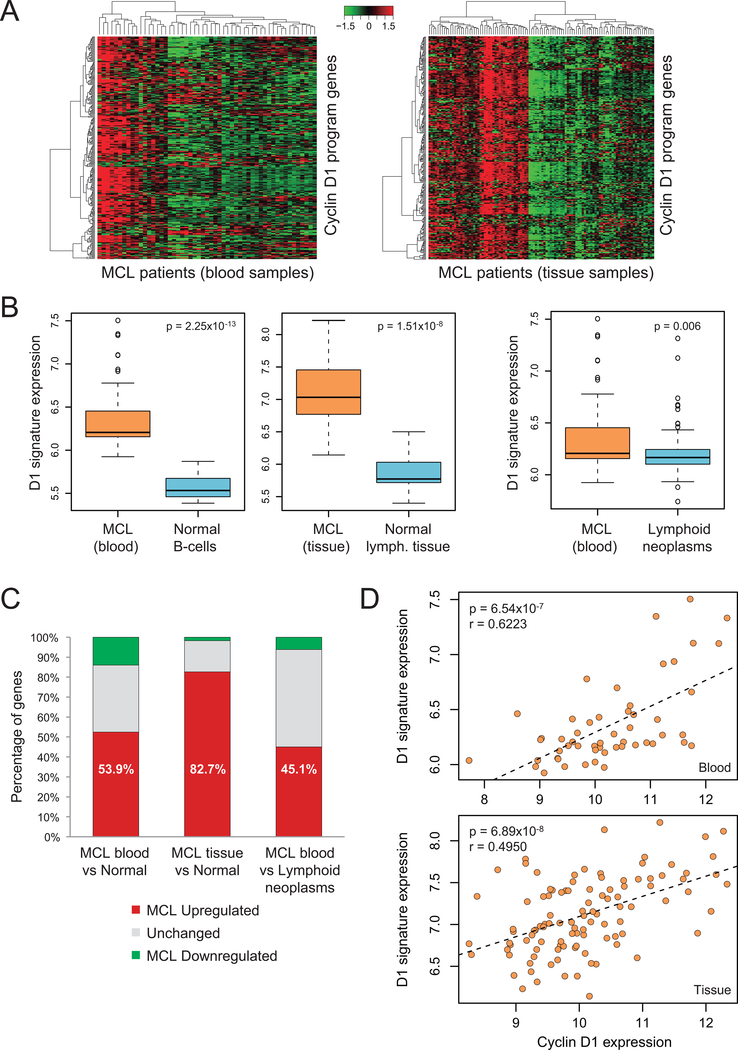
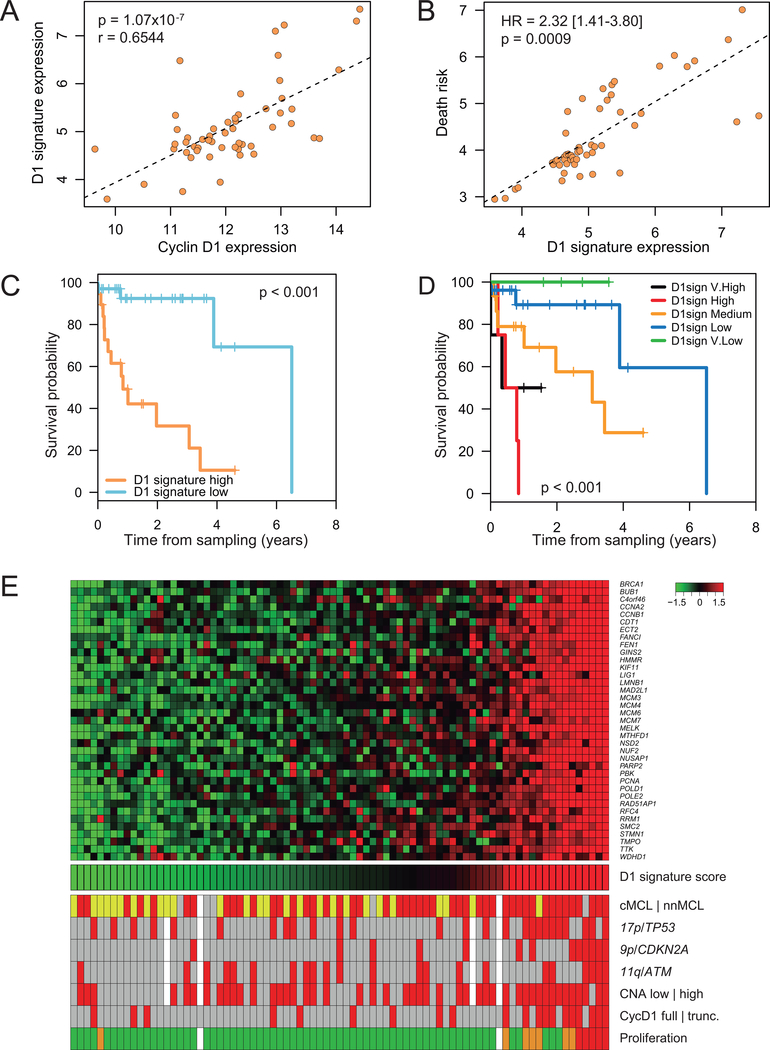
Experimental design: We integrated genome-wide expression analysis of cyclin D1-silenced and overexpressing cells with cyclin D1 chromatin-binding profiles to identify a cyclin D1-dependent transcriptional program in MCL cells. We analyzed this gene program in two MCL series of peripheral blood samples (n = 53) and lymphoid tissues (n = 106) to determine its biological and clinical relevance. We then obtained a simplified signature of this program and evaluated a third series of peripheral blood MCL samples (n = 81) by NanoString gene expression profiling to validate our findings.

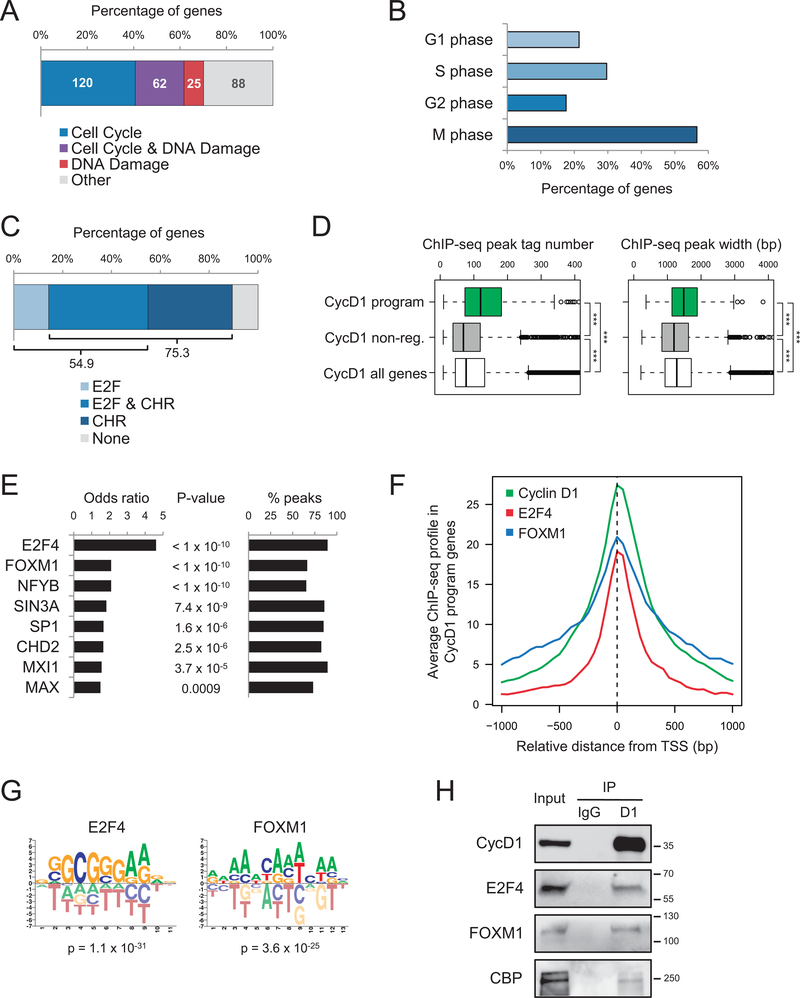
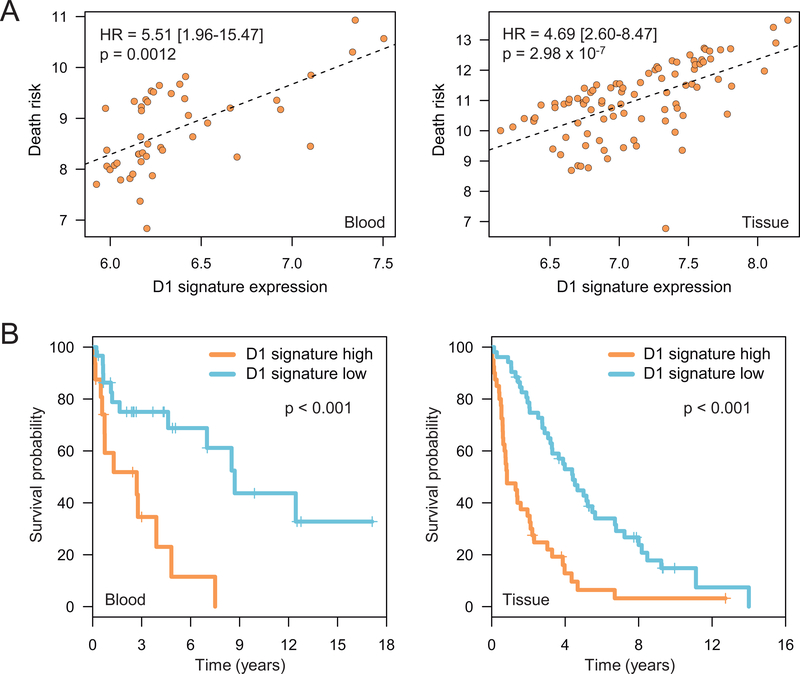
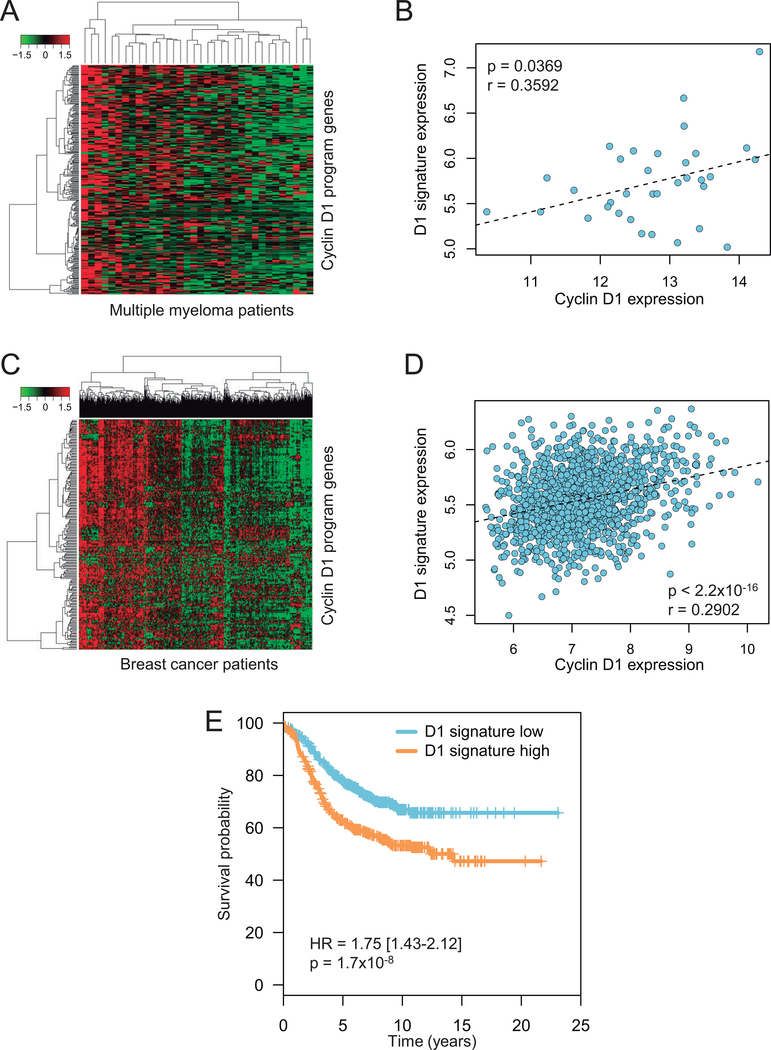
Results: We identified a cyclin D1-dependent transcriptional program composed of 295 genes that were mainly involved in cell-cycle control. The cyclin D1-dependent gene program was overexpressed in MCL tumors directly proportional to cyclin D1 levels. High expression of this program conferred an adverse prognosis with significant shorter overall survival of the patients. These observations were validated in an independent cohort of patients using a simplified 37-gene cyclin D1 signature. The cyclin D1-dependent transcriptional program was also present in multiple myeloma and breast tumors with cyclin D1 overexpression.

Conclusions: We identified a cyclin D1-dependent transcriptional program that is overexpressed in MCL and predicts clinical outcome.


Figures

Figure 1.
Figure 1.. Identification of a cyclin D1-dependent transcriptional program in MCL cells.
(A) Western blot analysis of cyclin D1 in control (shCtrl) and cyclin D1-silenced (shCycD1 #1 and #2) MCL cell lines. Tubulin was used as loading control. Cyclin D1 quantification normalized by tubulin and relative to shCtrl cells is shown. Molecular weights (in kDa) are indicated. (B) RNA-seq experiment in shCtrl and shCycD1 #1 MCL cells. Left, heatmaps showing significantly upregulated (red) and downregulated (green) genes in the three biological replicates. Right, Venn diagrams showing the overlap between differentially expressed genes in Granta-519 (G) and JeKo-1 (J) cells (in bold), which were selected for further analysis. (C) Venn diagrams showing the overlap between either upregulated (red) or downregulated (green) genes in shCycD1 MCL cells and cyclin D1 (CycD1) target genes by ChIP-seq in four MCL cell lines (n = 8,638). Statistical significance was assessed by one-tailed Fisher’s test. (D) Differential expression analysis of the cyclin D1-activated genes identified in MCL cells (n = 448) in CycD1wt or CycD1T286 overexpressing versus control JVM13 cells.
Figure 2.
Figure 2.. Cyclin D1 promotes the activation of a cell cycle transcriptional program.
(A) GO analysis of cyclin D1-dependent gene expression program (n = 295) showing the number and the percentage of genes involved in cell cycle (p = 3.4 × 10−116), DNA damage response (p = 2.4 × 10−47), or both. (B) Percentage of cell cycle genes from the cyclin D1-dependent transcriptional program (n = 182) corresponding to the four cell cycle phases according to GO categories. G1 corresponds to “cell cycle G1/S phase transition” (p = 1.4 × 10⁻²⁶), S to “DNA replication” (p = 1.3 × 10−64), G2 to “cell cycle G2/M phase transition” (p = 5.9 × 10⁻²²), and M to “cell division” (p = 6.7 × 10−61) and “chromosome segregation” (p = 6.4 × 10−56). Genes belonging to more than one category were included in all of them. (C) Analysis of DNA motifs related to cell cycle transcriptional control in the cyclin D1 peaks present in the promoters of cyclin D1-activated genes. Statistical assessment by Fisher’s test in comparison to all gene promoters resulted in p < 2.2 × 10⁻¹⁶ for E2F and p = 0.003 for CHR sites. (D) Boxplots of cyclin D1 ChIP-seq peak tag number and width, corresponding to the cyclin D1-activated genes (n = 295), cyclin D1 non-regulated genes (n = 2,752), and all cyclin D1 target genes (n = 8,638). Statistical significance was assessed by two-tailed Student’s t-test, ***: p < 0.0001. (E) Colocalization analysis between cyclin D1 peaks and transcriptional regulators from the ENCODE database (GM12878 cells) in the cyclin D1-activated genes. Statistical significance was assessed by Fisher’s test in comparison with cyclin D1 non-regulated genes. Percentages of cyclin D1-activated genes containing a peak of the corresponding transcription factor overlapping with the cyclin D1 peak are indicated; only the transcription factors present in more than 50% of genes were selected. (F) ChIP-seq profiles of cyclin D1 (in JeKo-1 cells) and E2F4 and FOXM1 (in GM12878 cells) around the transcription start site (TSS) from the cyclin D1-dependent program genes. (G) Enrichment of E2F4 and FOXM1 motifs in cyclin D1 peaks present in cyclin D1-activated gene promoters. (H) Co-IP experiments of endogenous cyclin D1 with E2F4, FOXM1, and CBP in JeKo-1 cells. IgG was used as a control. Molecular weights (in kDa) are indicated.
Figure 3:
Figure 3:. Cyclin D1-dependent transcriptional program is upregulated in primary MCL.
(A) Heatmap and hierarchical clustering analysis of cyclin D1-dependent gene program in MCL primary cases from both peripheral blood (n = 53, left) and lymphoid tissue (n = 106, right) samples. (B) Boxplots displaying the 295-gene cyclin D1 signature expression score. Left, MCL primary cases from peripheral blood versus normal naïve and memory B-cells (n = 10), and MCL lymphoid tissue samples versus normal lymphoid tissues (n = 11). Right, MCL primary cases from peripheral blood versus leukemic cyclin D1-negative lymphoid neoplasms (n = 101). Statistical significance was assessed by two-tailed Student’s t-test. (C) Differential gene expression analysis of cyclin D1-dependent program genes (n = 295) in MCL primary cases versus either normal samples or other lymphoid neoplasms; percentages of upregulated genes in MCL are indicated. (D) Correlation between cyclin D1 expression and the 295-gene cyclin D1 signature score in MCL primary cases, from both peripheral blood and lymphoid tissue samples. Correlation was assessed by Pearson’s r.
Figure 4:
Figure 4:. Expression levels of cyclin D1-dependent program correlate with survival in MCL patients.
(A) Association between the 295-gene cyclin D1 signature score and the death risk in MCL primary cases, from both peripheral blood and lymphoid tissue samples. The death risk (y-axis) corresponds to the sum of the martingale residuals and the linear predictors of the fitted OS Cox model; hazard ratios (HR) with 95% confidence interval and p-values are shown. (B) Kaplan-Meier curves of OS from diagnosis date corresponding to 295-gene cyclin D1 signature high and low MCL groups, in peripheral blood (high n = 16; low n = 30) and lymphoid tissue (high n = 40; low n = 52) samples.
Figure 5:
Figure 5:. Validation of a simplified cyclin D1-dependent gene expression signature.
(A) Correlation between cyclin D1 expression and the 37-gene cyclin D1 signature score in peripheral blood samples from the MCL validation series (n = 53). Statistical significance was assessed by Pearson’s r. (B) Association between the 37-gene cyclin D1 signature score and the death risk in the validation series. The death risk (y-axis) corresponds to the sum of the martingale residuals and the linear predictors of the fitted OS Cox model; HR with 95% confidence interval and p-value are shown. Survival data were calculated from sampling time. (C-D) Kaplan-Meier curves of the OS from sampling time in the validation series. Patients were divided into two groups based on the 37-gene cyclin D1 signature score distribution, leading to cyclin D1 signature high (n = 19) and low (n = 34) groups (C), or in five groups of increasing signature score (D1sign) by equal width binning: very low ([3–4], n = 4); low ([4–5], n = 26); medium ([5–6], n = 15); high ([6–7], n = 4); very high ([7–8], n = 4) (D). (E) Heatmap of the simplified 37-gene cyclin D1 signature in the full set of primary leukemic MCL analyzed by NanoString (n = 81), ordered by cyclin D1 signature score (top panel). MCL patients are shown in columns. Molecular features are shown at the bottom. Patients were classified in cMCL (red), nnMCL (yellow), and undefined (grey) based on the L-MCL16 gene expression signature. 17p/TP53, 9p/CDKN2A, and 11q/ATM genetic alterations are represented in red. Patients with high number (≥5) of CNA are shown in red. Patients with full length and truncated 3’UTR cyclin D1 RNA are represented in grey and red, respectively. MCL proliferation signature classification in low (green), standard (orange), and high (red) is shown. White: data not available.
Figure 6:
Figure 6:. Cyclin D1-dependent transcriptional program in other cyclin D1-overexpressing tumors.
(A) Heatmap and hierarchical clustering analysis of cyclin D1-dependent gene program in multiple myeloma; only patients from the CD-2 molecular subclass, characterized by a high prevalence of t(11;14) translocation, were selected (n = 34). (B) Correlation between cyclin D1 expression and the 295-gene cyclin D1 signature score in multiple myeloma. Correlation was assessed by Pearson’s r. (C) Heatmap and hierarchical clustering analysis of cyclin D1-dependent gene program in ER-positive breast cancer patients (n = 1399). (D) Correlation between cyclin D1 expression and the 295-gene cyclin D1 signature score in ER-positive breast cancer. Correlation was assessed by Pearson’s r. (E) Kaplan-Meier curves of the progression free survival in ER-positive breast cancer patients splitted in “high” and “low” groups based on the median value of the 37-gene cyclin D1 signature.

References

    1. Jares P, Colomer D, Campo E. Molecular pathogenesis of mantle cell lymphoma. J Clin Invest. 2012;122:3416–23. - PMC - PubMed
    1. Bosch F, Jares P, Campo E, Lopez-Guillermo A, Piris MA, Villamor N, et al. PRAD-1/cyclin D1 gene overexpression in chronic lymphoproliferative disorders: a highly specific marker of mantle cell lymphoma. Blood. 1994;84:2726–32. - PubMed
    1. Seto M, Yamamoto K, Iida S, Akao Y, Utsumi KR, Kubonishi I, et al. Gene rearrangement and overexpression of PRAD1 in lymphoid malignancy with t(11;14)(q13;q32) translocation. Oncogene. 1992;7:1401–6. - PubMed
    1. Scott DW, Abrisqueta P, Wright GW, Slack GW, Mottok A, Villa D, et al. New Molecular Assay for the Proliferation Signature in Mantle Cell Lymphoma Applicable to Formalin-Fixed Paraffin-Embedded Biopsies. J Clin Oncol. 2017;35:1668–77. - PMC - PubMed
    1. Rosenwald A, Wright G, Wiestner A, Chan WC, Connors JM, Campo E, et al. The proliferation gene expression signature is a quantitative integrator of oncogenic events that predicts survival in mantle cell lymphoma. Cancer Cell. 2003;3:185–97. - PubMed

Publication types