. 2020 Oct 12;3(12):e202000853.
doi: 10.26508/lsa.202000853. Print 2020 Dec.

Role of opioid signaling in kidney damage during the development of salt-induced hypertension

Affiliations

Role of opioid signaling in kidney damage during the development of salt-induced hypertension

Daria Golosova et al. Life Sci Alliance. .

Abstract

Opioid use is associated with predictors of poor cardiorenal outcomes. However, little is known about the direct impact of opioids on podocytes and renal function, especially in the context of hypertension and CKD. We hypothesize that stimulation of opioid receptors (ORs) contributes to dysregulation of intracellular calcium ([Ca2+]i) homeostasis in podocytes, thus aggravating the development of renal damage in hypertensive conditions. Herein, freshly isolated glomeruli from Dahl salt-sensitive (SS) rats and human kidneys, as well as immortalized human podocytes, were used to elucidate the contribution of specific ORs to calcium influx. Stimulation of κ-ORs, but not μ-ORs or δ-ORs, evoked a [Ca2+]i transient in podocytes, potentially through the activation of TRPC6 channels. κ-OR agonist BRL52537 was used to assess the long-term effect in SS rats fed a high-salt diet. Hypertensive rats chronically treated with BRL52537 exhibited [Ca2+]i overload in podocytes, nephrinuria, albuminuria, changes in electrolyte balance, and augmented blood pressure. These data demonstrate that the κ-OR/TRPC6 signaling directly influences podocyte calcium handling, provoking the development of kidney injury in the opioid-treated hypertensive cohort.


Conflict of interest statement

The authors declare that they have no conflict of interest.

Figures

Figure 1.
Figure 1.. [Ca2+]i flux in response to application of opioid receptor (OR) agonists in podocytes from freshly isolated rat glomeruli.
(A) Representative image of a glomerulus loaded with ratiometric calcium dyes (Fluo-4/Fura 2TH; merged) before and after the application of specific κ-OR agonist (100 μM, BRL 52537). Scale bar is 50 μm. (B) Response of podocytes to different OR agonists (κ-OR – 100 μM BRL 52537, μ-OR – 100 μM DAMGO, or δ-OR – 50 μM DPDPE). (C) Summary for the peak fluorescence intensity following an application of the OR agonists shown at B (n ≥ 30 podocytes; one-way ANOVA, P < 0.001, Tukey’s post hoc P < 0.05).
Figure 2.
Figure 2.. κ-opioid receptor (OR) activation causes [Ca2+]i mobilization via TRPC6 channels in human immortalized podocytes.
(A) Representative example of specific κ-OR agonist (100 μM, BRL 52537) application in the presence or absence of extracellular calcium (Fluo4 AM fluorescence). Scale bar is 50 μm. Images shown in Fig 2A are taken at 1, 1.5, and 6 min from the start of experiments either in 0 or 2 mM [Ca2+]ex (bottom and top images, respectively). The source data videos are available; 1 min of experiments equals to ∼2 s in the videos. (B) Mean [Ca2+]i transient in human podocytes after κ-OR stimulation in 2 or 0 mM calcium-containing bath solution (top and bottom traces, respectively). (C) Dose–response plot for peak [Ca2+]i increase induced by BRL 52537 (2 mM [Ca2+ ]ex) in human podocyte culture (a number of podocytes analyzed per point on the graph are shown). (D) Representative traces show dose-dependent changes in [Ca2+]i after applications of BRL 52537. (B, E) Peak amplitude of the [Ca2+]i after κ-OR agonist stimulation in experiments shown in (B), or during a preincubation of human podocytes with κ-OR antagonist (norBNI) or TRPC6 inhibitor (100 nM, SAR7334) in 2 mM [Ca2+]ex (n ≥ 38 cells; one-way ANOVA, P < 0.001, Tukey’s post hoc P < 0.05, all pairwise k = 6). Source data are available online for this figure.
Figure 3.
Figure 3.. Assessment of cytosolic calcium response to κ-opioid receptor (OR)/TRPC6 pathway activation in podocytes of the freshly isolated human glomerulus.
(A) Peak amplitude of the [Ca2+]i transient mediated by κ-OR agonist stimulation shown in (B) (n ≥ 33 cells; ANOVA, P < 0.001). (B) [Ca2+]i response in podocytes from freshly isolated human glomeruli exposed to κ-OR agonist (100 μM, BRL 52537) under control or TRPC6 blockade (50 μM, SAR7334 preincubation) conditions.
Figure S1.
Figure S1.. Assessment of κ-opioid receptor (OR) expression in podocytes of the freshly isolated human glomerulus.
(A) Immunolabeling of isolated human glomerulus indicated a co-localization of podocin (green; FITC) and κ-OR (red; TRITC). Scale bars are 20 μm. (B) Representative immunohistochemical staining of κ-OR protein in human kidney at 20× and 40× magnification. Podocytes are marked with arrows. Scale bars are 50 μm.
Figure 4.
Figure 4.. κ-opioid receptor (OR) agonist induces podocyte cell shape changes via the actin cytoskeleton remodeling.
(A) An application of κ-OR agonist to human-cultured podocytes promotes significant shrinkage in the cell surface area (top panel, scale bar is 50 μm). Changes in the mean cell surface area were obtained by comparisons between BRL-treated and control cells (number of cells is indicated in the brackets, ANOVA, P < 0.001; panel below). (B) Following BRL-induced podocyte shrinkage, the actin cytoskeleton pattern shows reinforcement and formation of the actin stress fibers. The reorganization of the F-actin cytoskeleton is indicated by the changes in the rhodamine phalloidin staining pattern through the blue line. Scale bar is 50 μm. (C) Surface topography 3D images obtained by scanning ion-conductance microscopy shows lamellipodia dynamics in human podocytes treated with κ-ORs agonist (changes in z-axis indicated by pseudocolor). (D) Summary of scanning ion-conductance microscope topography indicates normal lamellipodial protrusion under control conditions followed by a strong retraction pattern mediated by κ-OR stimulation (n ≥ 3 cells; ANOVA, P < 0.002, Tukey’s post hoc P < 0.05).
Figure 5.
Figure 5.. Chronic treatment with κ-opioid receptor (OR) agonist aggravates salt-induced hypertension and podocyte damage in Dahl salt-sensitive (SS) rats.
(A) Schematic representation of the experimental protocol. (B) The development of mean arterial pressure in SS rats after changing the diet from a normal salt (NS, 0.4%; day 0) to a HS (8% NaCl) and chronic treatment with κ-OR agonist or vehicle (n ≥ 5 rat per group; ANOVA, P < 0.05). (C) Urinary albumin (Alb/Cre, 24 h collection) changes for the experiments shown in (B). (D) Basal calcium levels in podocytes of freshly isolated glomeruli from hypertensive SS rats chronically exposed to κ-OR agonist or vehicle (n ≥ 13 cells; ANOVA, P < 0.003). (E) Western blot analysis of nephrin in the urine samples (24-h collection) from hypertensive (2 wk on HS) and BRL-treated rats (n = 5 rats per group; ANOVA, P < 0.005).
Figure S2.
Figure S2.. Qualitative and statistical comparisons of glomerular injury in hypertensive rats chronically treated with κ-OR agonist.
(A) Representative section of Masson’s trichrome–stained kidney from hypertensive rats treated with vehicle or BRL. Scale bar is 150 μm. (B) Glomerular injury score (0–4; 0 is no damage) assessed by semi-quantitative morphometric analysis. Note the number of glomeruli count for each score on the y-axes. (C) Cumulative probability distributions of the obtained glomerular scores. The plot indicates the probability of a glomerulus having a score within the selected range. A trend towards increased glomerular damage is noted in the opioid-treated group.
Figure S3.
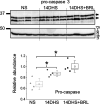
Figure S3.. Expression of pro-caspase-3.
Western blot analysis was conducted to determine pro-caspase-3 cleavage (n = 4 rats per group; ANOVA, P < 0.003, Tukey’s post hoc P < 0.05). Measurements were performed in the kidney cortex in normotensive (NS), hypertensive (14DHS), and hypertensive opioid-treated (14DHS+BRL) groups.
Figure 6.
Figure 6.. Increased TRPC6 expression leads to exacerbated podocyte apoptosis in response to κ-OR stimulation in hypertension.
(A) Western blot analyses of the TRPC6 expression in the kidney cortex of normotensive (NS), hypertensive (14DHS), and hypertensive treated with BRL (14DHS+BRL) groups. (B) Summary graph of TRPC6 expression as shown in A (n = 4 rats per group, ANOVA, P < 0.03, Tukey’s post hoc P < 0.05). (C) Mean [Ca2+]i transient in podocytes of glomeruli freshly isolated from salt-sensitive rats fed normal salt (NS) or after 2 wk on HS (14DHS). Note the sustained [Ca2+]i response to acute stimulation of κ-ORs in hypertensive animals.
Figure S4.
Figure S4.. Quantitative real-time PCR analysis of mRNA expression levels of TRPC6.
Measurements were performed in the kidney cortex in normotensive (NS), hypertensive (14DHS), and hypertensive opioid-treated (14DHS+BRL) groups.
Figure 7.
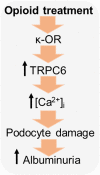
Figure 7.. Schematic demonstrating the contribution of the κ-OR/TRPC6 pathway to the pathological elevation in [Ca2+]i, and consecutive podocyte foot processes retraction, apoptosis, and progression of renal damage in hypertension during opioid treatment.

Similar articles

Cited by

References

    1. Abramowitz J, Birnbaumer L (2009) Physiology and pathophysiology of canonical transient receptor potential channels. FASEB J 23: 297–328. 10.1096/fj.08-119495 - DOI - PMC - PubMed
    1. Agodoa LY, Francis ME, Eggers PW (2008) Association of analgesic use with prevalence of albuminuria and reduced GFR in US adults. Am J Kidney Dis 51: 573–583. 10.1053/j.ajkd.2007.12.014 - DOI - PubMed
    1. Anderson M, Roshanravan H, Khine J, Dryer SE (2014) Angiotensin II activation of TRPC6 channels in rat podocytes requires generation of reactive oxygen species. J Cell Physiol 229: 434–442. 10.1002/jcp.24461 - DOI - PubMed
    1. Ashton N, Balment RJ, Blackburn TP (1990) Kappa-opioid-receptor agonists modulate the renal excretion of water and electrolytes in anaesthetized rats. Br J Pharmacol 99: 181–185. 10.1111/j.1476-5381.1990.tb14674.x - DOI - PMC - PubMed
    1. Barbosa-Leiker C, McPherson S, Daratha K, Alicic R, Short R, Dieter B, Chaytor N, Roll J, Tuttle KR (2016) Association between prescription opioid use and biomarkers of kidney disease in US adults. Kidney Blood Press Res 41: 365–373. 10.1159/000443436 - DOI - PubMed

Publication types

MeSH terms