. 2020 Nov 4;40(45):8604-8617.
doi: 10.1523/JNEUROSCI.0716-20.2020. Epub 2020 Oct 12.

β-Adrenergic Receptors/Epac Signaling Increases the Size of the Readily Releasable Pool of Synaptic Vesicles Required for Parallel Fiber LTP

Affiliations

β-Adrenergic Receptors/Epac Signaling Increases the Size of the Readily Releasable Pool of Synaptic Vesicles Required for Parallel Fiber LTP

Ricardo Martín et al. J Neurosci. .

Abstract

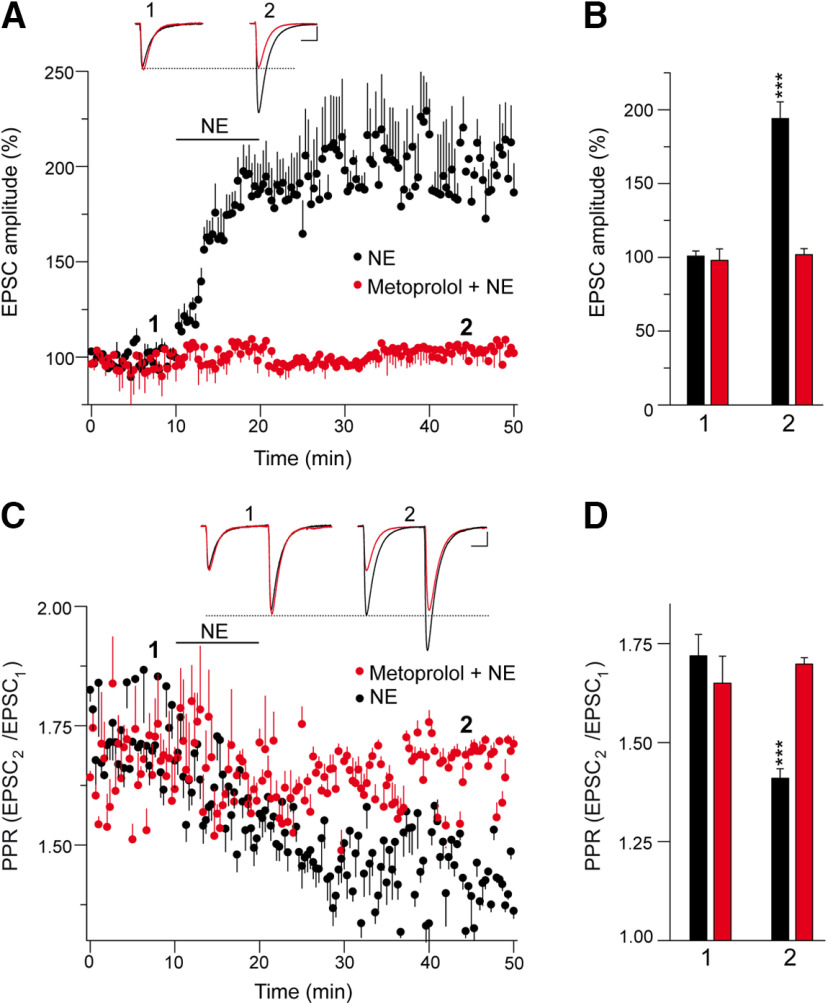
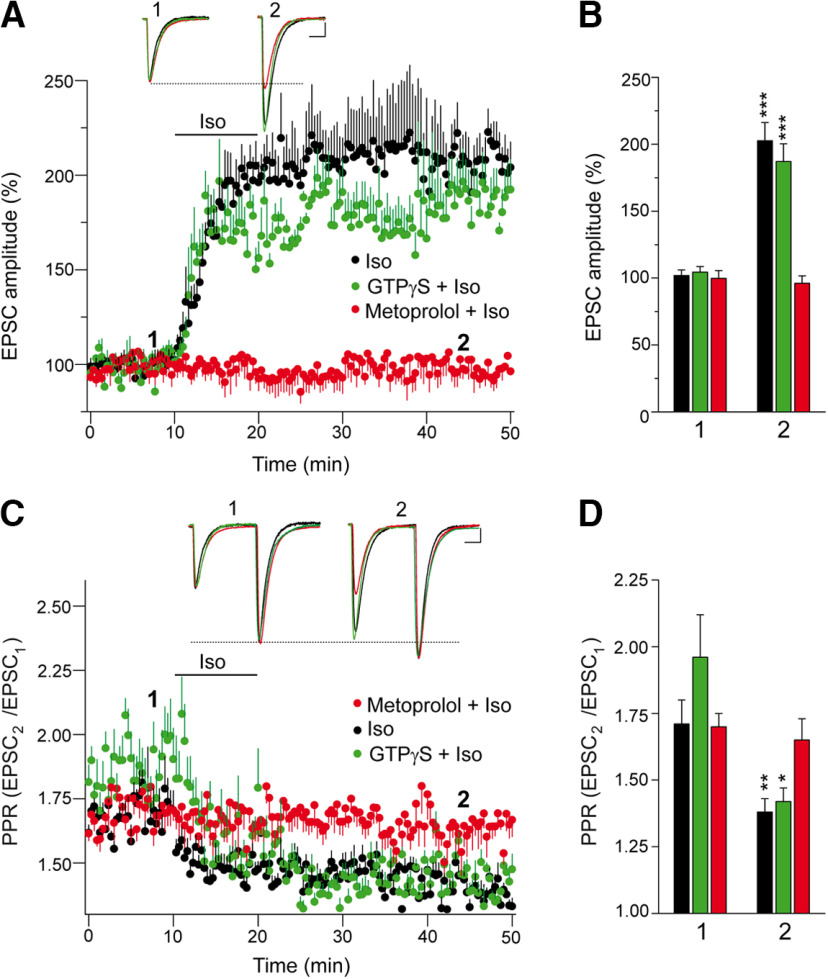
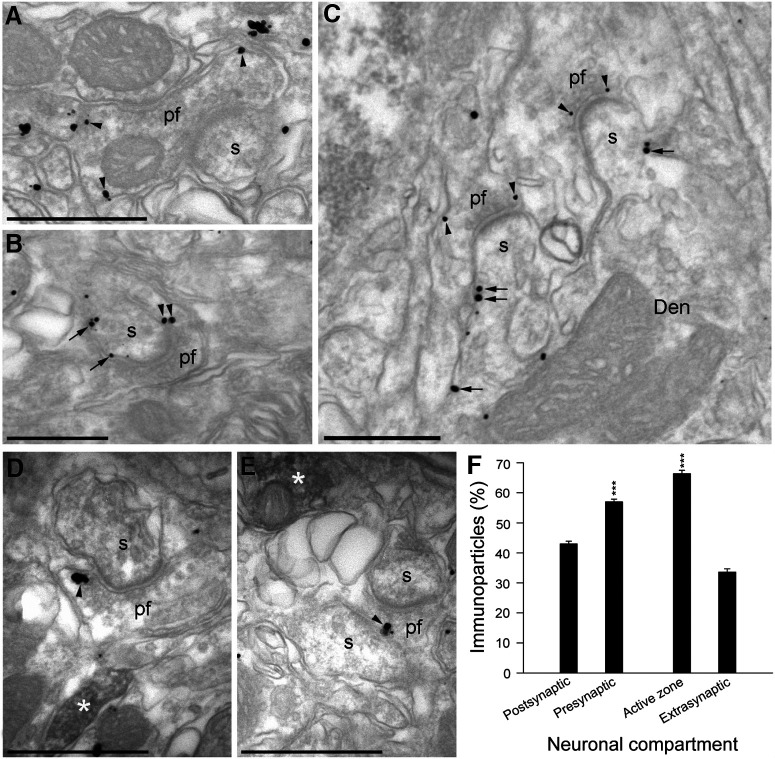
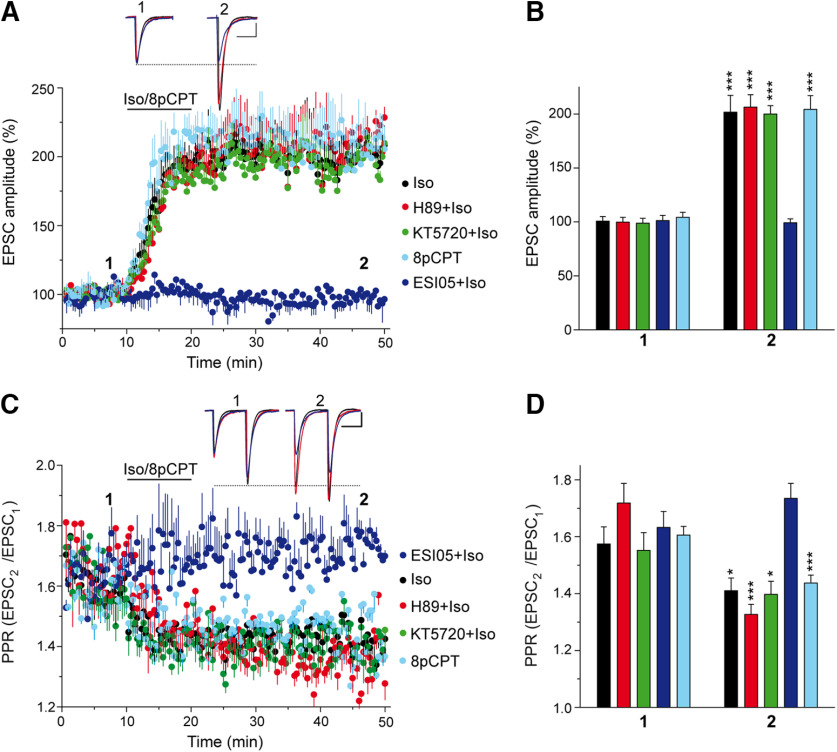
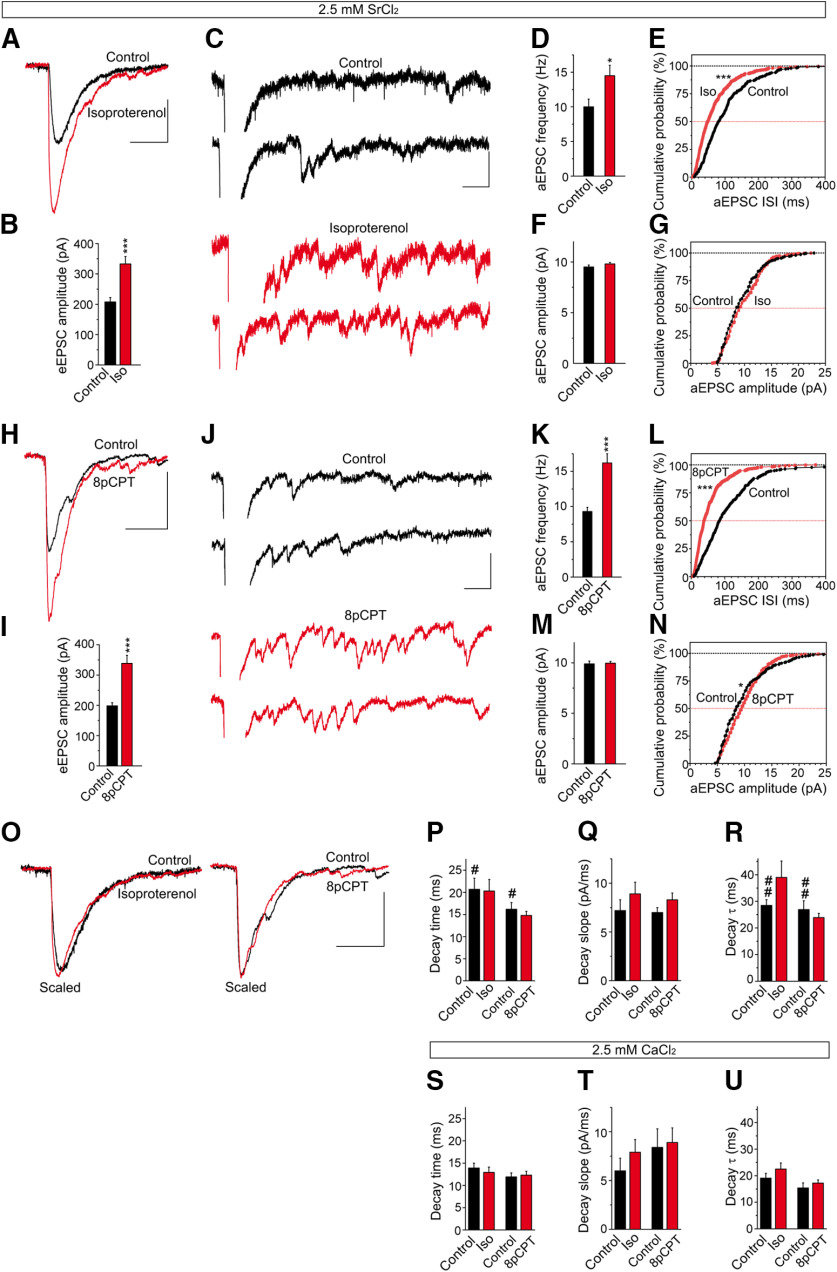
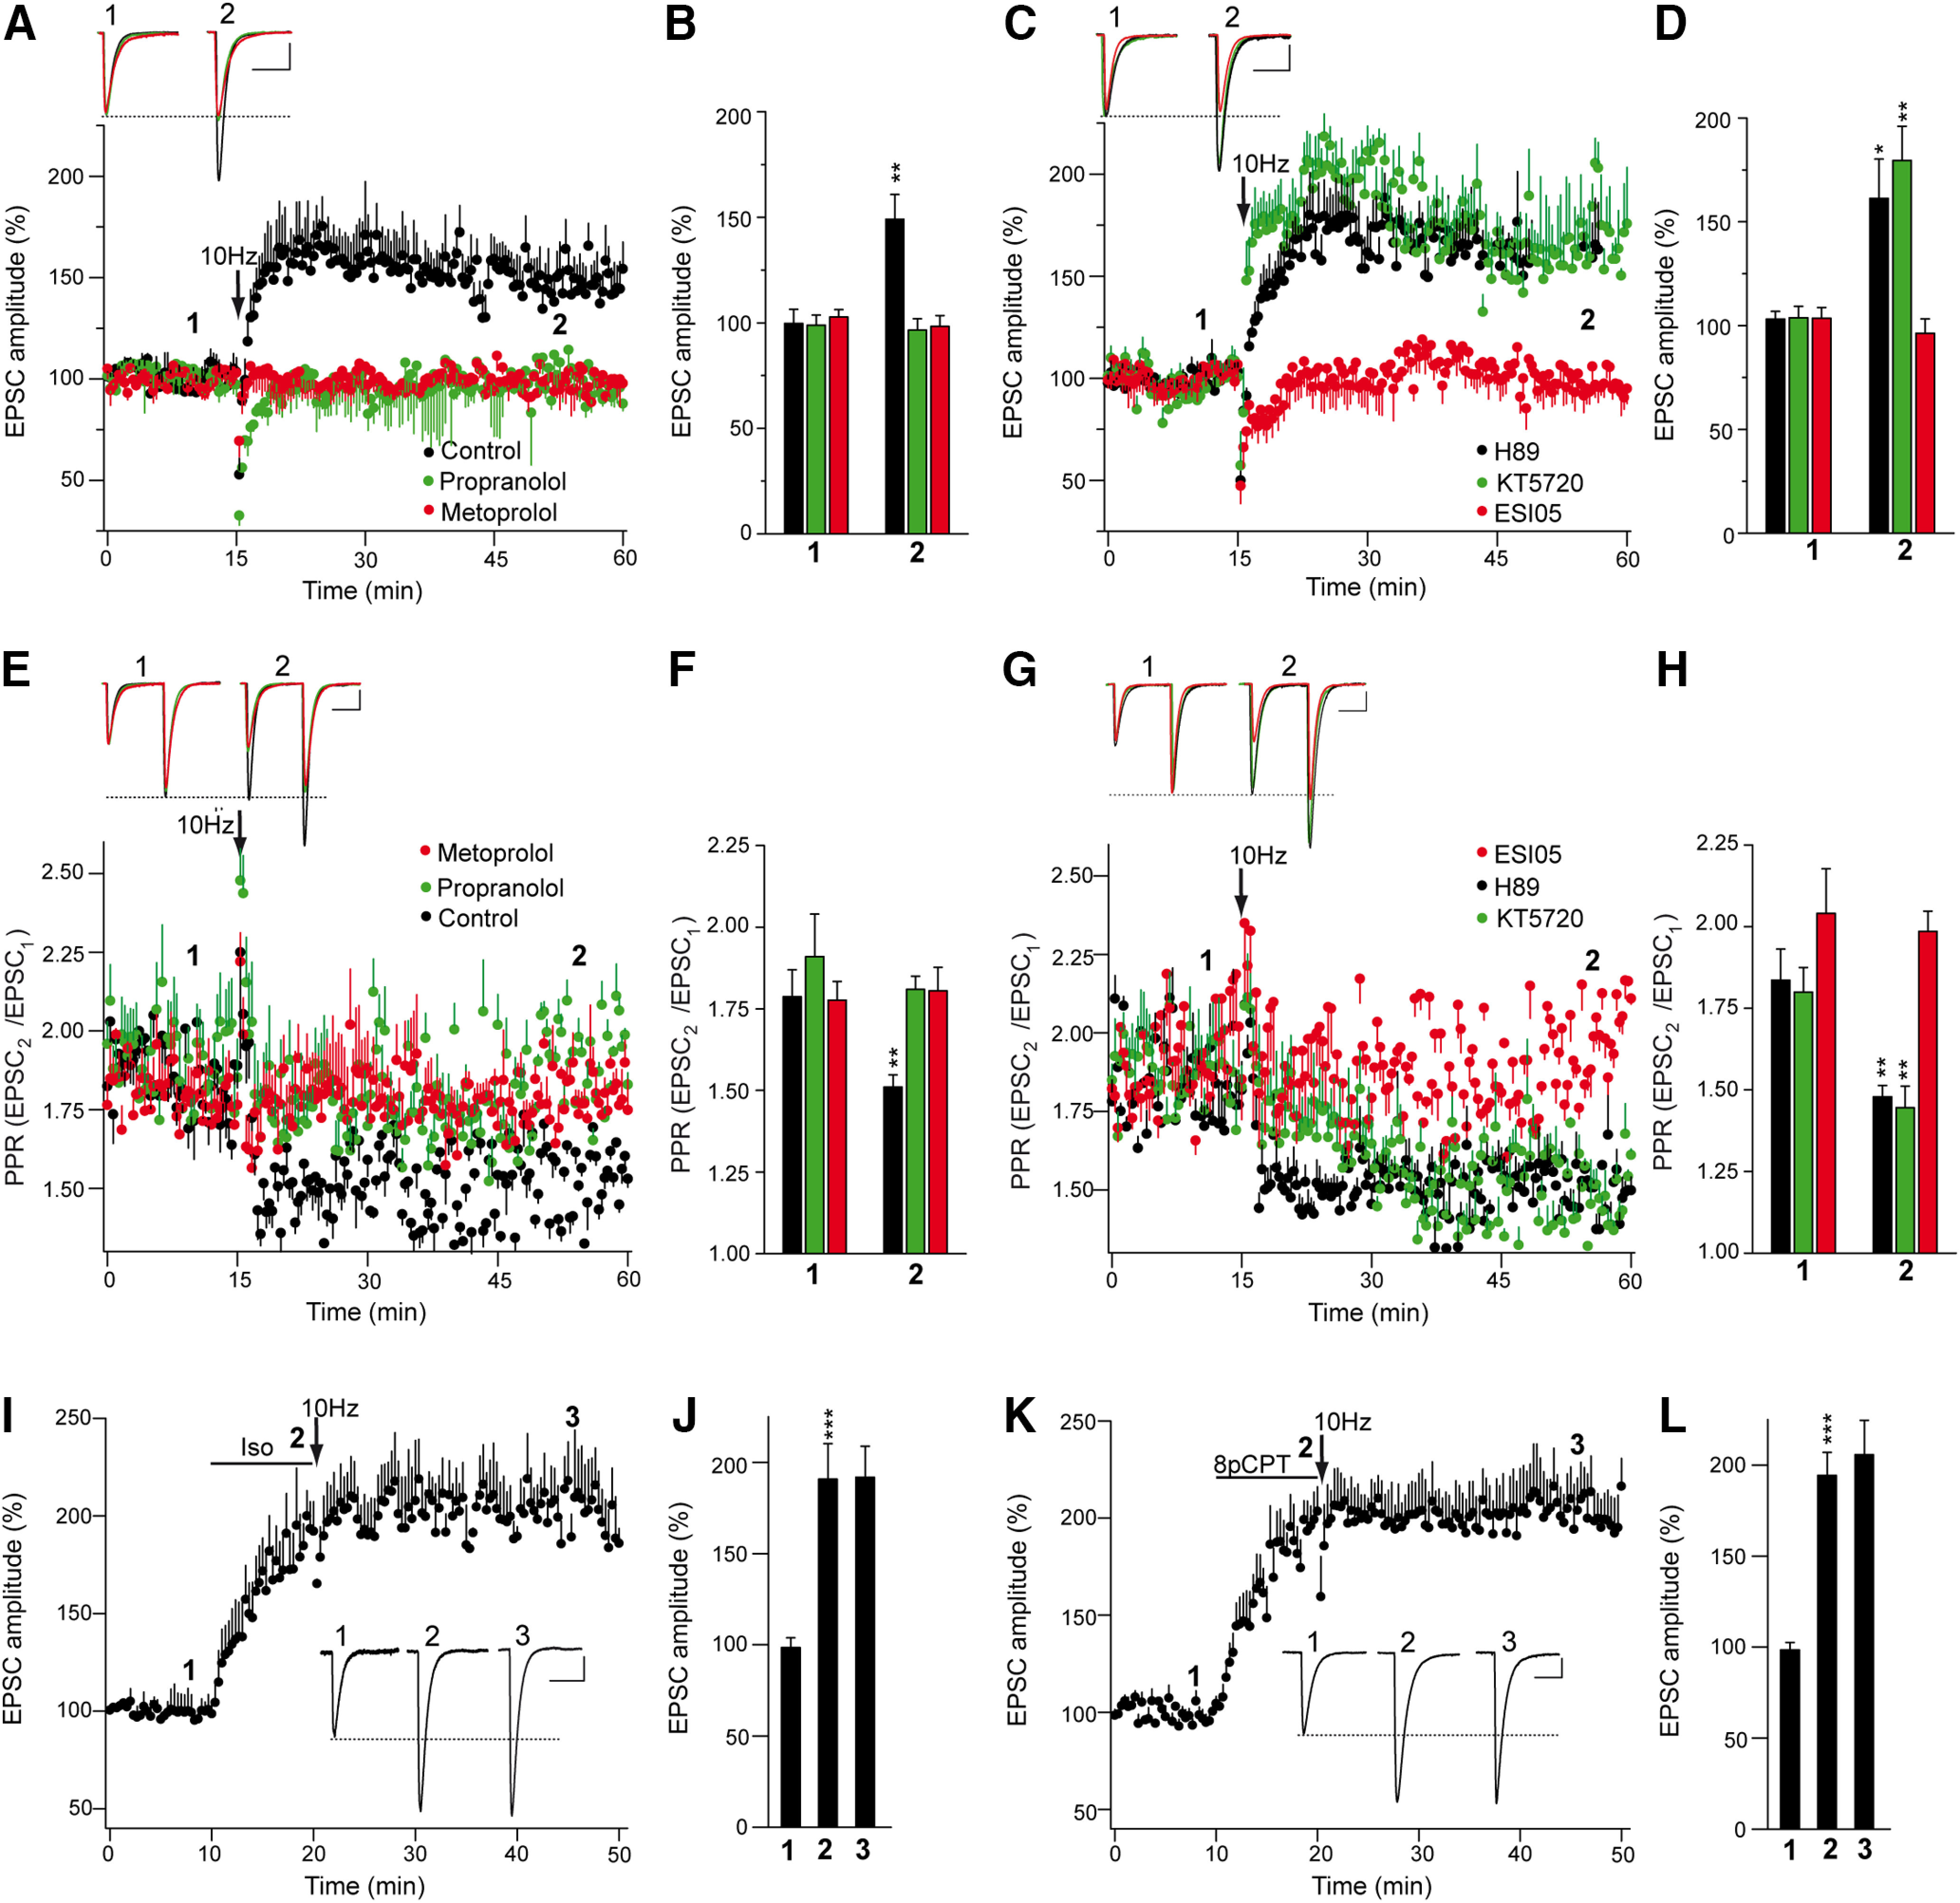
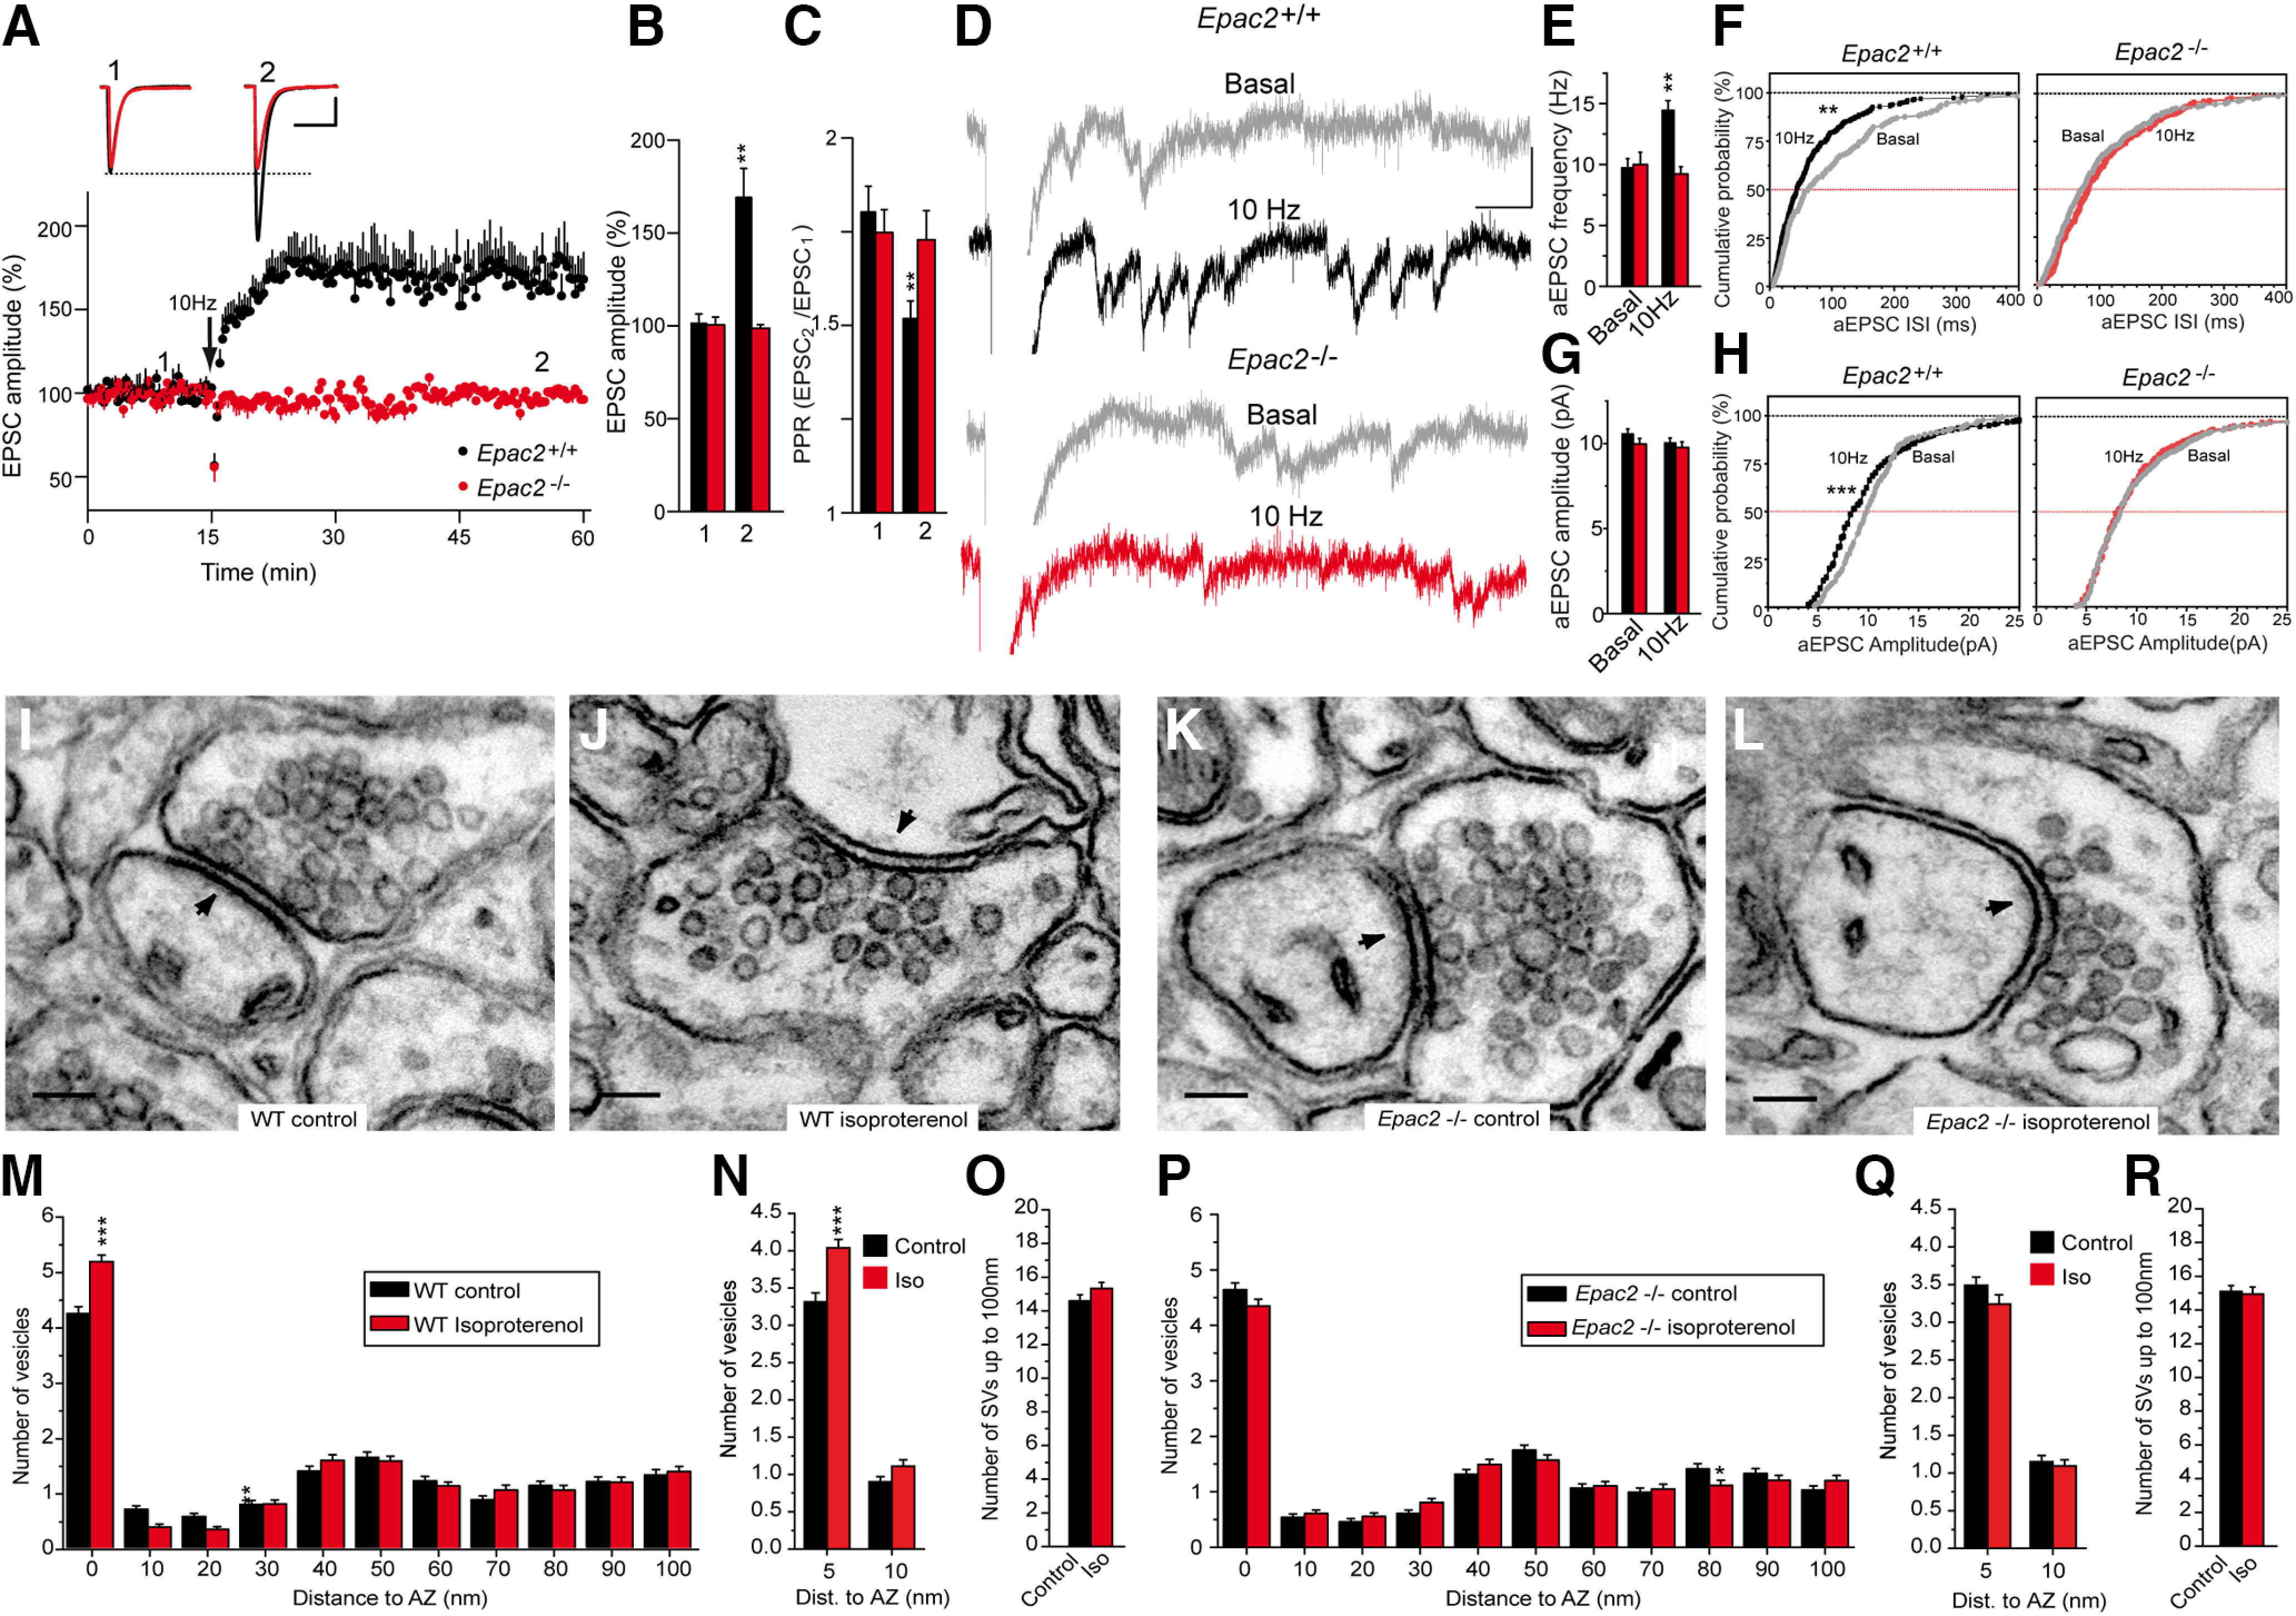
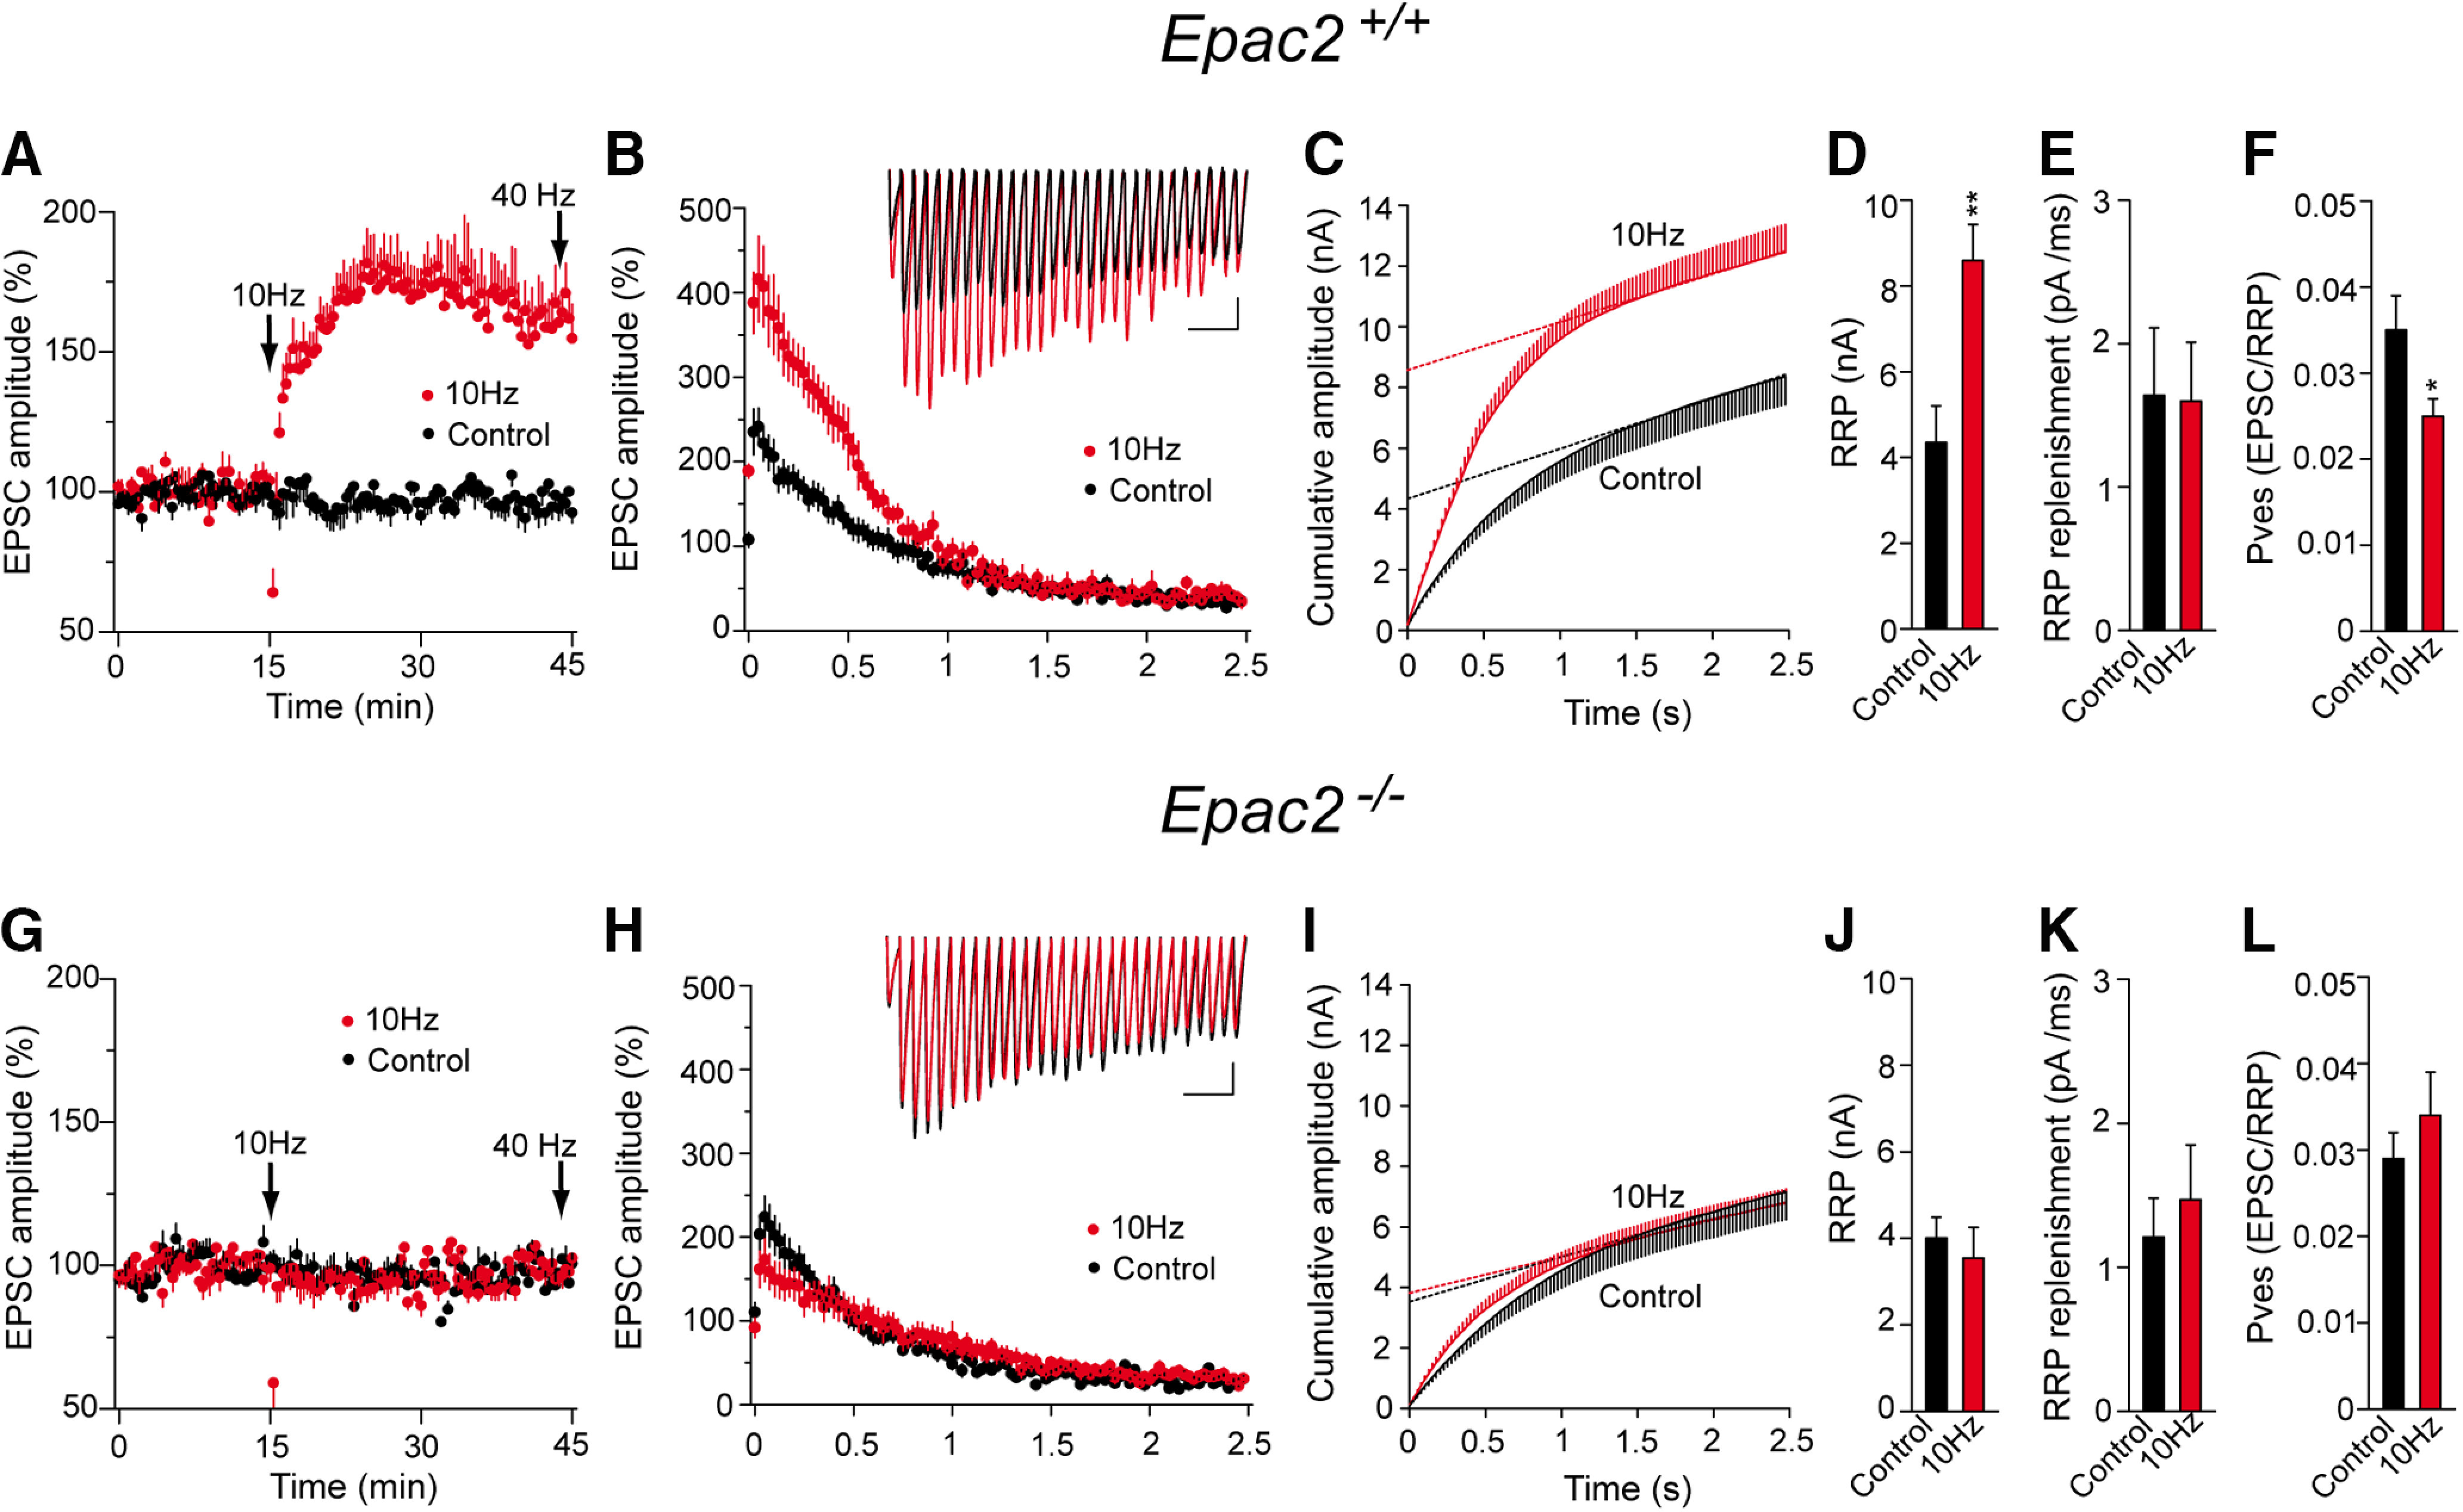
The second messenger cAMP is an important determinant of synaptic plasticity that is associated with enhanced neurotransmitter release. Long-term potentiation (LTP) at parallel fiber (PF)-Purkinje cell (PC) synapses depends on a Ca2+-induced increase in presynaptic cAMP that is mediated by Ca2+-sensitive adenylyl cyclases. However, the upstream signaling and the downstream targets of cAMP involved in these events remain poorly understood. It is unclear whether cAMP generated by β-adrenergic receptors (βARs) is required for PF-PC LTP, although noradrenergic varicosities are apposed in PF-PC contacts. Guanine nucleotide exchange proteins directly activated by cAMP [Epac proteins (Epac 1-2)] are alternative cAMP targets to protein kinase A (PKA) and Epac2 is abundant in the cerebellum. However, whether Epac proteins participate in PF-PC LTP is not known. Immunoelectron microscopy demonstrated that βARs are expressed in PF boutons. Moreover, activation of these receptors through their agonist isoproterenol potentiated synaptic transmission in cerebellar slices from mice of either sex, an effect that was insensitive to the PKA inhibitors (H-89, KT270) but that was blocked by the Epac inhibitor ESI 05. Interestingly, prior activation of these βARs occluded PF-PC LTP, while the β1AR antagonist metoprolol blocked PF-PC LTP, which was also absent in Epac2-/- mice. PF-PC LTP is associated with an increase in the size of the readily releasable pool (RRP) of synaptic vesicles, consistent with the isoproterenol-induced increase in vesicle docking in cerebellar slices. Thus, the βAR-mediated modulation of the release machinery and the subsequent increase in the size of the RRP contributes to PF-PC LTP.SIGNIFICANCE STATEMENT G-protein-coupled receptors modulate the release machinery, causing long-lasting changes in synaptic transmission that influence synaptic plasticity. Nevertheless, the mechanisms underlying synaptic responses to β-adrenergic receptor (βAR) activation remain poorly understood. An increase in the number of synaptic vesicles primed for exocytosis accounts for the potentiation of neurotransmitter release driven by βARs. This effect is not mediated by the canonical protein kinase A pathway but rather, through direct activation of the guanine nucleotide exchange protein Epac by cAMP. Interestingly, this βAR signaling via Epac is involved in long term potentiation at cerebellar granule cell-to-Purkinje cell synapses. Thus, the pharmacological activation of βARs modulates synaptic plasticity and opens therapeutic opportunities to control this phenomenon.

Keywords: Epac2 KO; RRP size; adrenergic receptors; neurotransmitter release; parallel fiber LTP; release machinery.


Figures

Figure 1.
Figure 1.
Norepinephrine potentiates synaptic transmission at PF–PC synapses. EPSCs were recorded from Purkinje cells after 0.05 Hz parallel fiber stimulation. A, Norepinephrine (10 min, 100 μm) induced a sustained increase in the EPSC amplitude that was sensitive to the β1AR antagonist metoprolol (60 μm, 30 min). B, Quantification of the changes in EPSC amplitude. The data were measured 40 min after norepinephrine application (2) in the absence (n = 10 cells/10 slices/5 mice, t = 7.963, df = 10) or the presence of metoprolol (n = 4 cells/4 slices/2 mice, t = 0.4585, df = 6) compared with the values before norepinephrine application (1). C, Changes in the PPR (EPSC2/EPSC1) induced by norepinephrine in the different conditions, quantified 40 min after treatment and relative to the respective basal values. D, Quantification of the changes in the PPR induced by norepinephrine (2) in the absence (t = 7.757, df = 11) or presence of metoprolol (t = 0.6868, df = 3). EPSC sample traces (A, C) represent the mean of six consecutive EPSCs at 0.05 Hz taken before (1) and 40 min after (2) treatment. Calibration: 50 pA and 15 ms. These data represent the mean ± SEM.
Figure 2.
Figure 2.
Isoproterenol potentiates synaptic transmission at PF–PC synapses by a presynaptic mechanism involving β1-adrenergic receptors. EPSCs were recorded from Purkinje cells after 0.05 Hz parallel fiber stimulation. A, The βAR agonist isoproterenol (100 μm, 10 min) induced a sustained increase in the EPSC amplitude that was sensitive to the specific β1AR antagonist metoprolol (60 μm, 30 min), yet was insensitive to the presence of GTPγS (1 mm, 15 min) in the recording pipette. B, Quantification of the changes in EPSC amplitude induced by isoproterenol. The data were measured 40 min after isoproterenol application (2) in the absence (n = 13 cells/13 slices, 6 mice, t = 7.075, df = 14) or the presence (n = 11 cells/11 slices/5 mice, t = 0.4426, df = 20) of metoprolol or GTP-γ-S (n = 11 cells/11slices/5 mice, t = 5.983, df = 11), and relative to the values before isoproterenol application (1). C, Changes in the PPR (EPSC2/EPSC1) induced by isoproterenol in the different conditions. D, Quantification of the changes in the PPR induced by isoproterenol (2) in the absence (t = 3.205, df = 18) and presence (t = 0.53, df = 20) of GTPγS (t = 3.221, df = 11) or metoprolol, and relative to the respective basal values (1). EPSC sample traces (A, C) represent the mean of six consecutive EPSCs at 0.05 Hz taken before and 40 min after treatment. Calibration: 50 pA and 15 ms. The data represent the mean ± SEM.
Figure 3.
Figure 3.
Subcellular localization of the β1-adrenergic receptors in the presynaptic compartments of the cerebellum. A–C, Electron micrographs of the molecular layer of the cerebellum showing pre-embedding Immunogold staining for β1AR. Immunoparticles for β1AR were observed along the plasma membrane (arrowheads) of parallel fiber terminals (pf) establishing excitatory synapses with dendritic spines (s) of PCs. Less frequently, immunoparticles for β1AR were also observed at postsynaptic sites along the plasma membrane (arrows) of dendritic spines (s) and the shafts (Den) of PCs. D, E, Electron micrographs of the molecular layer of the cerebellum showing β1AR immunoparticles and the immunoperoxidase reaction for TH detected using a dual-labeling pre-embedding method. β1AR immunoparticles were observed along the plasma membrane (arrowheads) of pf terminals, always close to fibers immunopositive for TH (filled with the peroxidase reaction end product, white asterisks). F, Quantitative analysis showing the percentage of β1AR immunoparticles in the molecular layer of the cerebellum. Immunoparticles (502) for β1ARs were more frequently observed in presynaptic compartments (57.0 ± 0.9%) and within axon terminals than in the postsynaptic compartments (43.0 ± 0.9%, t = 10.999, df = 4). Moreover, they were more frequently found in the active zone (66.4 ± 1.1%, t = 21.085, df = 4) than at extrasynaptic sites (33.6 ± 1.1%). Scale bars: A, D, E, 500 nm; B, C, 200 nm. The data represent the mean ± SEM.
Figure 4.
Figure 4.
Isoproterenol potentiation of synaptic transmission at PF–PC synapses involves Epac but not PKA-dependent signaling. A, The βAR agonist isoproterenol (100 μm, 10 min) induced a sustained increase in the EPSC amplitude that was insensitive to the PKA inhibitors H-89 (10 μm, 30 min) and KT-5720 (2 μm, 30 min). However, this response was absent in the presence of the Epac2 inhibitor ESI 05 (10 μm, 30 min), and it was mimicked by the Epac activator 8pCPT (50 μm, 10 min). B, Quantification of the changes in EPSC amplitude measured 40 min after isoproterenol/8pCPT application (2). Isoproterenol in the absence (n = 11 cells/11 slices, 5 mice, t = 6.344, df = 11) or in the presence of H-89 (n = 11 cells/11 slices/5 mice, t = 4.496, df = 11), KT-5720 (n = 11 cells/11slices/5 mice, t = 5.945, df = 11), or ESI 05 (n = 10 cells/10 slices/4 mice, t = 0.3760, df = 11), or 8pCPT alone (n = 12 cells/12 slices/5 mice, t = 4.850 df = 13). All the data were compared with the respective values before isoproterenol or 8pCPT application (1). C, Changes in the PPR (EPSC2/EPSC1) induced by isoproterenol or 8pCPT in the different conditions. D, Quantification of the changes in the PPR induced by 8pCPT (t = 4.230, df = 21) and isoproterenol (2) in the absence (t = 2.219, df = 20) or presence of H-89 (t = 4.941, df = 18), KT-5720 (t = 2.133, df = 8) or ESI 05 (t = 1.28, df = 18), and relative to the respective basal values (1). EPSC sample traces (A, C) represent the mean of six consecutive EPSCs at 0.05 Hz taken before and 40 min after treatment. Calibration: 50 pA and 15 ms. The data represent the mean ± SEM.
Figure 5.
Figure 5.
Isoproterenol and 8pCPT enhance the frequency but not the amplitude of the asynchronous release events. A, H, The effects of isoproterenol (100 μm, 10 min) and 8pCPT (50 μm, 10 min) on eEPSCs recorded in the presence of Sr2+ (2.5 mm). C, J, Individual traces showing asynchronous release events in control conditions (black) and after isoproterenol (C, red) or 8pCPT treatment (J, red). B, I, Quantification of the effects of isoproterenol (n = 10 cells/10 slices/8 mice, t = 4.416, df = 14) and 8pCPT (n = 10 cells/10 slices/8 mice, t = 5.128. df = 12) on eEPSC amplitude. D–G, K–N, Quantification of the changes in aEPSC frequency and amplitude induced by isoproterenol (D–G) and 8pCPT (K–N). The aEPSC frequency was enhanced by isoproterenol (D, E: n = 10 cells/10 slices/8 mice, t = 2.419, df = 18) and 8pCPT (K, L: n = 10 cells/10 slices/7 mice, t = 5.073, df = 12), without changing the aEPSC amplitude in isoproterenol (F, G: n = 10 cells/10 slices/7 mice, t = 1.180, df = 734) and 8pCPT (M, N: n = 10 cells/10 slices/7 mice, t = 0.2137, df = 484). Calibration: A, H, 100 pA and 50 ms; C, J, 25 pA and 50 ms. O, Effects of isoproterenol and 8pCPT on eEPSC kinetics in the presence of Sr2+ analyzed in scaled representations. P, The decay time (ms) was not altered by isoproterenol (t = 0.1109, df = 18) or by 8pCPT (t = 0.8003, df = 18). Q, The decay slope pA/ms was not modified by isoproterenol (t = 1.033, df = 18) or by 8pCPT (t = 1.51, df = 18). R, The decay tau (ms) was not changed by isoproterenol (t = 1.628, df = 11) or by 8pCPT (t = 0.818, df = 13). S–U, Effect of isoproterenol and 8pCPT on eEPSC kinetics in the presence of Ca2+. S, The decay time was not altered by isoproterenol (t = 0.6143, df = 24) or by 8pCPT (t = 0.3143 df = 22). T, The decay slope (pA/ms) was not changed by isoproterenol (t = 1.033, df = 24) or by 8pCPT (t = 0.2965, df = 22). U, The decay tau (ms) was not modified by isoproterenol (t = 1.164, df = 24) or by 8pCPT (t = 0.4317, df = 22). Replacing Ca2+ with Sr2+ increased the control decay time (t = 2.267, df = 12) and control decay tau (t = 3.409, df = 21). Calibration: O, 100 pA and 50 ms. The data represent the mean ± SEM.
Figure 6.
Figure 6.
βAR and Epac activation is required for PF–PC LTP. A, C, A 10 Hz 10 s stimulation induced a sustained increase in EPSC amplitude in control and in KT-5720-treated (2 μm, 30 min prior 10 Hz stimulation) or H-89-treated (10 μm, 30 min) slices. Similar increases were absent in slices treated with the Epac inhibitor ESI 05 (10 μm, 30 min) or with the βAR antagonists propranolol (100 μm, 30 min) or metoprolol (60 μm, 30 min). B, D, Quantification of the changes in EPSC amplitude measured 40 min after stimulation (2) in control slices (n = 16 cells/16 slices/14 mice, t = 3.671, df = 23), propranolol-treated slices (n = 12 cells/12 slices/8 mice, t = 0.3322, df = 22), metoprolol-treated slices (n = 10 cells/10 slices/5 mice, t = 0.7113, df = 18), H-89-treated slices (n = 13 cells/13 slices/6 mice, t = 2.999, df = 12), KT-5720-treated slices (n = 10 cells/10 slices/7 mice, t = 4352, df = 10), and ESI 05-treated slices (n = 11 cells/11 slices/9 mice, t = 0.8508, df = 20) relative to the respective values before stimulation (1). E, G, Changes in the PPR (EPSC2/EPSC1) induced by 10 Hz stimulation in the conditions shown in A and C, respectively. F, H, Quantification of the changes in PPR 40 min after a 10 Hz stimulation in control [t = 3.13, df = 22 compared with (1)], and in the presence of propranolol [t = 0.7352, df = 13 compared with (1)], metoprolol [t = 0.2169, df = 18 compared with (1)], H-89 [t = 3448, df = 14 compared with (1)], KT-5720 [t = 3.387, df = 18, compared with (1)], or ESI 05 [t = 3.3283, df= 11, compared with (1)]. EPSC sample traces (A, C, E, G) represent the mean of six consecutive EPSCs at 0.05 Hz taken before and 40 min after 10 Hz stimulation. Calibration: 50 pA and 15 ms. I, K, The βAR agonist isoproterenol (10 min, 100 μm; I) and Epac activator 8pCPT (50 μm, 10 min; K) induced a sustained increase in EPSC amplitude that occludes the 10 Hz induced LTP. J, L, Quantification of the changes in EPSC amplitude induced by isoproterenol (J) and 8pCPT (L) followed by 10 Hz stimulation. The data were measured 10 min after isoproterenol/8pCPT application (2) [n = 12 cells/12 slice/6 mice, t = 453.5, df = 12 and n = 13 cells/13 slices/6 mice, t = 7.186, df = 14, respectively, compared with (1)]. The data were also measured 30 min after 10 Hz stimulation (3) [t = 0.04,229, df = 22 and t = 0.5006, df = 24, respectively, compared with (2)]. EPSC sample traces (I, K) represent the mean of six consecutive EPSCs at 0.05 Hz taken before (1) and 10 min after (2) isoproterenol/8pCPT treatment, and 30 min after 10 Hz stimulation (3). The data represent the mean ± SEM.
Figure 7.
Figure 7.
Epac2−/− slices lack PF–PC LTP, and they display no isoproterenol induced increase in SV docking. A, A 10 Hz, 10 s stimulation induced a sustained increase in the EPSC amplitude in WT cerebellar slices that was absent in slices from Epac2−/− littermates. B, Quantification of the changes in EPSC amplitude measured 40 min after stimulation (2) in slices from WT (n = 13 cells/13 slices/6 mice, t = 3.745, df = 13) or Epac2−/− mice (n = 15 cells/15 slices/8 mice, t = 0.4169, df = 15) compared with the values before stimulation (1). C, Quantification of the changes in the PPR measured 40 min after stimulation (2) in slices from WT (t = 3.403, df = 24) and Epac2−/− mice (t = 0.2000, df = 28) compared with the values before stimulation (1). D, The aEPSCs induced when replacing Ca2+ with Sr2+ (2.5 mm) 30 min after 10 Hz stimulation. After 5 min, individual traces showing aEPSCs were analyzed (2 min) in basal (gray) and stimulated WT (black) or Epac2−/− (red) slices. E, F, Changes in aEPSC frequency induced by 10 Hz stimulation in WT (t = 4.321, df = 11) and Epac2−/− (t = 0.6774, df = 14) slices. G, H, Changes in aEPSC amplitude induced by 10 Hz stimulation in WT (t = 1.225, df = 424) and Epac2−/− (t = 0.4063, df = 459) slices. I, J, Isoproterenol (100 μm, 10 min) increases SV docking in WT mice. M, Quantification of the isoproterenol induced an increase in SV docking in WT mice. N, Isoproterenol increases the number of SVs 0–5 nm from the AZ membrane without changing the SVs 5–10 nm from the AZ membrane in WT slices. O, Isoproterenol treatment did not change the total number of SVs up to 100 µm from the AZ in WT slices. K, L, Isoproterenol treatment fails to increase SV docking in Epac2−/− mice. P, Quantification of the isoproterenol-induced increase in SV docking in Epac2−/− slices. Q, Isoproterenol did not change the number of SVs within 5 or 5–10 nm from the AZ membrane in Epac2−/− slices. R, Isoproterenol treatment did not change the total number of SVs up to 100 µm from the AZ membrane in Epac 2−/− slices. Calibration: A, 50 pA and 15 ms; D, 20 pA and 40 ms. Scale bars: I–L, 100 nm. The data represent the mean ± SEM.
Figure 8.
Figure 8.
PF–PC LTP is associated with an increase in the RRP size that does not occur in Epac2−/− mice. A, G, The RRP size was measured after a train of 100 pulses at 40 Hz applied 30 min after LTP induction, as well as in control (unstimulated) slices from both WT and Epac2−/− mice (littermates). B, H, EPSC amplitude during the 40 Hz train, the traces showing individual examples. Calibration: 100 pA and 100 ms. C, I, Cumulative EPSC amplitudes in control and LTP-induced cells. The RRP size was calculated from the cumulative amplitude plots as the y-intercept from a linear fit of the steady-state level attained during the high-frequency train. D, J, Quantification of the changes in the RRP size induced by a 10 Hz stimulus in slices from WT (D: control slices, n = 18 cells/18 slices/8 mice, 10 Hz stimulated slices, n = 21 cells/21 slices/9 mice, t = 3.506, df = 37) and Epac2−/− mice (J: control slices, n = 21 cells/21 slices/10 mice, and 10 Hz stimulates slices, t = 0.5379, df = 39). E, K, Quantification of the replenishment rate (pA/ms) in slices from WT mice (E: t = 0.064, df = 37) and Epac2−/− mice (K: t = 0.5578, df = 40). F, L, Quantification of the pves in slices from WT mice (F: t = 2.236, df = 25) or Epac2−/− mice (L: t = 0.8575, df = 37). The data represent the mean ± SEM.

Similar articles

Cited by

References

    1. Abbott LC, Sotelo C (2000) Ultrastructural analysis of catecholaminergic innervation in weaver and normal mouse cerebellar cortices. J Comp Neurol 426:316–329. 10.1002/1096-9861(20001016)426:2<316::AID-CNE11>3.0.CO;2-8 - DOI - PubMed
    1. Alonso B, Bartolomé-Martín D, Ferrero JJ, Ramírez-Franco J, Torres M, Sánchez-Prieto J (2017) CB1 receptors down-regulate a cAMP/Epac2/PLC pathway to silence the nerve terminals of cerebellar granule cells. J Neurochem 142:350–361. 10.1111/jnc.14059 - DOI - PubMed
    1. Ariel P, Hoppa MB, Ryan TA (2013) Intrinsic variability in Pv, RRP size, Ca(2+) channel repertoire, and presynaptic potentiation in individual synaptic boutons. Front Synaptic Neurosci 4:9. 10.3389/fnsyn.2012.00009 - DOI - PMC - PubMed
    1. Augustin I, Korte S, Rickmann M, Kretzschmar HA, Súdhof TC, Herms JW, Brose N (2001) The cerebellum-specific Munc13 isoform Munc13-3 regulates cerebellar synaptic transmission and motor learning. J Neurosci 21:10–17. 10.1523/JNEUROSCI.21-01-00010.2001 - DOI - PMC - PubMed
    1. Bauer CS, Woolley RJ, Teschemacher AG, Seward EP (2007) Potentiation of exocytosis by phospholipase C-coupled G-protein-coupled receptors requires the priming protein Munc13-1. J Neurosci 27:212–219. 10.1523/JNEUROSCI.4201-06.2007 - DOI - PMC - PubMed

Publication types

MeSH terms

Substances