

Effect of border policy on exposure and vulnerability to climate change
- PMID: 33046645
- PMCID: PMC7604488
- DOI: 10.1073/pnas.2007597117
Effect of border policy on exposure and vulnerability to climate change
Abstract
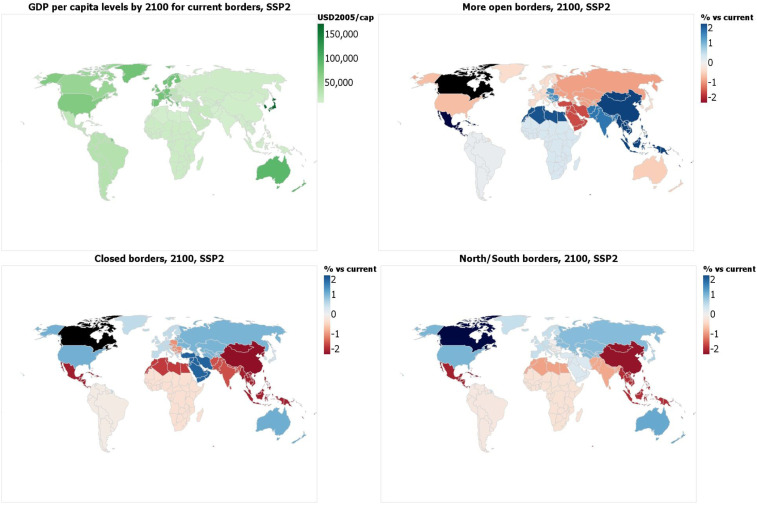
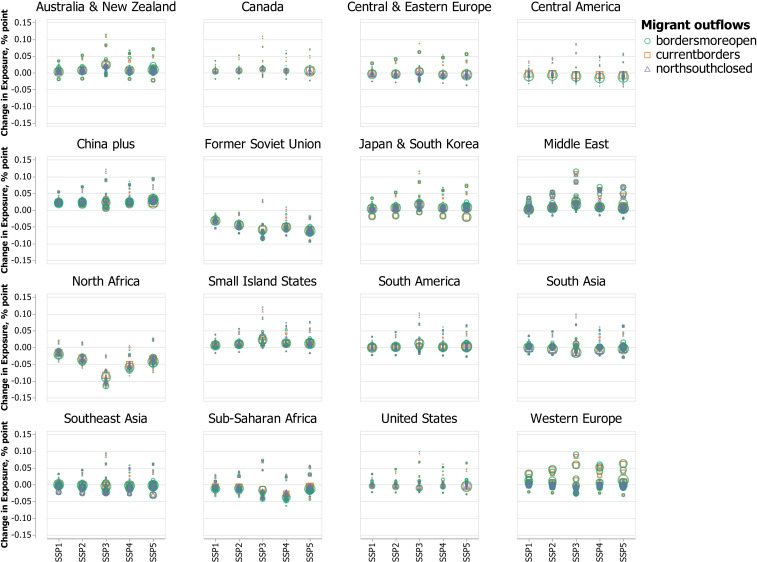
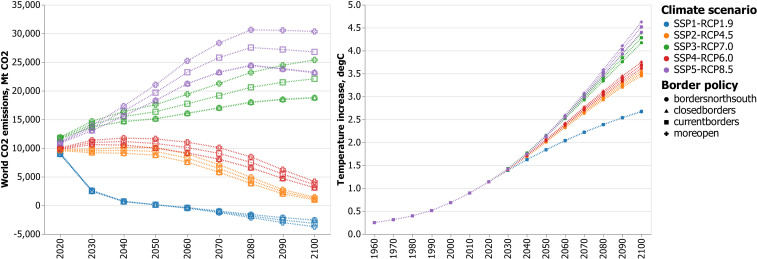
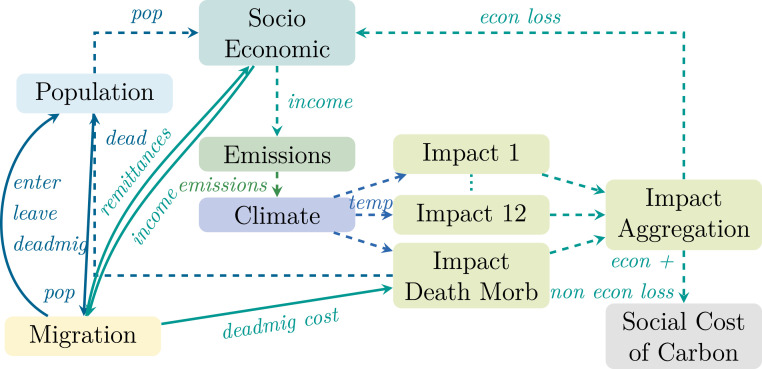
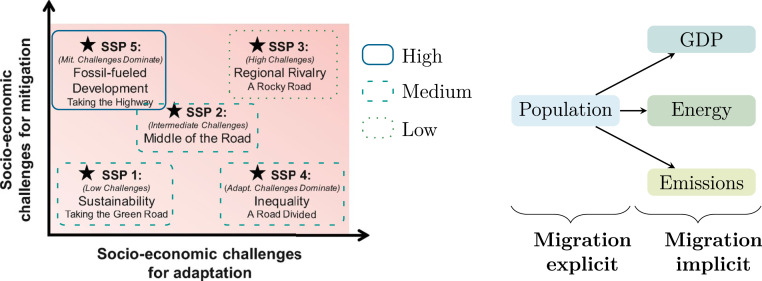
Migration may be increasingly used as adaptation strategy to reduce populations' exposure and vulnerability to climate change impacts. Conversely, either through lack of information about risks at destinations or as outcome of balancing those risks, people might move to locations where they are more exposed to climatic risk than at their origin locations. Climate damages, whose quantification informs understanding of societal exposure and vulnerability, are typically computed by integrated assessment models (IAMs). Yet migration is hardly included in commonly used IAMs. In this paper, we investigate how border policy, a key influence on international migration flows, affects exposure and vulnerability to climate change impacts. To this aim, we include international migration and remittance dynamics explicitly in a widely used IAM employing a gravity model and compare four scenarios of border policy. We then quantify effects of border policy on population distribution, income, exposure, and vulnerability and of CO2 emissions and temperature increase for the period 2015 to 2100 along five scenarios of future development and climate change. We find that most migrants tend to move to areas where they are less exposed and vulnerable than where they came from. Our results confirm that migration and remittances can positively contribute to climate change adaptation. Crucially, our findings imply that restrictive border policy can increase exposure and vulnerability, by trapping people in areas where they are more exposed and vulnerable than where they would otherwise migrate. These results suggest that the consequences of migration policy should play a greater part in deliberations about international climate policy.
Keywords: border policy; climate change impacts; integrated assessment models; migration; shared socioeconomic pathways.
Copyright © 2020 the Author(s). Published by PNAS.
Conflict of interest statement
The authors declare no competing interest.
Figures
Similar articles
-
Climate Vulnerability and Human Migration in Global Perspective.Sustainability. 2017 May;9(5):720. doi: 10.3390/su9050720. Epub 2017 Apr 30. Sustainability. 2017. PMID: 29707262 Free PMC article.
-
Policy impact pathways of climate-related urban health vulnerability - A retrospective analysis.Health Place. 2024 Jul;88:103266. doi: 10.1016/j.healthplace.2024.103266. Epub 2024 May 17. Health Place. 2024. PMID: 38761638
-
Forest management under climatic and social uncertainty: trade-offs between reducing climate change impacts and fostering adaptive capacity.J Environ Manage. 2013 Jan 15;114:461-9. doi: 10.1016/j.jenvman.2012.09.028. Epub 2012 Nov 26. J Environ Manage. 2013. PMID: 23195141
-
An ill wind? Climate change, migration, and health.Environ Health Perspect. 2012 May;120(5):646-54. doi: 10.1289/ehp.1104375. Epub 2012 Jan 20. Environ Health Perspect. 2012. PMID: 22266739 Free PMC article. Review.
-
Impacts of climate change on the public health of the Mediterranean Basin population - Current situation, projections, preparedness and adaptation.Environ Res. 2020 Mar;182:109107. doi: 10.1016/j.envres.2019.109107. Epub 2020 Jan 7. Environ Res. 2020. PMID: 32069750 Review.
Cited by
-
Compound impacts from droughts and structural vulnerability on human mobility.iScience. 2022 Nov 23;25(12):105491. doi: 10.1016/j.isci.2022.105491. eCollection 2022 Dec 22. iScience. 2022. PMID: 36590461 Free PMC article.
-
Quantifying the global climate feedback from energy-based adaptation.Nat Commun. 2025 Apr 26;16(1):3928. doi: 10.1038/s41467-025-59201-7. Nat Commun. 2025. PMID: 40281020 Free PMC article.
-
Comprehensive evidence implies a higher social cost of CO2.Nature. 2022 Oct;610(7933):687-692. doi: 10.1038/s41586-022-05224-9. Epub 2022 Sep 1. Nature. 2022. PMID: 36049503 Free PMC article.
-
Incorporating human behaviour into Earth system modelling.Nat Hum Behav. 2022 Nov;6(11):1493-1502. doi: 10.1038/s41562-022-01478-5. Epub 2022 Nov 16. Nat Hum Behav. 2022. PMID: 36385182 Review.
References
-
- The Government Office , Foresight: Migration and Global Environmental Change: Final Project Report (The Government Office for Science, London, 2011).
-
- Desmet K., et al. , Evaluating the economic cost of coastal flooding. Am. Econ. J. Macroeconomics, in press.
-
- Cattaneo C., et al. , Human migration in the era of climate change. Rev. Environ. Econ. Pol. 13, 189–206 (2019).
-
- Mastrorillo M., et al. , The influence of climate variability on internal migration flows in South Africa. Glob. Environ. Change 39, 155–169 (2016).
-
- Rigaud K. K., et al. , “Groundswell: Preparing for internal climate migration” (Report, World Bank, Washington, DC, 2018), pp. 1–47.
Associated data
LinkOut - more resources
Full Text Sources
