. 2020 Oct 12;7(1):338.
doi: 10.1038/s41597-020-00681-1.

Bias-corrected climate projections for South Asia from Coupled Model Intercomparison Project-6

Affiliations

Bias-corrected climate projections for South Asia from Coupled Model Intercomparison Project-6

Vimal Mishra et al. Sci Data. .

Abstract

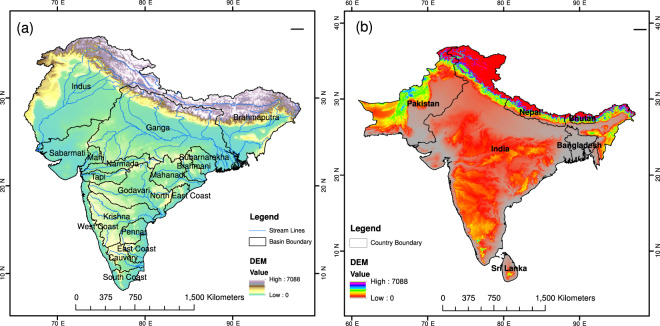
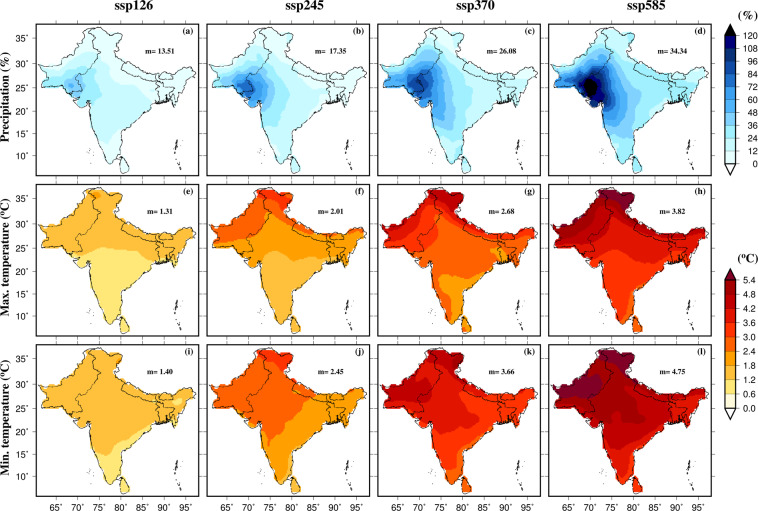
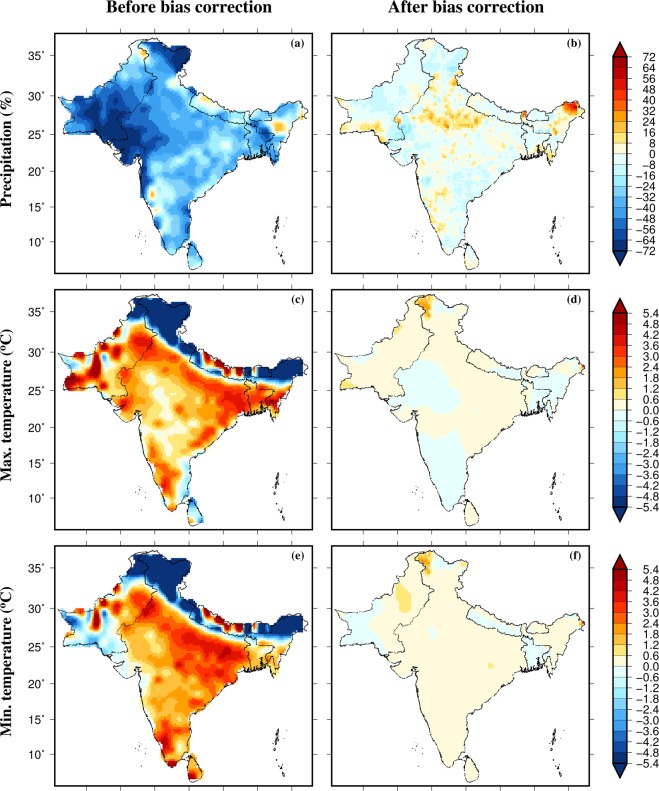
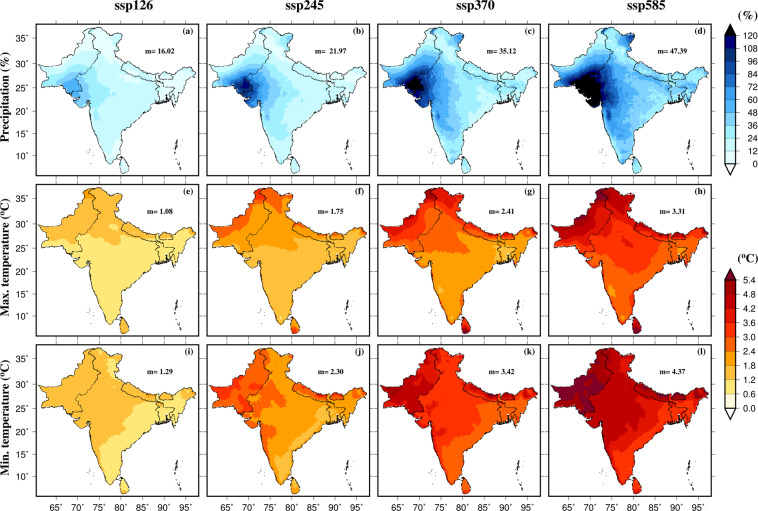
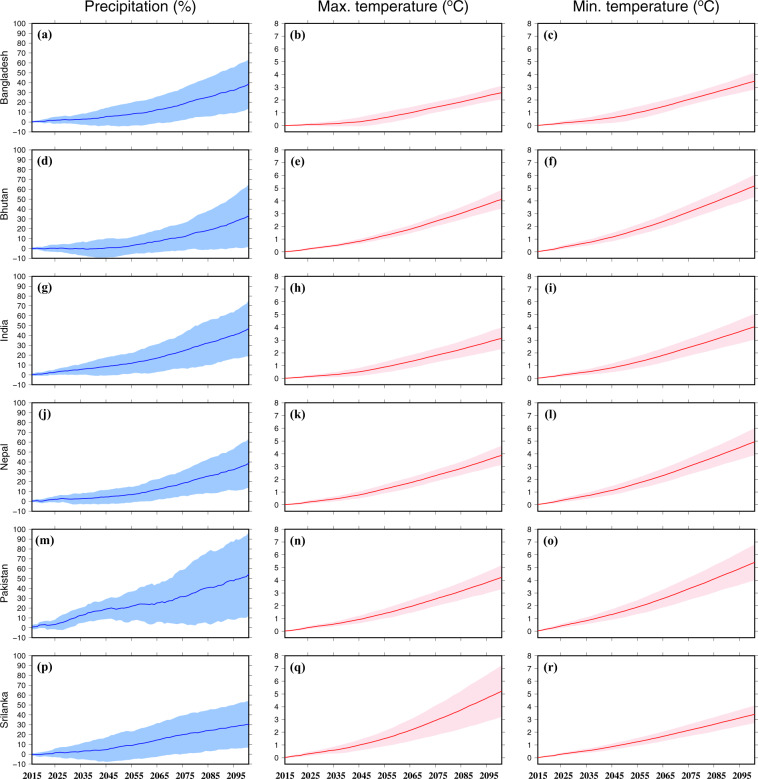
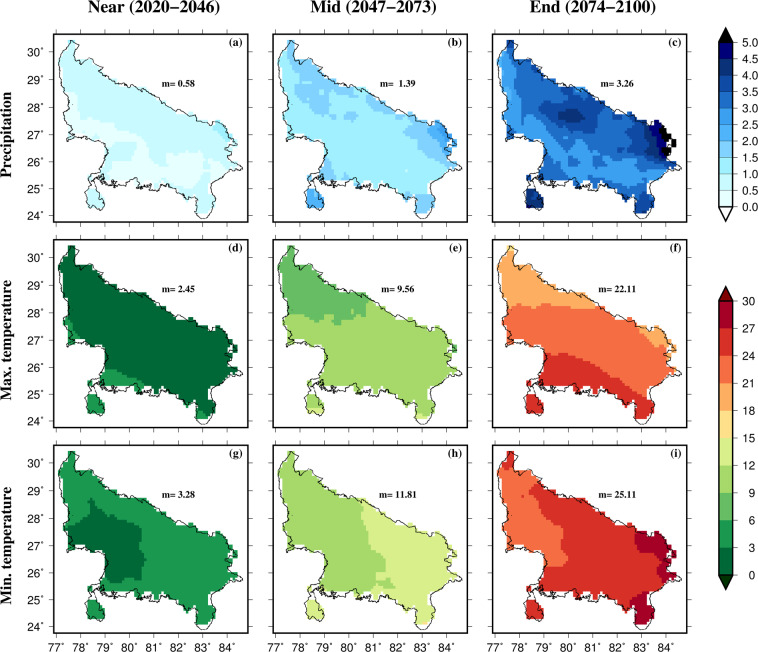
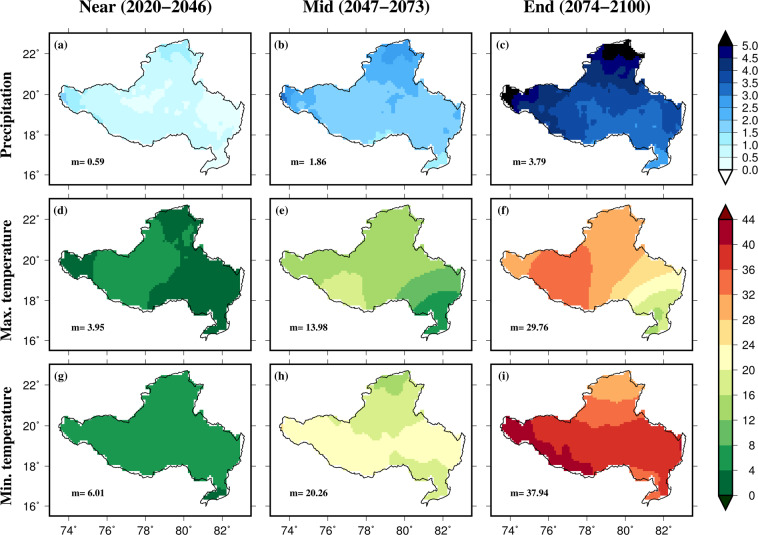
Climate change is likely to pose enormous challenges for agriculture, water resources, infrastructure, and livelihood of millions of people living in South Asia. Here, we develop daily bias-corrected data of precipitation, maximum and minimum temperatures at 0.25° spatial resolution for South Asia (India, Pakistan, Bangladesh, Nepal, Bhutan, and Sri Lanka) and 18 river basins located in the Indian sub-continent. The bias-corrected dataset is developed using Empirical Quantile Mapping (EQM) for the historic (1951-2014) and projected (2015-2100) climate for the four scenarios (SSP126, SSP245, SSP370, SSP585) using output from 13 General Circulation Models (GCMs) from Coupled Model Intercomparison Project-6 (CMIP6). The bias-corrected dataset was evaluated against the observations for both mean and extremes of precipitation, maximum and minimum temperatures. Bias corrected projections from 13 CMIP6-GCMs project a warmer (3-5°C) and wetter (13-30%) climate in South Asia in the 21st century. The bias-corrected projections from CMIP6-GCMs can be used for climate change impact assessment in South Asia and hydrologic impact assessment in the sub-continental river basins.


Conflict of interest statement

The authors declare no competing interests.

Figures

Fig. 1
Fig. 1
Geographical domains for bias-corrected CMIP6 projections. (a) Indian Subcontinent river basin boundaries (black) with the streamlines (blue). Topography in the color scale is shown in the background. Names of the sub-continental river basins are written within the basin boundaries. (b) South Asian country boundaries (black) where topography in the color scale is shown in the background.
Fig. 2
Fig. 2
Projections of precipitation, maximum and minimum temperatures for the end of 21st century using raw output from CMIP6-GCMs. (ad) Multimodel ensemble mean projected change in mean annual precipitation (%) for the Far (2074–2100) with respect to the historical period (1988–2014), (eh) same as (ad) but for the mean annual maximum temperature, (il) same as (ad) but for the mean annual minimum temperature. Median of the multimodel ensemble mean precipitation; maximum and minimum temperatures are shown in each panel. Projected changes were estimated for the four scenarios (SSP126, SSP245, SSP370, and SSP585) against the historical period.
Fig. 3
Fig. 3
Multimodel ensemble mean bias in precipitation, maximum and minimum temperatures in 13 CMIP6-GCMs. (a) Bias (%) in mean annual precipitation for the historical period (1985–2014), (b) bias in mean annual precipitation (%) after the bias correction, (c,d) Bias (°C) in mean annual maximum temperature before and after bias correction, and (e,f) bias (°C) in mean annual minimum temperature before and after bias correction.
Fig. 4
Fig. 4
Multimodel ensemble mean bias in the 90th percentile of precipitation, maximum and minimum temperatures in 13 CMIP6-GCMs. (a) Bias (%) in extreme precipitation for the historical period (1985–2014), (b) bias in extreme precipitation (%) after the bias correction, (c,d) Bias (°C) in extreme maximum temperature before and after bias correction, and (e,f) bias (°C) in extreme minimum temperature before and after bias correction. The 90th percentile of daily precipitation was estimated using rainy days with precipitation more than 1 mm.
Fig. 5
Fig. 5
Seasonal cycle of bias-corrected precipitation, maximum and minimum temperatures. Comparison of the multimodel model ensemble (blue) mean seasonal cycle of bias-corrected (a) precipitation, (b) maximum temperature, and (c) minimum temperature against the observations for the 1985–2014 period (red). The shaded area represents uncertainty (one standard deviation) of all 13 CMIP6-GCMs.
Fig. 6
Fig. 6
Projections of precipitation, maximum and minimum temperatures for the end of the 21st century using bias-corrected data from CMIP6-GCMs. (ad) The multimodel ensemble mean projected change in mean annual precipitation (%) for the Far (2074–2100) with respect to the historical period (1988–2014), (eh) same as (ad) but for the mean annual maximum temperature, (il) same as (ad) but for the mean annual minimum temperature. Median of the multimodel ensemble mean precipitation; maximum and minimum temperatures are shown in each panel. Projected changes were estimated for the four scenarios (SSP126, SSP245, SSP370, and SSP585) against the historical period.
Fig. 7
Fig. 7
Multimodel ensemble mean change in precipitation, maximum and minimum temperatures in South Asia. Countrywise changes in the multimodel ensemble mean annual precipitation (%), maximum temperature (°C), and minimum temperature (°C) estimated using a 30-year moving window against the historical reference period of 1985–2014. The shaded region shows uncertainty (estimated using one standard deviation) based on 13 CMIP6-GCMs.
Fig. 8
Fig. 8
Changes in the frequency of extreme precipitation, maximum and minimum temperature in the state of Uttar Pradesh. Projected changes in the frequency of precipitation (ac), maximum temperature (df), and minimum temperature (gi) extremes estimated using 95the percentile of rainy days (precipitation more than 1 mm) and 95th percentile of maximum and minimum summer (April-May) temperatures for the state of Uttar Pradesh (India). Median frequency is shown in each panel. Changes in the frequency were estimated against the historical reference period of 1988–2014.
Fig. 9
Fig. 9
Changes in the frequency of extreme precipitation, maximum and minimum temperature in the state of Godavari basin. Projected changes in the frequency of precipitation (ac), maximum temperature (df), and minimum temperature (gi) extremes estimated using 95th percentile of rainy days (precipitation more than 1 mm) and 95th percentile of maximum and minimum summer (April-May) temperatures for the state of Uttar Pradesh (India). Median frequency is shown in each panel. Changes in the frequency were estimated against the historical reference period of 1988–2014.

References

    1. Suarez-Gutierrez L, Müller WA, Li C, Marotzke J. Dynamical and thermodynamical drivers of variability in European summer heat extremes. Clim. Dyn. 2020;54:4351–4366. doi: 10.1007/s00382-020-05233-2. - DOI
    1. Diffenbaugh NS, Giorgi F. Climate change hotspots in the CMIP5 global climate model ensemble. Clim. Change. 2012;114:813–822. doi: 10.1007/s10584-012-0570-x. - DOI - PMC - PubMed
    1. Knox, J., Hess, T., Daccache, A. & Wheeler, T. Climate change impacts on crop productivity in Africa and South Asia. Environ. Res. Lett. 7(3), 034032 (2012).
    1. Turner AG, Annamalai H. Climate change and the South Asian summer monsoon. Nature Climate Change. 2012;2:587–595. doi: 10.1038/nclimate1495. - DOI
    1. Lobell, D. B. & Burke, M. B. Why are agricultural impacts of climate change so uncertain? the importance of temperature relative to precipitation. Environ. Res. Lett. 3(3), 034007 (2008).

Publication types