. 2020 Oct 12;11(1):5140.
doi: 10.1038/s41467-020-18861-3.

Autism spectrum disorder-like behavior caused by reduced excitatory synaptic transmission in pyramidal neurons of mouse prefrontal cortex

Affiliations

Autism spectrum disorder-like behavior caused by reduced excitatory synaptic transmission in pyramidal neurons of mouse prefrontal cortex

Hiroaki Sacai et al. Nat Commun. .

Abstract

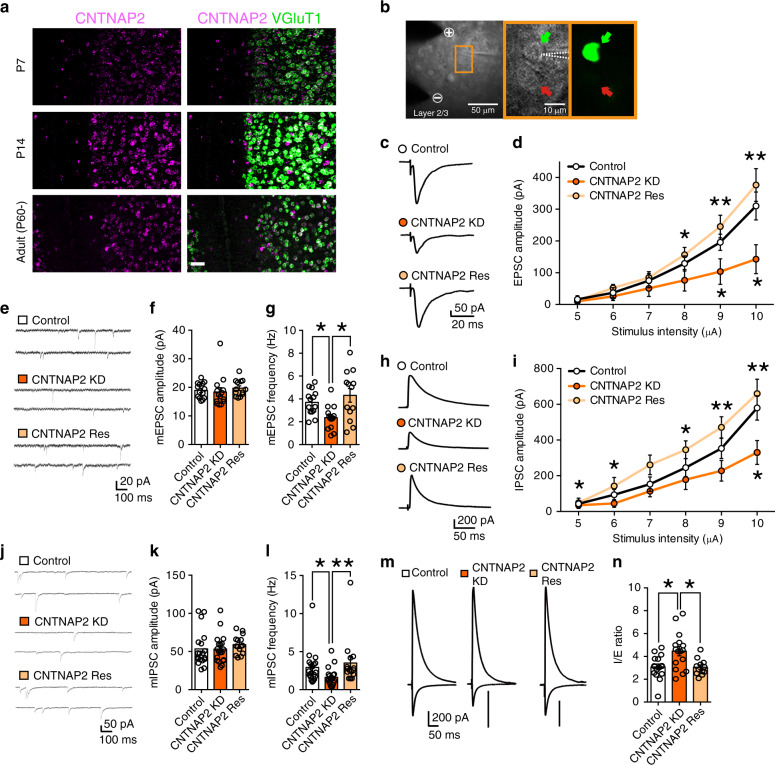
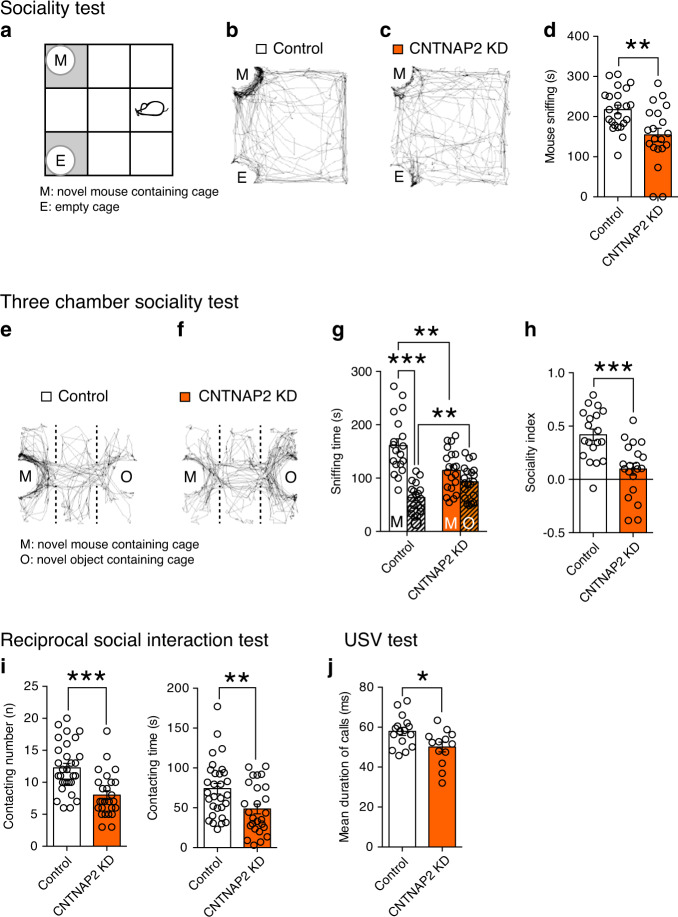
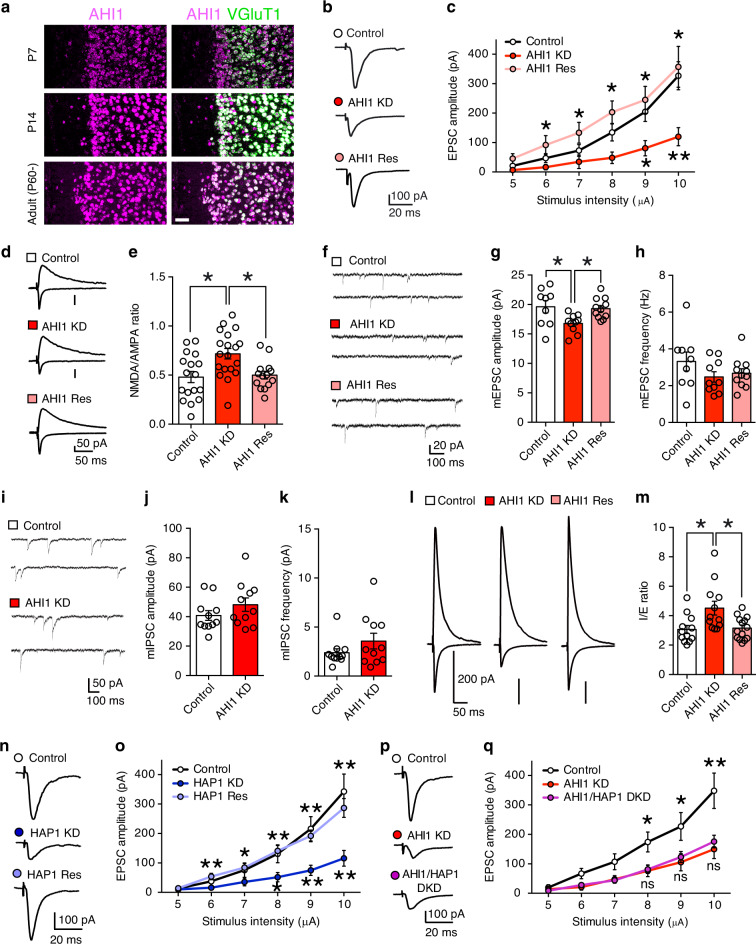
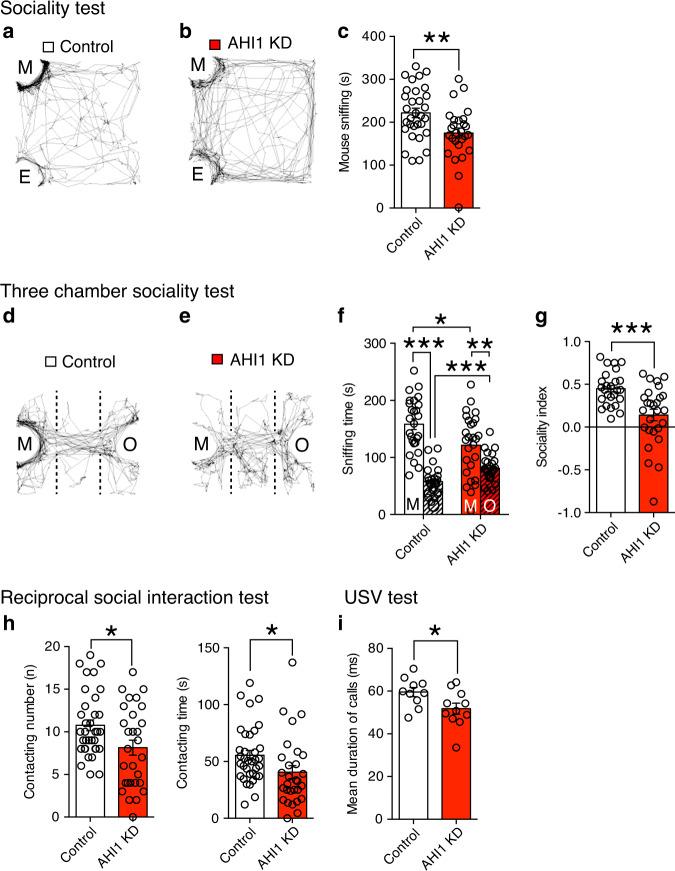
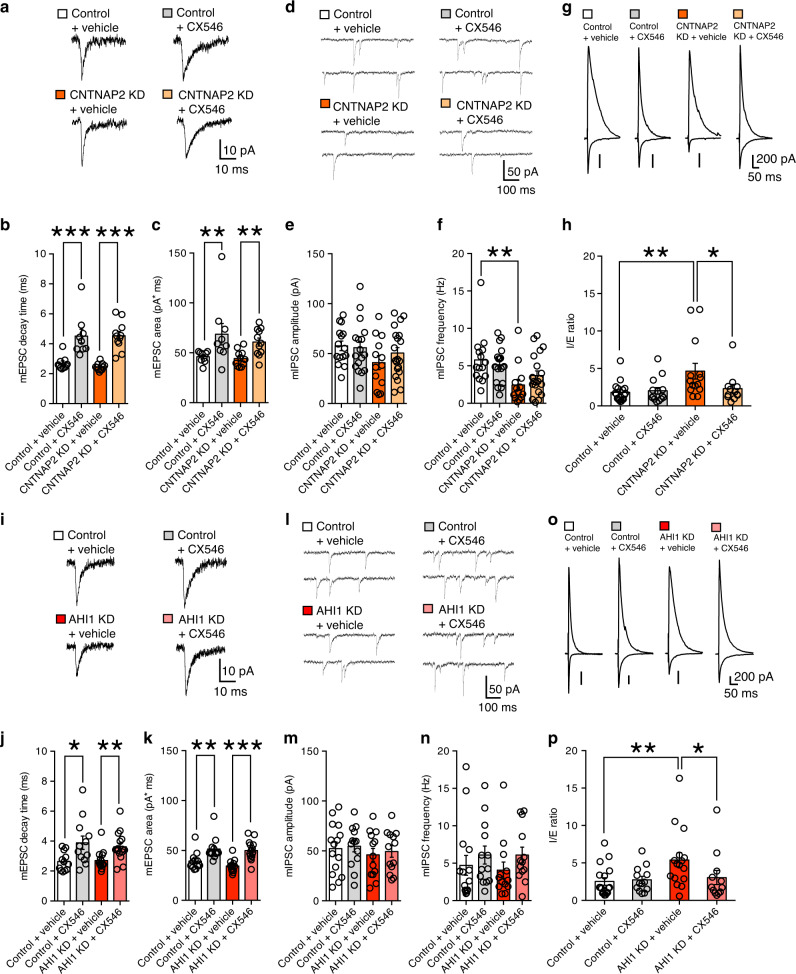
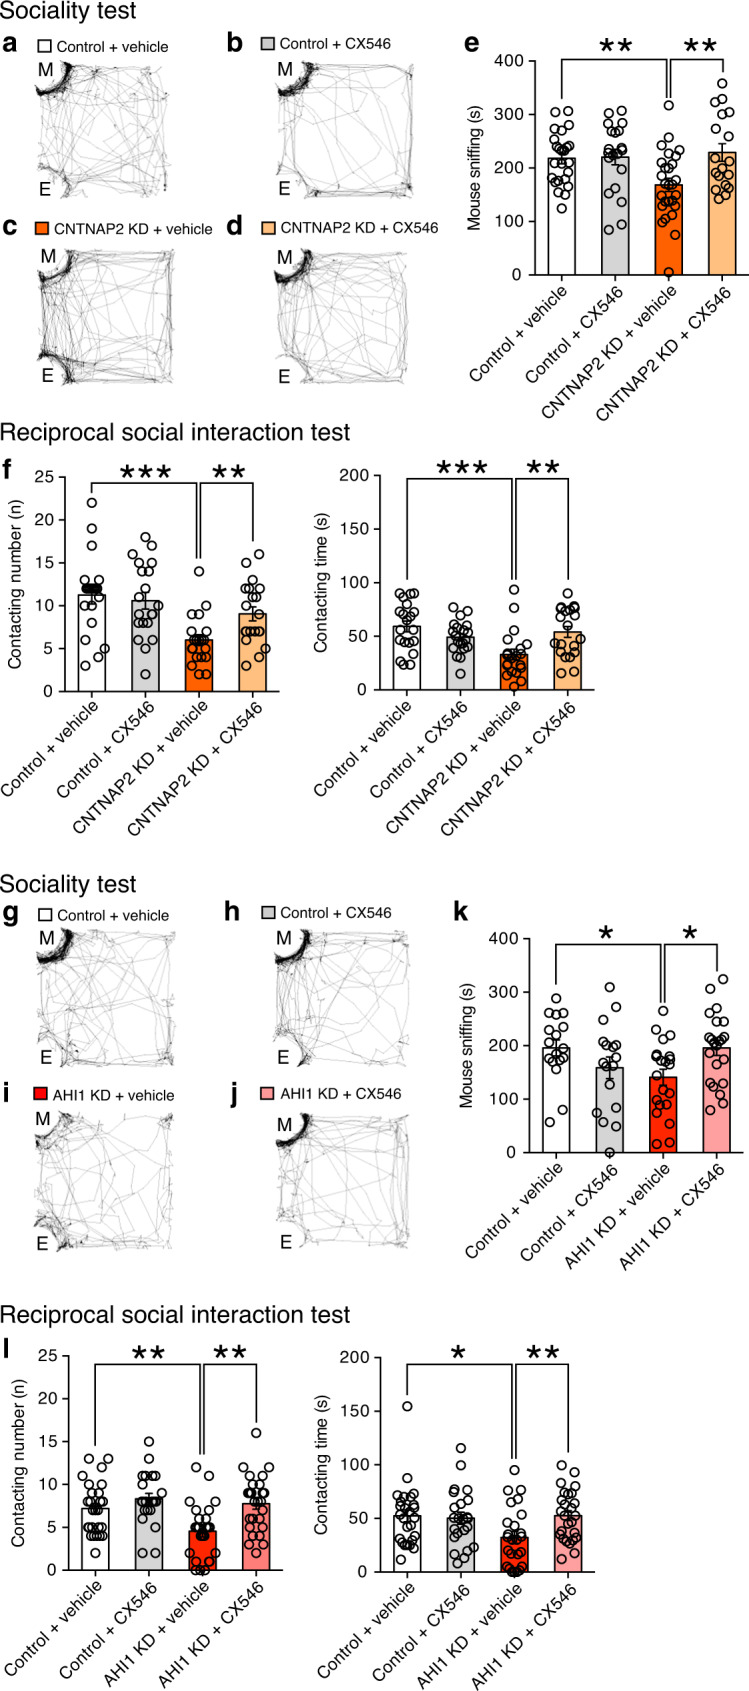
Autism spectrum disorder (ASD) is thought to result from deviation from normal development of neural circuits and synaptic function. Many genes with mutation in ASD patients have been identified. Here we report that two molecules associated with ASD susceptibility, contactin associated protein-like 2 (CNTNAP2) and Abelson helper integration site-1 (AHI1), are required for synaptic function and ASD-related behavior in mice. Knockdown of CNTNAP2 or AHI1 in layer 2/3 pyramidal neurons of the developing mouse prefrontal cortex (PFC) reduced excitatory synaptic transmission, impaired social interaction and induced mild vocalization abnormality. Although the causes of reduced excitatory transmission were different, pharmacological enhancement of AMPA receptor function effectively restored impaired social behavior in both CNTNAP2- and AHI1-knockdown mice. We conclude that reduced excitatory synaptic transmission in layer 2/3 pyramidal neurons of the PFC leads to impaired social interaction and mild vocalization abnormality in mice.


Conflict of interest statement

The authors declare no competing interests.

Figures

Fig. 1
Fig. 1. Effects of CNTNAP2 knockdown in layer 2/3 pyramidal neurons of the PFC on synaptic function.
a Images from double fluorescence in situ hybridization for mRNA of CNTNAP2 and that of VGluT1 in layer 2/3 pyramidal neurons. Scale bar, 50 μm. b Images of a recorded pyramidal neuron. Dashed white lines delineate the patch pipette. + and − show the anode and cathode, respectively, of the stimulation electrode. Bright field (middle) and fluorescent (right) images correspond to the orange rectangle in the left panel. Green and red arrows represent an EGFP-positive knockdown cell and an EGFP-negative control cell, respectively. c, d Traces (c) and input-output relationships (d) for EPSCs in control (white circles, n = 13 cells from 4 mice), CNTNAP2-knockdown (CNTNAP2-KD) (orange circles, n = 13 cells/4 mice) and CNTNAP2-rescue (CNTNAP2-Res) (light orange circles, n = 11 cells/4 mice) cells. eg Traces of mEPSCs (e) and summary graphs showing the amplitude (f) and frequency (g) of mEPSCs for control (white columns, n = 14 cells/4 mice), CNTNAP2-KD (orange columns, n = 14 cells/4 mice) and CNTNAP2-Res (light orange columns, n = 13 cells/4 mice) cells. h, i Traces (h) and input-output relationships (i) for IPSCs in control (white circles, n = 17 cells/3 mice), CNTNAP2-KD (orange circles, n = 16 cells/3 mice) and CNTNAP2-Res (light orange circles, n = 13 cells/2 mice) cells. jl Traces of mIPSCs (j) and summary graphs showing the amplitude (k), and frequency (l) of mIPSCs for control (white columns, n = 19 cells/6 mice), CNTNAP2-KD (orange columns, n = 19 cells/6 mice) and CNTNAP2-Res (light orange columns, n = 15 cells/3 mice) cells. m, n Traces (m) and the I/E ratio (n) for control (white column, n = 16 cells/5 mice), CNTNAP2-KD (orange column, n = 16 cells/5 mice) and CNTNAP2-Res (light orange column, n = 12 cells/3 mice) cells. *P < 0.05, **P < 0.01 (Dunn test). Data are mean ± SEM. Source data are provided as a Source Data file.
Fig. 2
Fig. 2. Effects of CNTNAP2 knockdown in layer 2/3 pyramidal neurons of the PFC on ASD-like behaviors.
ad Schema of the sociality test (a). Representative tracks (b, c), and summary graphs showing the amount of time sniffing the novel mouse (M) (d) for CNTNAP2-scramble (control) (white columns, n = 23) and CNTNAP2-KD (orange columns, n = 20) mice. eh Representative tracks (e, f) and summary graphs showing the amount of time sniffing the novel mouse (M) and the novel object (O) (g), and sociality index (h) for control (white columns, n = 19) and CNTNAP2-KD (orange columns, n = 20) mice. i Contacting number and time for control (white column, n = 30) and CNTNAP2-KD (orange column, n = 26) mice. j Duration of calls for control (white column, n = 16) and CNTNAP2-KD (orange column, n = 14) pups. *P < 0.05, **P < 0.01, ***P < 0.001 (Student’s t test or Paired t test). Data are mean ± SEM. Source data are provided as a Source Data file.
Fig. 3
Fig. 3. AHI1 regulates excitatory synaptic transmission through HAP1.
a Images from double fluorescence in situ hybridization for mRNA of AHI1 and that of VGluT1 in layer 2/3 pyramidal neurons. Scale bar, 50 μm. b, c Representative traces (b) and input-output relationships (c) for EPSCs in control (white circles, n = 11 cells/2 mice), AHI1-knockdown (AHI1-KD) (red circles, n = 10 cells/2 mice) and AHI1-rescue (AHI1-Res) (light red circles, n = 11 cells/4 mice) cells. d, e Traces (d) and NMDA/AMPA ratio (e) for control (white column, n = 17 cells/6 mice), AHI1-KD, (red column, n = 19 cells/7 mice) and AHI1-Res (light red column, n = 14 cells/5 mice) cells. fh Traces of mEPSC (f) and summary graphs showing the amplitude (g) and frequency (h) of mEPSC for control (white columns, n = 9 cells/3 mice), AHI1-KD (red columns, n = 10 cells/3 mice) and AHI1-Res (light red columns, n = 11 cells/3 mice) cells. ik Traces of mIPSC (i) and summary graphs showing the amplitude (j) and frequency (k) of mIPSC for control (white columns, n = 11 cells/3 mice) and AHI1-KD (red columns, n = 11 cells/3 mice) cells. l, m Traces (l) and the I/E ratio (m) for control (white column, n = 12 cells/3 mice), AHI1-KD (orange column, n = 12 cells/3 mice) and AHI1-Res (light orange column, n = 14 cells/2 mice) cells. n, o Traces (n) and input-output relationships (o) for EPSCs in control (white circles, n = 13 cells/5 mice), HAP1-knockdown (HAP1-KD) (blue circles, n = 14 cells/5 mice) and HAP1-rescue (HAP1-Res) (light blue circles, n = 13 cells/5 mice) cells. p, q Traces (p) and input-output relationships (q) for EPSCs in control (white circles, n = 12 cells/4 mice), AHI1-KD (red circles, n = 11 cells/4 mice) and AHI1/HAP1 double-knockdown (AHI1/HAP1-DKD) (purple circles, n = 16 cells/3 mice) cells. *P < 0.05, **P < 0.01 (Dunn test). Data are mean ± SEM. Source data are provided as a Source Data file.
Fig. 4
Fig. 4. Effects of AHI1 knockdown in layer 2/3 pyramidal neurons of the PFC on ASD-like behaviors.
ac Representative tracks (a, b) and summary graphs showing the amount of time sniffing the novel mouse (M) (c) for AHI1-scramble (control) (white columns, n = 31) and AHI1-KD (red columns, n = 27) mice. dg Representative tracks (d, e) and summary graphs showing the amount of time sniffing the novel mouse (M) and the novel object (O) (f) and sociality index (g) for control (white columns, n = 26) and AHI1-KD (orange columns, n = 27) mice. h Contacting number and time in control (white column, n = 35) and AHI1-KD (red column, n = 29) mice. i Duration of calls in control (white column, n = 10) and AHI1-KD (red column, n = 11) pups. *P < 0.05, ***P < 0.001 (Student’s t test or Paired t test). Data are mean ± SEM. Source data are provided as a Source Data file.
Fig. 5
Fig. 5. CX546 enhances excitatory synaptic transmission in CNTNAP2-knockdown and AHI1-knockdown mice.
ac Traces of mEPSCs (a) and graphs showing the decay time constant (b) and the charge transfer (c) of mEPSCs for vehicle-treated control (white columns, n = 9 cells/6 mice), CX546-treated control (gray columns, n = 9 cells/6 mice), vehicle-treated CNTNAP2-KD (orange columns, n = 11 cells/7 mice) and CX546-treated CNTNAP2-KD (light orange columns, n = 11 cells/7 mice) cells. df Traces of mIPSCs (d), and graphs showing the amplitude (e) and frequency (f) of mIPSCs for vehicle-treated control (white columns, n = 15 cells/3 mice), CX546-treated control (gray columns, n = 17 cells/3 mice), vehicle-treated CNTNAP2-KD (orange columns, n = 13 cells/3 mice) and CX546-treated CNTNAP2-KD (light orange columns, n = 20 cells/3 mice) cells. gh Traces (g) and the I/E ratio (h) for vehicle-treated control (white columns, n = 17 cells/3 mice), CX546-treated control (gray columns, n = 14 cells/3 mice), vehicle-treated CNTNAP2-KD (orange columns, n = 14 cells/3 mice) and CX546-treated CNTNAP2-KD (light orange columns, n = 12 cells/3 mice) cells. ik Similar to ac but results of AHI1 KD, for vehicle-treated control (white columns, n = 12 cells/6 mice), CX546-treated control (gray columns, n = 12 cells/6 mice), vehicle-treated AHI1-KD (red columns, n = 15 cells/6 mice) and CX546-treated AHI1-KD (light red columns, n = 15 cells/6 mice) cells. ln Similar to df but results of AHI1 KD, for vehicle-treated control (white columns, n = 15 cells/3 mice), CX546-treated control (gray columns, n = 13 cells/3 mice), vehicle-treated AHI1-KD (red columns, n = 13 cells/3 mice) and CX546-treated AHI1-KD (light red columns, n = 13 cells/3 mice) cells. op Similar to gf but results of AHI1 KD, for vehicle-treated control (white columns, n = 17 cells/3 mice), CX546-treated control (gray columns, n = 13 cells/3 mice), vehicle-treated AHI1-KD (red columns, n = 16 cells/3 mice) and CX546-treated AHI1-KD (light red columns, n = 12 cells/3 mice) cells. *P < 0.05, **P < 0.01, ***P < 0.001 (Mann–Whitney U-test). Data are mean ± SEM. Source data are provided as a Source Data file.
Fig. 6
Fig. 6. CX546 improves reduced social interaction in CNTNAP2-knockdown and AHI1-knockdown mice.
a–e Representative tracks (ad) and summary graphs showing the amount of time sniffing the mouse (M) (e) in vehicle-treated control (white column, n = 24), CX546-treated control (gray column, n = 20), vehicle-treated CNTNAP2-KD (orange column, n = 28) and CX546-treated CNTNAP2-KD (light orange column, n = 20) mice. f Summary graphs showing the contacting number and time in vehicle-treated control (white column, n = 20), CX546-treated control (gray column, n = 20 mice), vehicle-treated CNTNAP2-KD (orange column, n = 20) and CX546-treated CNTNAP2-KD (light orange column, n = 20) mice. gk Representative tracks (gj) and summary graphs showing the amount of time sniffing the mouse (M) (k) in vehicle-treated control (white column, n = 17), CX546-treated control (gray column, n = 17), vehicle-treated AHI1-KD (red column, n = 21) and CX546-treated AHI1-KD (light red column, n = 22) mice. l Summary graphs showing the contacting number and time in vehicle-treated control (white column, n = 26), vehicle-treated control (gray column, n = 23), vehicle-treated AHI1-KD (red column, n = 25) and CX546-treated AHI1-KD (light red column, n = 26) mice. *P < 0.05, ***P < 0.001 (Student’s t test). Source data are provided as a Source Data file.

References

    1. Abrahams BS, Geschwind DH. Advances in autism genetics: on the threshold of a new neurobiology. Nat. Rev. Genet. 2008;9:341–355. doi: 10.1038/nrg2346. - DOI - PMC - PubMed
    1. Devlin B, Scherer SW. Genetic architecture in autism spectrum disorder. Curr. Opin. Genet Dev. 2012;22:229–237. doi: 10.1016/j.gde.2012.03.002. - DOI - PubMed
    1. Betancur C, Sakurai T, Buxbaum JD. The emerging role of synaptic cell-adhesion pathways in the pathogenesis of autism spectrum disorders. Trends Neurosci. 2009;32:402–412. doi: 10.1016/j.tins.2009.04.003. - DOI - PMC - PubMed
    1. Fassio A, et al. SYN1 loss-of-function mutations in autism and partial epilepsy cause impaired synaptic function. Hum. Mol. Genet. 2011;20:2297–2307. doi: 10.1093/hmg/ddr122. - DOI - PubMed
    1. Jamain S, et al. Mutations of the X-linked genes encoding neuroligins NLGN3 and NLGN4 are associated with autism. Nat. Genet. 2003;34:27–29. doi: 10.1038/ng1136. - DOI - PMC - PubMed

Publication types

MeSH terms