. 2020 Oct 12;10(1):17022.
doi: 10.1038/s41598-020-72864-0.

Transcriptional characterization of conjunctival melanoma identifies the cellular tumor microenvironment and prognostic gene signatures

Affiliations

Transcriptional characterization of conjunctival melanoma identifies the cellular tumor microenvironment and prognostic gene signatures

Julian Wolf et al. Sci Rep. .

Abstract

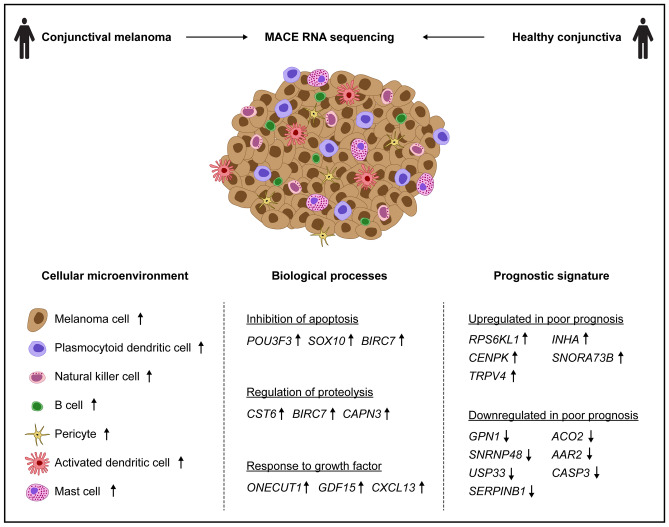
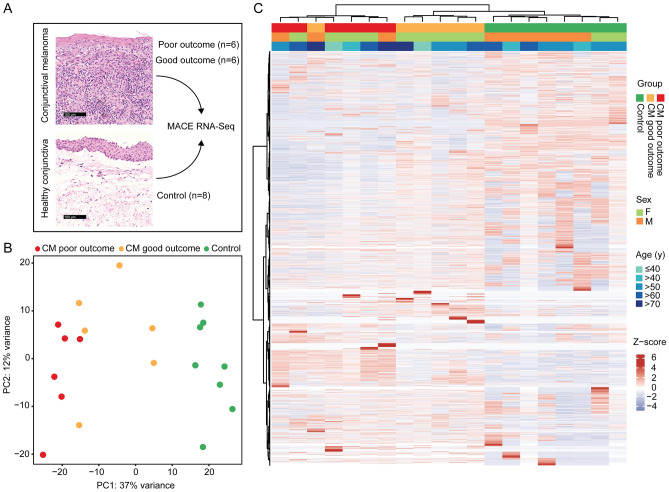
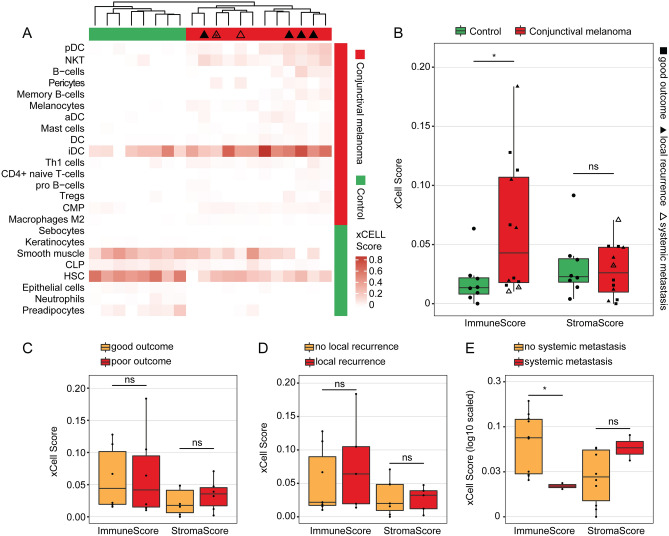
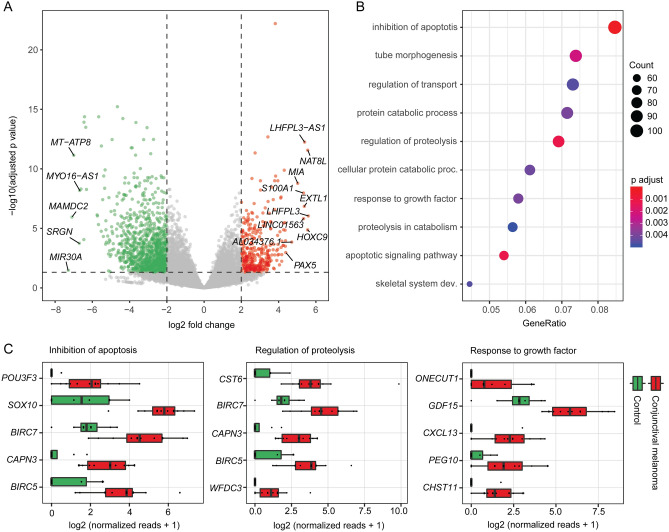
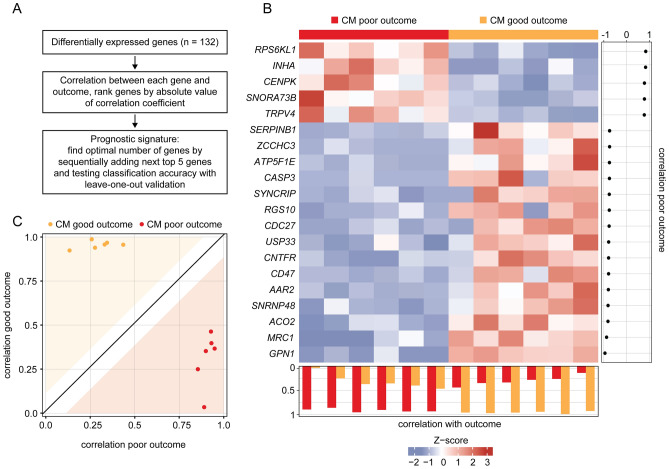
This study characterizes the transcriptome and the cellular tumor microenvironment (TME) of conjunctival melanoma (CM) and identifies prognostically relevant biomarkers. 12 formalin-fixed and paraffin-embedded CM were analyzed by MACE RNA sequencing, including six cases each with good or poor clinical outcome, the latter being defined by local recurrence and/or systemic metastases. Eight healthy conjunctival specimens served as controls. The TME of CM, as determined by bioinformatic cell type enrichment analysis, was characterized by the enrichment of melanocytes, pericytes and especially various immune cell types, such as plasmacytoid dendritic cells, natural killer T cells, B cells and mast cells. Differentially expressed genes between CM and control were mainly involved in inhibition of apoptosis, proteolysis and response to growth factors. POU3F3, BIRC5 and 7 were among the top expressed genes associated with inhibition of apoptosis. 20 genes, among them CENPK, INHA, USP33, CASP3, SNORA73B, AAR2, SNRNP48 and GPN1, were identified as prognostically relevant factors reaching high classification accuracy (area under the curve: 1.0). The present study provides new insights into the TME and the transcriptional profile of CM and additionally identifies new prognostic biomarkers. These results add new diagnostic tools and may lead to new options of targeted therapy for CM.


Conflict of interest statement

The authors declare no competing interests.

Figures

Figure 1
Figure 1
Study overview. The study characterizes the transcriptional profile of conjunctival melanoma compared to healthy conjunctiva, provides new insights into the cellular tumor microenvironment and identifies a prognostic signature classifying clinical outcome of conjunctival melanoma.
Figure 2
Figure 2
Unsupervised cluster analysis of twelve conjunctival melanoma (CM, six each with good or poor outcome) and eight normal conjunctival samples. Clinical outcome was classified based on the presence or absence of local recurrence and/or systemic metastases, respectively, with a follow up of at least 24 months. (A) Representative histological specimens of melanoma and normal conjunctiva as well as an overview of the study design. (B) Principle component analysis. (C) Unsupervised heatmap: basic demographic and clinical data are shown above. Each column represents one sample (red: melanoma with poor outcome, orange: melanoma with good outcome and green: healthy conjunctiva) and each row one expressed gene. There were 20.189 genes with at least one raw read. Unsupervised clustering was performed for both the rows and the columns (see dendrogram). The z-score represents a gene’s expression in relation to its mean expression by standard deviation units (red: upregulation, blue: downregulation). CM: melanoma, PC: principle component.
Figure 3
Figure 3
Cellular tumor microenvironment of conjunctival melanoma characterized by cell type enrichment analysis using xCell. The tool uses gene expression profiles of 64 immune and stromal cell types to calculate cell type enrichment scores. (A) Heatmap illustrating xCell enrichment scores of 24 of the 64 cell types which were significantly enriched in melanoma compared to normal conjunctiva (p < 0.05, Mann–Whitney U test). 16 cell types were up- and 8 cell types were downregulated in melanoma (see annotation on the right of the heatmap). Each row represents one cell type, each column represents one sample. Rows are ordered according to the fold change of mean enrichment scores for melanoma and normal conjunctiva, respectively. Columns are clustered according to similarities in xCell enrichment scores (see dendrogram). Samples with local recurrence and/or systemic metastasis are labeled (see legend in B, *: local recurrence and systemic metastasis). pDC: plasmacytoid dendritic cell, NKT: natural killer T cell, aDC: activated dendritic cell, DC: dendritic cell, iDC: immature dendritic cells, Th1: type 1 T-helper cells, Tregs: regulatory T cells, CMP: common myeloid progenitor, CLP: common lymphoid progenitor, HSC: hematopoietic stem cell. (B) Boxplots of the xCell immune and stroma score between melanoma and healthy conjunctiva. Each symbol represents one sample and the shape represents the prognostic groups also shown in (CE). (C–E): boxplots of the xCell immune and stroma score between melanoma with poor and good outcome (C), melanoma with and without local recurrence (D) and with or without systemic metastasis (E), respectively. *p < 0.05, ns: not significant (Mann–Whitney U test).
Figure 4
Figure 4
Characterization of the transcriptome of conjunctival melanoma (CM). (A) Volcano plot showing the up- and downregulated genes (red and green, respectively) in CM in comparison to normal conjunctiva. Genes not differentially expressed are shown in grey. The top ten upregulated as well as the top five downregulated genes in melanoma are labeled. (B) Gene ontology (GO) analysis of the differentially expressed genes in conjunctival melanoma. The top ten biological processes, which the DEG were involved in, are shown in the dot plot. “Inhibition of apoptosis” summarizes the two GO terms “negative regulation of apoptotic process” and “negative regulation of programmed cell death”, which overlapped with all 106 associated DEG. The size of the dots represents the number of associated genes (count). The adjusted p value of each GO term is shown by color. The gene ratio describes the ratio of the count to the number of all DEG. (C) Box plots illustrating normalized reads of the top five upregulated factors of three disease-relevant GO terms arranged by log2 fold change.
Figure 5
Figure 5
Prognostic transcriptome signature of conjunctival melanoma (CM). (A) Workflow of analysis. DEG between melanoma with poor and good clinical outcome were used to define a prognostic signature. Clinical outcome was defined based on the presence or absence of local recurrence and/or systemic metastases with a follow up of at least 24 months. (B) Heatmap of expression data of 20 prognostic marker genes of CM with good (orange) and poor outcome (red). Each row represents one gene and each column one tumor. The z-score represents a gene’s expression in relation to its mean expression by standard deviation units (red: upregulation, blue: downregulation). The genes are ordered according to their correlation with poor outcome, placing the gene with the highest correlation coefficient at the top (correlation coefficients are shown beside the heatmap). Tumors in the columns are ordered according to the correlation between the expression values of all 20 signature genes of one sample to the mean expression values of the other samples of both outcomes using leave-one-out validation (see methods). The correlation coefficients for both outcomes are shown below the heatmap and in (C): The white space around the diagonal is defined by the standard deviation of the distances of each sample from the diagonal. A sample that lies within the colored area can be assigned to an outcome with high probability.

Similar articles

Cited by

References

    1. Wong JR, Nanji AA, Galor A, Karp CL. Management of conjunctival malignant melanoma: a review and update. Expert Rev Ophthalmol. 2014;9:185–204. - PMC - PubMed
    1. Yu GP, Hu DN, McCormick S, Finger PT. Conjunctival melanoma: is it increasing in the United States? Am. J. Ophthalmol. 2003;135:800–806. - PubMed
    1. McLaughlin CC, et al. Incidence of noncutaneous melanomas in the U.S. Cancer. 2005;103:1000–1007. - PubMed
    1. Atzrodt L, Lapp T, Reinhard T, Auw-Haedrich C. Transformation of a naevus into a mixed pyogenic granuloma-naevus mimicking conjunctival melanoma. Pathology. 2020;52:269–271. - PubMed
    1. Paridaens AD, Minassian DC, McCartney AC, Hungerford JL. Prognostic factors in primary malignant melanoma of the conjunctiva: a clinicopathological study of 256 cases. Br. J. Ophthalmol. 1994;78:252–259. - PMC - PubMed

Publication types

MeSH terms

Substances