. 2020 Oct 12;10(1):16947.
doi: 10.1038/s41598-020-73795-6.

Selective effects of protein 4.1N deficiency on neuroendocrine and reproductive systems

Affiliations

Selective effects of protein 4.1N deficiency on neuroendocrine and reproductive systems

Hua Wang et al. Sci Rep. .

Abstract

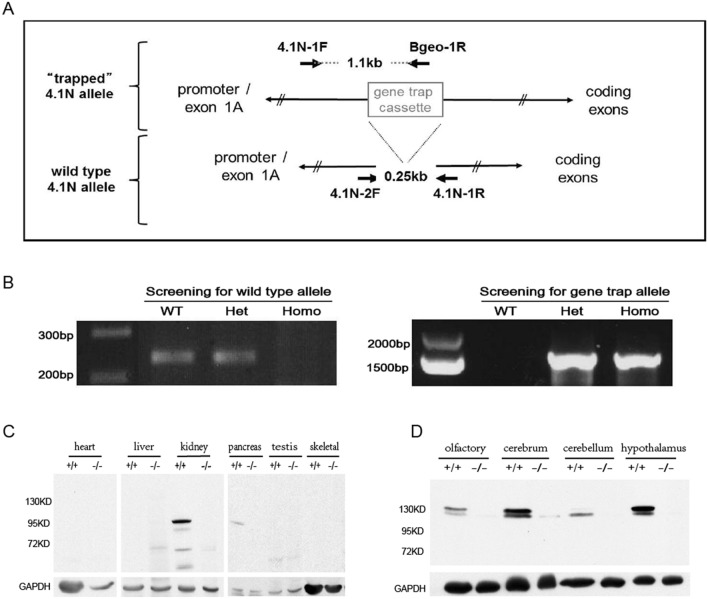
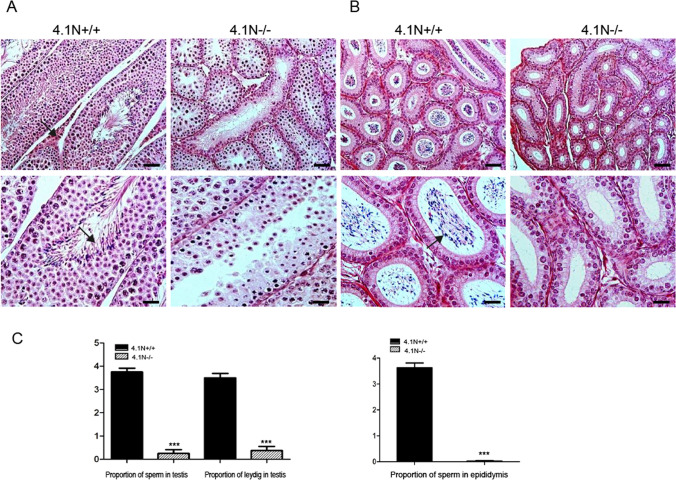
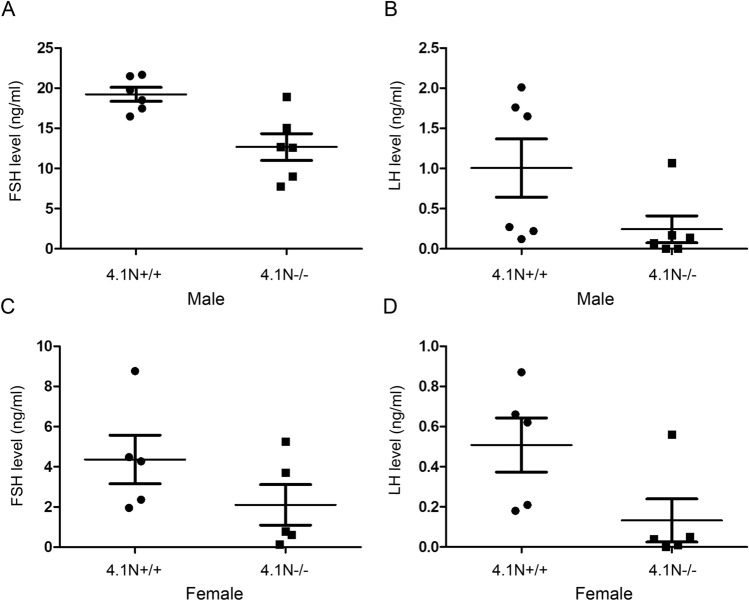
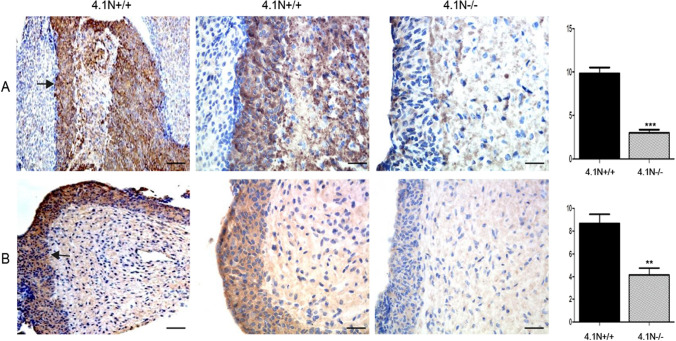
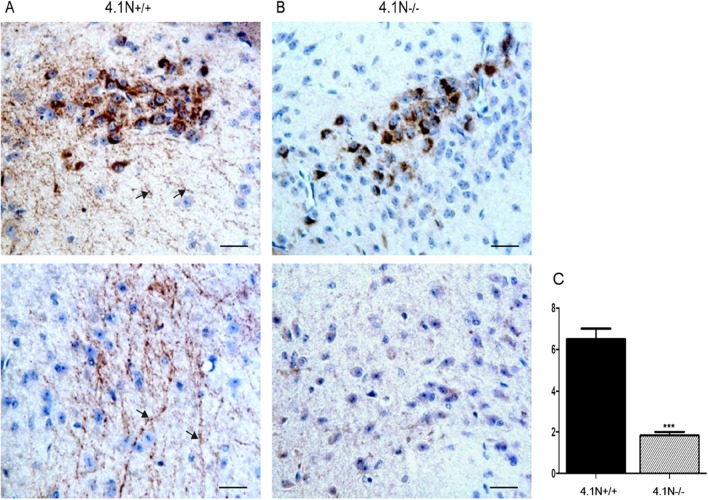
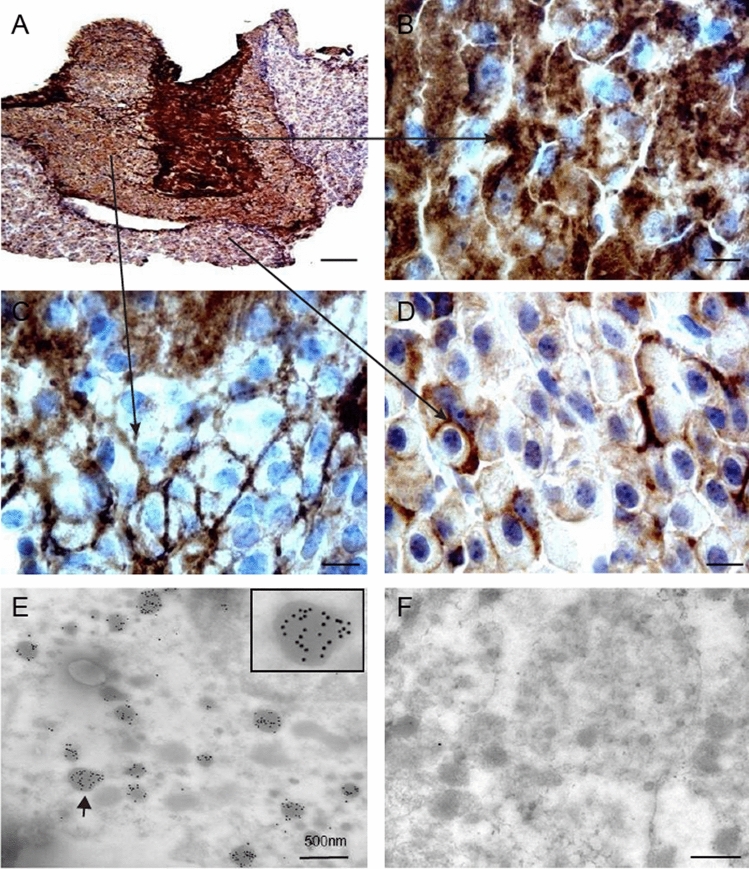
Protein 4.1N, a member of the protein 4.1 family, is highly expressed in the brain. But its function remains to be fully defined. Using 4.1N-/- mice, we explored the function of 4.1N in vivo. We show that 4.1N-/- mice were born at a significantly reduced Mendelian ratio and exhibited high mortality between 3 to 5 weeks of age. Live 4.1N-/- mice were smaller than 4.1N+/+ mice. Notably, while there were no significant differences in organ/body weight ratio for most of the organs, the testis/body and ovary/body ratio were dramatically decreased in 4.1N-/- mice, demonstrating selective effects of 4.1N deficiency on the development of the reproductive systems. Histopathology of the reproductive organs showed atrophy of both testis and ovary. Specifically, in the testis there is a lack of spermatogenesis, lack of leydig cells and lack of mature sperm. Similarly, in the ovary there is a lack of follicular development and lack of corpora lutea formation, as well as lack of secretory changes in the endometrium. Examination of pituitary glands revealed that the secretory granules were significantly decreased in pituitary glands of 4.1N-/- compared to 4.1N+/+. Moreover, while GnRH was expressed in both neuronal cell body and axons in the hypothalamus of 4.1N+/+ mice, it was only expressed in the cell body but not the axons of 4.1N-/- mice. Our findings uncover a novel role for 4.1N in the axis of hypothalamus-pituitary gland-reproductive system.


Conflict of interest statement

The authors declare no competing interests.

Figures

Figure 1
Figure 1
Disruption of 4.1N gene expression. (A) A gene trap cassette with an insertion downstream of exon 1A and upstream of exon 2 in the 4.1N gene. (B) Genotype analysis. Offspring of heterozygous mating pairs were screened by PCR using primer pairs that distinguish the wild type allele from the knockout allele. (C) Western blot analysis of multiple tissues. A prominent ~ 95 kDa band was detected in the kidney, pancreas, with a very faint lower band in the kidney, pancreas and testis. No signal was evident in the heart, skeletal muscle and liver. (D) Western blot analysis in various regions of brain. Two 4.1N bands are revealed with the major one migrating at ~ 135 kDa expressed in olfactory, cerebrum and hypothalamus, whereas the larger splice form of 4.1N showed low abundance in cerebellum. Both bands are absent in 4.1N−/− extract. For (C) and (D), GAPDH was used as control. The full length blots for (C,D) are shown in supplementary Fig S3.
Figure 2
Figure 2
Outward appearance and gross appearance of the reproductive organs of adult mice. 4.1N−/− 8-week-old male (A) and 6-week-old female (B) mice showed obvious growth retardation associated with decreased weight and size compared to 4.1N+/+ littermates. Bar graphs demonstrate that body weight of 4.1N-null mice was reduced compared with wild-type littermates both in males (A) and females (B) at 3–5 weeks (P < 0.001, n = 6) and 6–9 weeks (P < 0.001, n = 10). Macroscopic view of the testis and epididymis at 8 weeks of age from the control 4.1N+/+ littermates and 4.1N−/− mice showed that the male reproductive organs are dramatically smaller in the 4.1N−/− mice (A). Bottom panels are macroscopic views of the ovary and uterus at 20 weeks of age from the control 4.1N+/+ littermates (left) and 4.1N−/− mice showing these organs are much smaller in the 4.1N−/− mice.
Figure 3
Figure 3
Histopathology of reproductive organs in adult 4.1N−/− male mice. HE-stained sections of 4.1N+/+ and 4.1N−/− testis and epididymis (20 ×, upper panels; 40 ×, lower panels). (A) Histology showing number of mature sperm in the lumen and normal leydig cells in the interstitium in 4.1N+/+ testis (arrow), whereas 4.1N−/− testis didn’t present spermatid and leydig cells. (B) Note the abundant sperm in 4.1N+/+ epididymis but not in 4.1N−/− epididymis (arrow). The tissues were from 6-weeks old male mice. Scale bar, 100 µm (upper panel) and 50 µm (lower panel). (C) Quantification of the proportion of sperm and leydig cells in testis and epididymis. Results are expressed as means ± SD. N = 8, *p ≤ 0.05, **p ≤ 0.01, ***P < 0.001.
Figure 4
Figure 4
Histopathology of reproductive organs in adult 4.1N−/− female mice. HE-stained sections of 4.1N+/+ and 4.1N−/− ovary (upper panel: 20 × , Scale bar, 100 µm; lower panel: 40 × , Scale bar, 50 µm) and uterus (upper panel: 10 × , Scale bar, 200 µm; lower panel: 40 ×, Scale bar, 50 µm). (A) A magnified region shows normal antral follicle in wild-type ovary (arrow), but 4.1N−/− ovary shows undeveloped follicles and no corpora lutea was seen in the interstitium. (B) A high degree of atrophy was observed in the endometrium in 4.1N−/− uterus compared with 4.1N+/+ uterus. 20 ×, upper panels; 40 × lower panels. The tissues were from 6-weeks old female mice. (C) Quantification of the proportion of developed follicles and corpora lutea in ovary as well as severity of hypoplasia in the endometrium. Results are expressed as means ± SD. N = 6, *p ≤ 0.05, **p ≤ 0.01, ***P < 0.001.
Figure 5
Figure 5
Serum hormone levels in 4.1N+/+ and 4.1N−/− mice. The FSH levels in 4.1N−/− male mice were lower than in the age-matched wild-type mice (p = 0.0105, A), and LH level showed a modest decreased in 4.1N−/− compared with 4.1N+/+ mice (p = 0.0620, B). The LH value was decreased in the 4.1N−/− female compared to 4.1N+/+ mice (p = 0.0317, D), and there was no significant difference for FSH between the two groups (p = 0.222, C).
Figure 6
Figure 6
Changes in 4.1N−/− pituitary. (A) HE-stained sections showing smaller and less eosin granules in cytoplasm in 4.1N−/− mice pituitary (right100X) compared with 4.1N+/+ (left, 100 ×). (B) Immunohistochemical staining of GH in the pituitary showing that the expression of GH was decreased in 4.1N−/− mice (right, 100 ×) compared with 4.1N+/+ (left, 100 ×). Scale bar, 20 µm. (C) Transmission electron microscopic analysis in the pituitary showing that secretory granules (small dark dots) in cytoplasm of hormone-producing cells were dramatically decreased in 4.1N−/− (right, 8680 ×) compared with wild-type (left, 8680 ×), Scale bar, 2 microns. Quantitative analysis for GH immunoreactivity by IHC (D) and secretory granules by EM (E). Data are shown as means ± SD. N = 12 (6 male, 6 female),*p ≤ 0.05, **p ≤ 0.01, ***P < 0.001.
Figure 7
Figure 7
The expression of GnRH and GHRH in 4.1N+/+ and 41 N−/− mice pituitary by immunohistochemistry. GnRH (A) and GHRH (B) immunostaining showing that the two kinds of hormone are mainly expressed in the pars intermedia of mouse pituitary (arrows). The expression of GnRH and GHRH were found dramatically decreased in 4.1N−/− (right panels, 40 × . Scale bar, 50 µm) compared with 4.1N+/+ pituitary (left panels, 10 × . Scale bar, 200 µm and middle panels, 40 × . Scale bar, 50 µm). Quantification of immunoreactivity is presented as means ± SD. N = 12 (6 male, 6 female), *p ≤ 0.05, **p ≤ 0.01, ***P < 0.001.
Figure 8
Figure 8
The expression of GnRH in 4.1N+/+ and 41 N−/− mice hypothalamus by immunohistochemistry. Immunostaining showing that GnRH-immunoreactive neuronal cell body was present in the hypothalamus region of 4.1N+/+ mice (A, top panel, 40 ×), the same reactivity was found in the corresponding regions of the 4.1N−/− mice (B, top panel, 40 ×). In the 4.1N−/− mice, the axons in the area did not show the expression of GnRH (B, bottom panel, 40 ×), in contrast, 4.1N+/+ littermates showed much more punctate expression of GnRH in the axons (A, bottom panel, arrow, 40 ×). Scale bar, 50 µm. (C) Quantification of GnRH immunoreactivity is presented as means ± SD. N = 12 (6 male, 6 female), *p ≤ 0.05, **p ≤ 0.01, ***P < 0.001.
Figure 9
Figure 9
The distribution and subcellular localization of 4.1N in mouse pituitary by immunohistochemistry and immunogold electron microscopy. The expression of 4.1N was found in the pituitary (A, 10 × . Scale bar, 200 µm), especially in the neurohypophysis (B, 100 ×. Scale bar, 20 µm) and pars intermedia (C, 100 ×. Scale bar, 20 µm), which revealed densely speckled and discrete foci pattern. In the pars distalis, punctate labeling that outlined cell bodies in part of cells was observed (D, 100 ×. Scale bar, 20 µm). Immunogold electron microscopy shows immunogold labeling for 4.1N in the secretory granules of axons of neurohypophysis and pars intermedia and some cells in adenohypophysis (arrow, and see inset), Scale bar, 500 nm. (E). No gold particles were found in a control in which the primary antibody was replaced with nonimmune serum (F).

References

    1. Kim AC, Van Huffel C, Lutchman M, Chishti AH. Radiation hybrid mapping of EPB41L1, a novel protein 4.1 homologue, to human chromosome 20q11.2–q12. Genomics. 1998;49:165–166. doi: 10.1006/geno.1998.5212. - DOI - PubMed
    1. Conboy J, Kan YW, Shohet SB, Mohandas N. Molecular cloning of protein 41, a major structural element of the human erythrocyte membrane skeleton. Proc. Natl. Acad. Sci. USA. 1986;83:9512–9516. doi: 10.1073/pnas.83.24.9512. - DOI - PMC - PubMed
    1. Parra M, et al. Cloning and characterization of 4.1G (EPB41L2), a new member of the skeletal protein 4.1 (EPB41) gene family. Genomics. 1998;49:298–306. doi: 10.1006/geno.1998.5265. - DOI - PubMed
    1. Parra M, et al. Molecular and functional characterization of protein 4.1B, a novel member of the protein 4.1 family with high level, focal expression in brain. J Biol Chem. 2000;275(5):3247–3255. doi: 10.1074/jbc.275.5.3247. - DOI - PubMed
    1. Hoover KB, Bryant PJ. The genetics of the protein 41 family: organizers of the membrane and cytoskeleton. Curr. Opin. Cell Biol. 2000;12:229–234. doi: 10.1016/S0955-0674(99)00080-0. - DOI - PubMed

Publication types

MeSH terms

Substances