. 2020 Nov;52(11):1145-1150.
doi: 10.1038/s41588-020-0707-1. Epub 2020 Oct 12.

Evidence for secondary-variant genetic burden and non-random distribution across biological modules in a recessive ciliopathy

Affiliations

Evidence for secondary-variant genetic burden and non-random distribution across biological modules in a recessive ciliopathy

Maria Kousi et al. Nat Genet. 2020 Nov.

Abstract

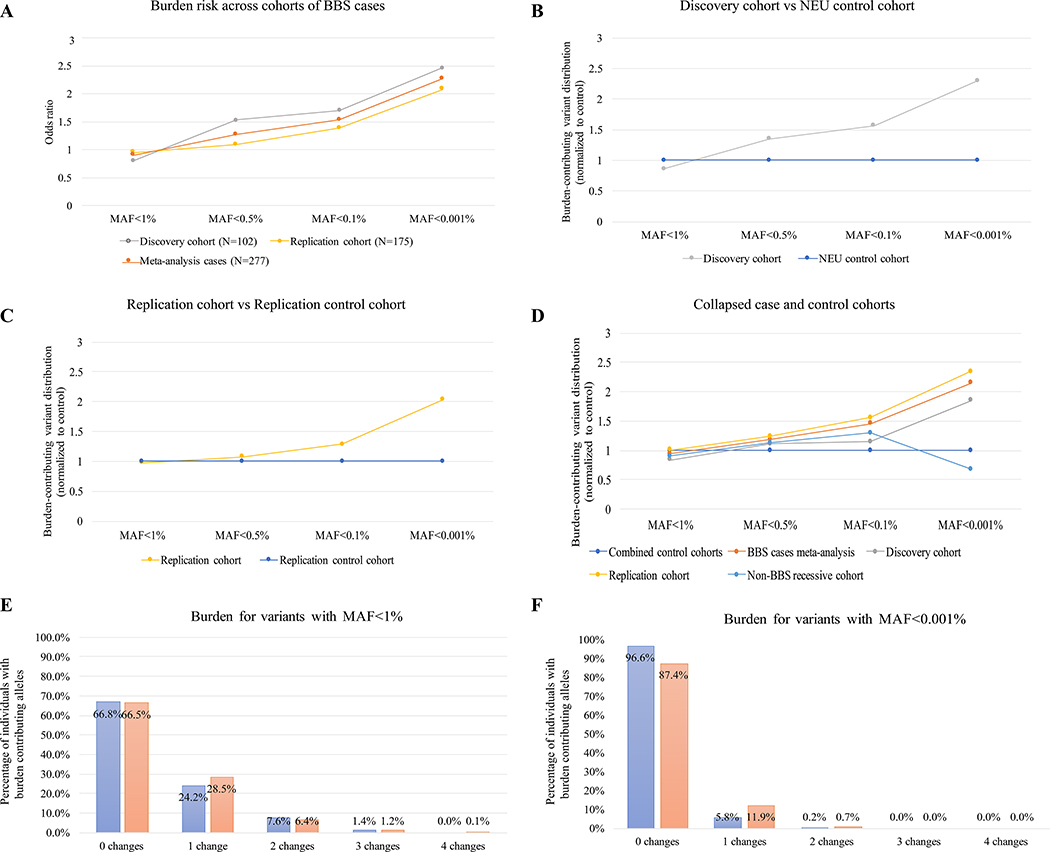
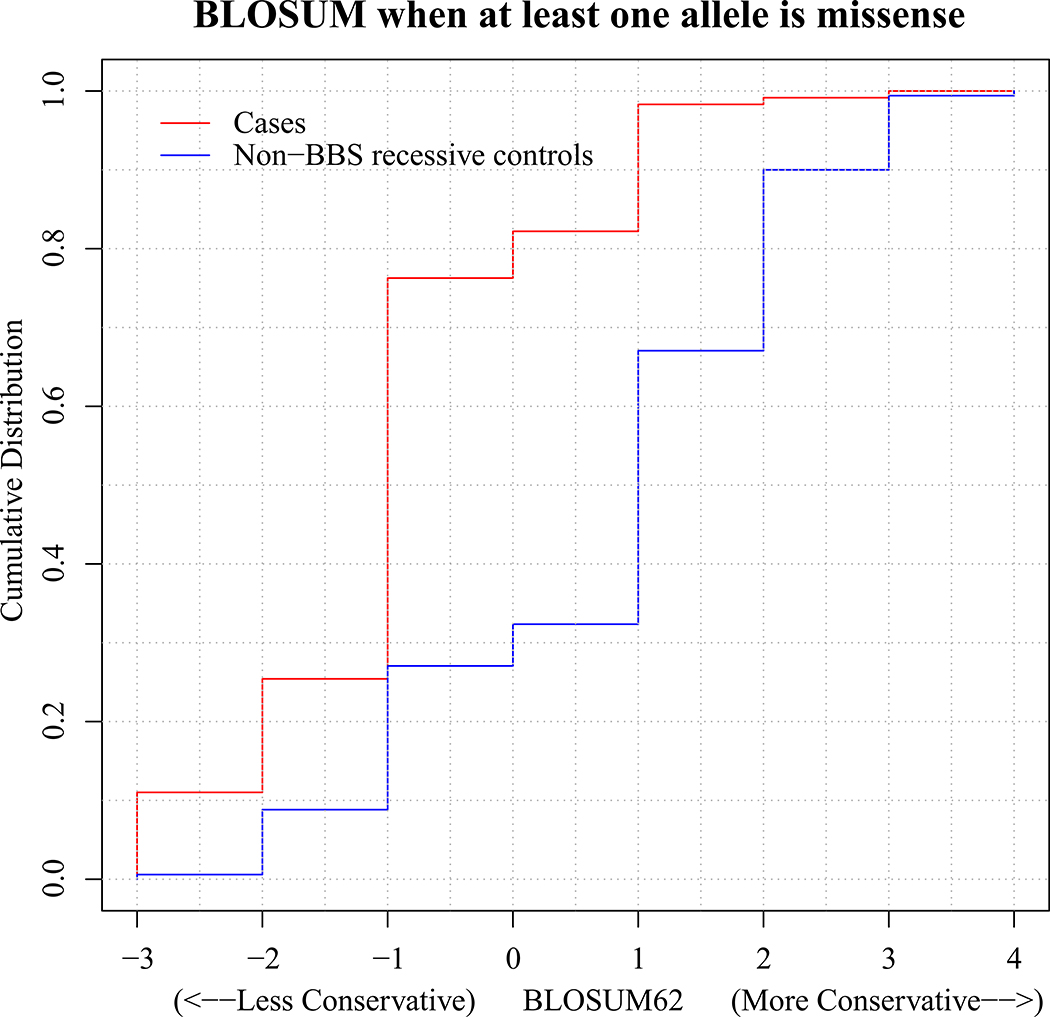
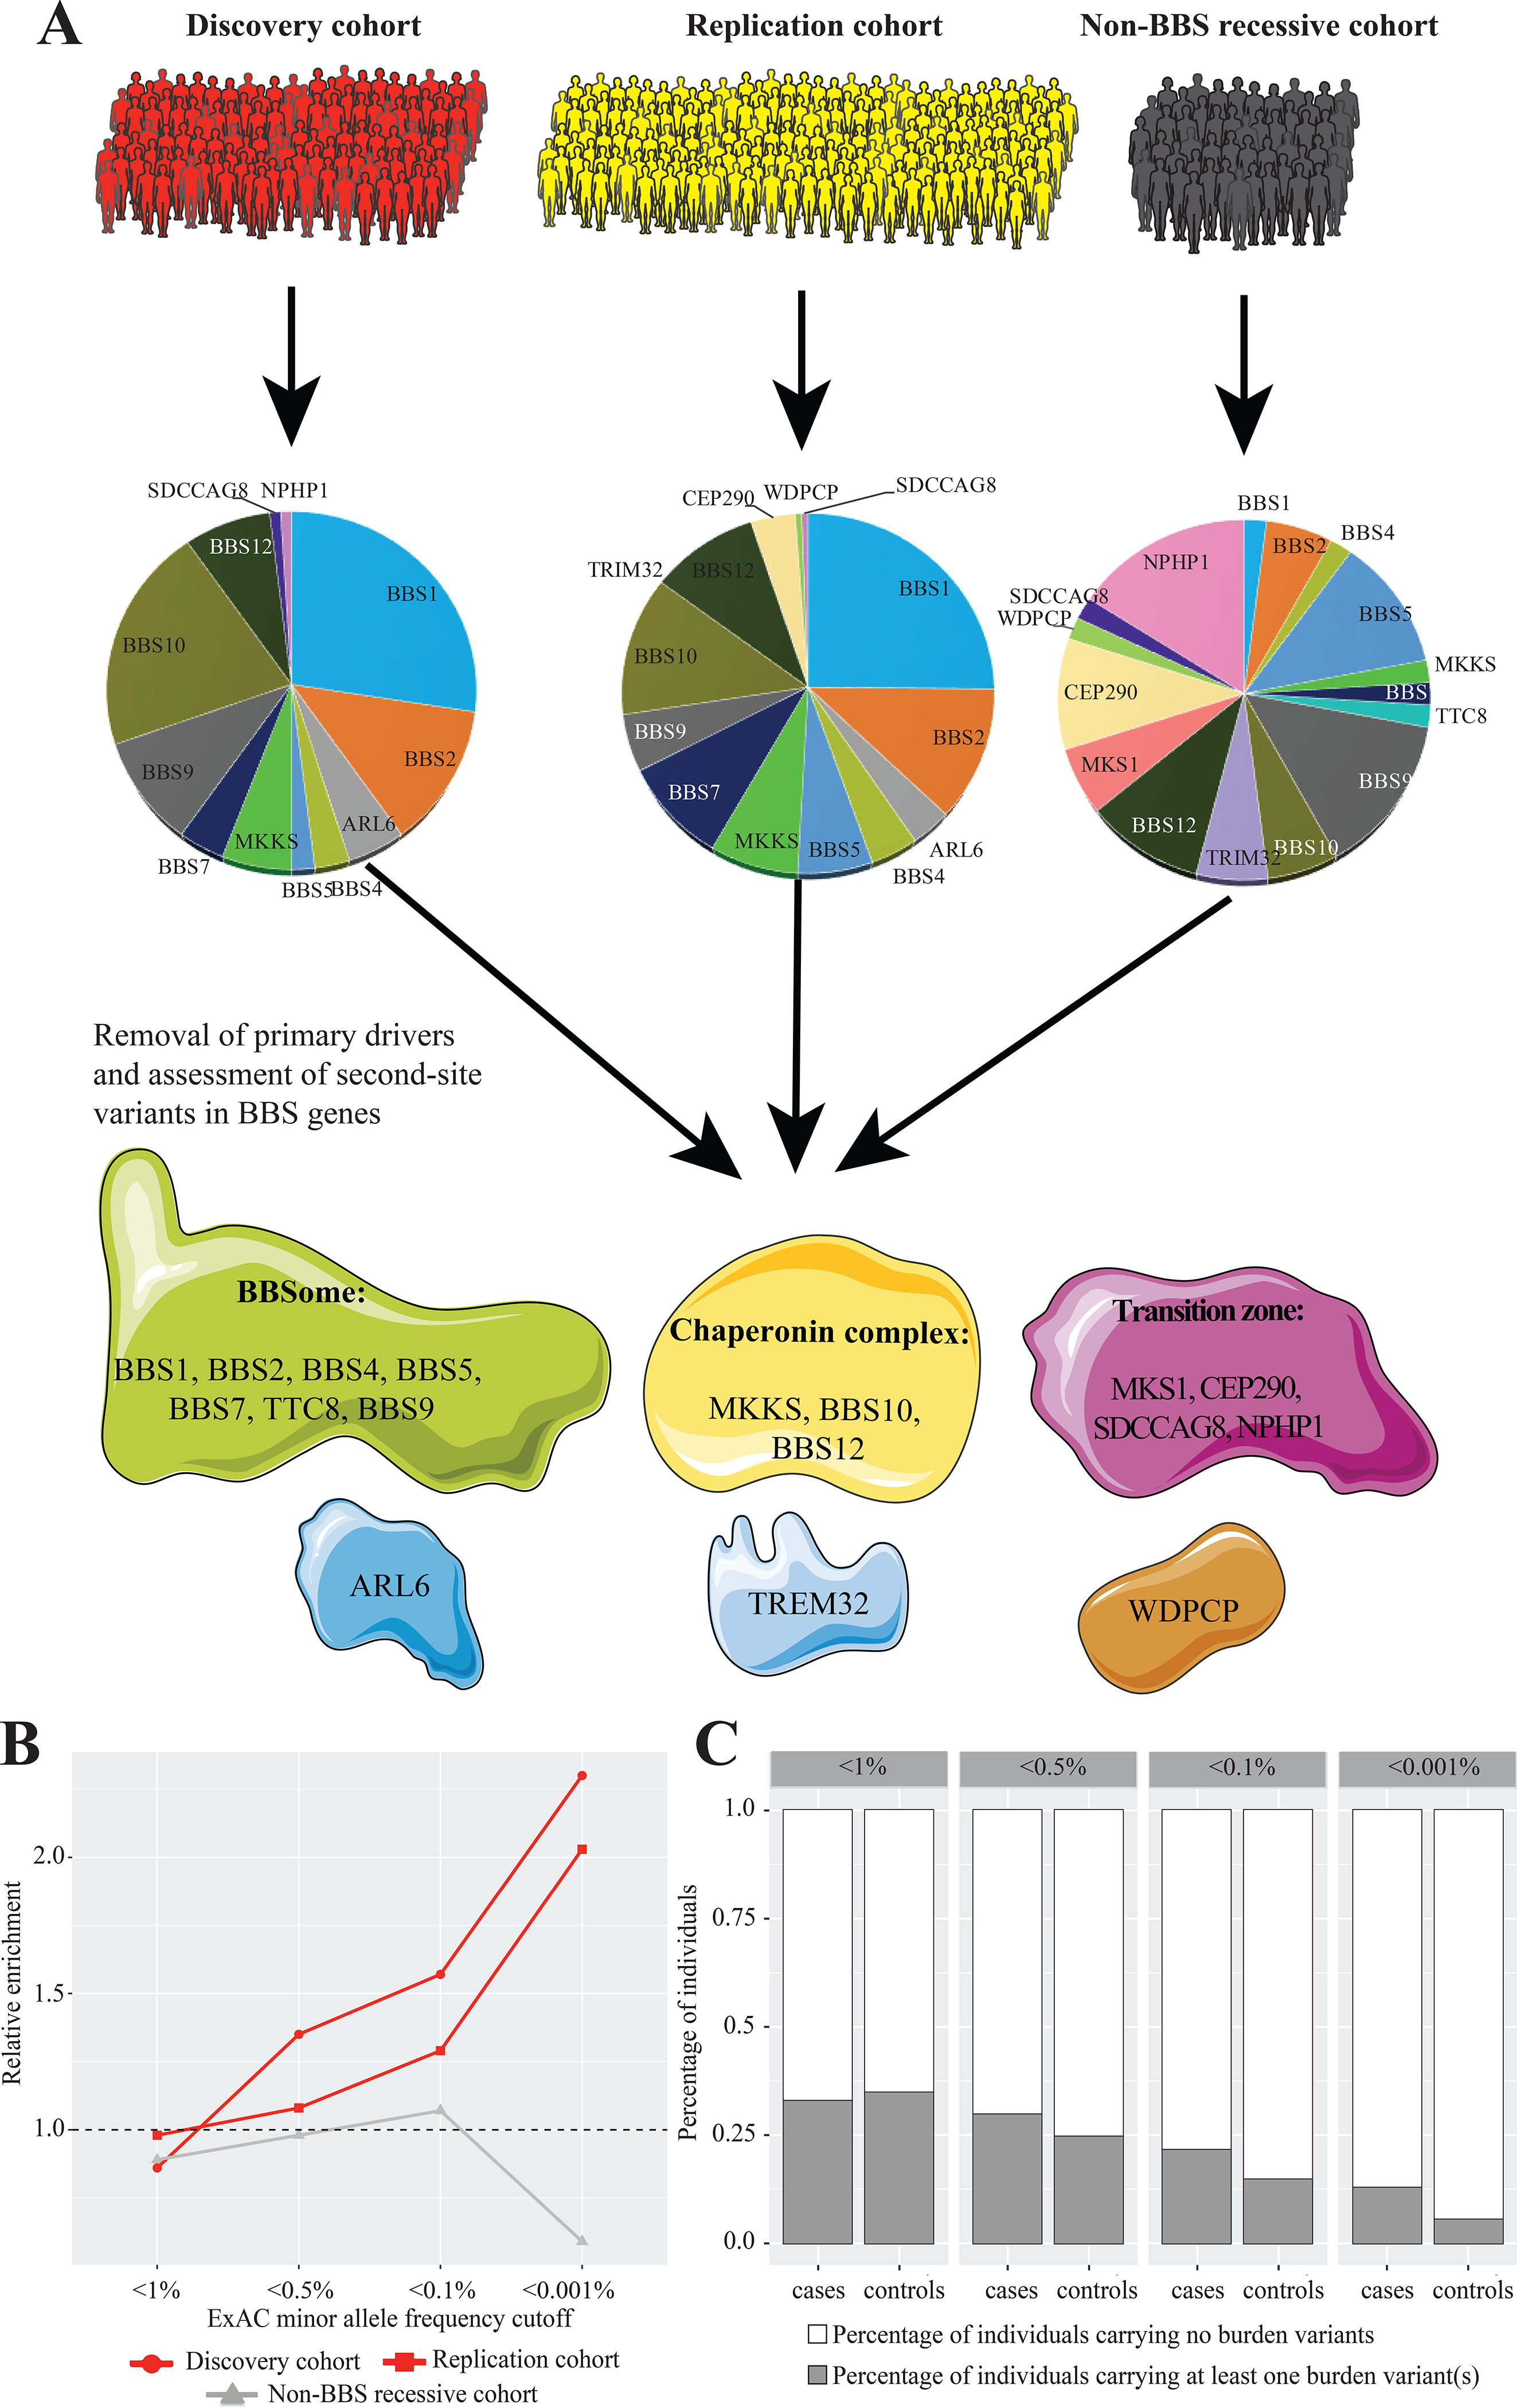
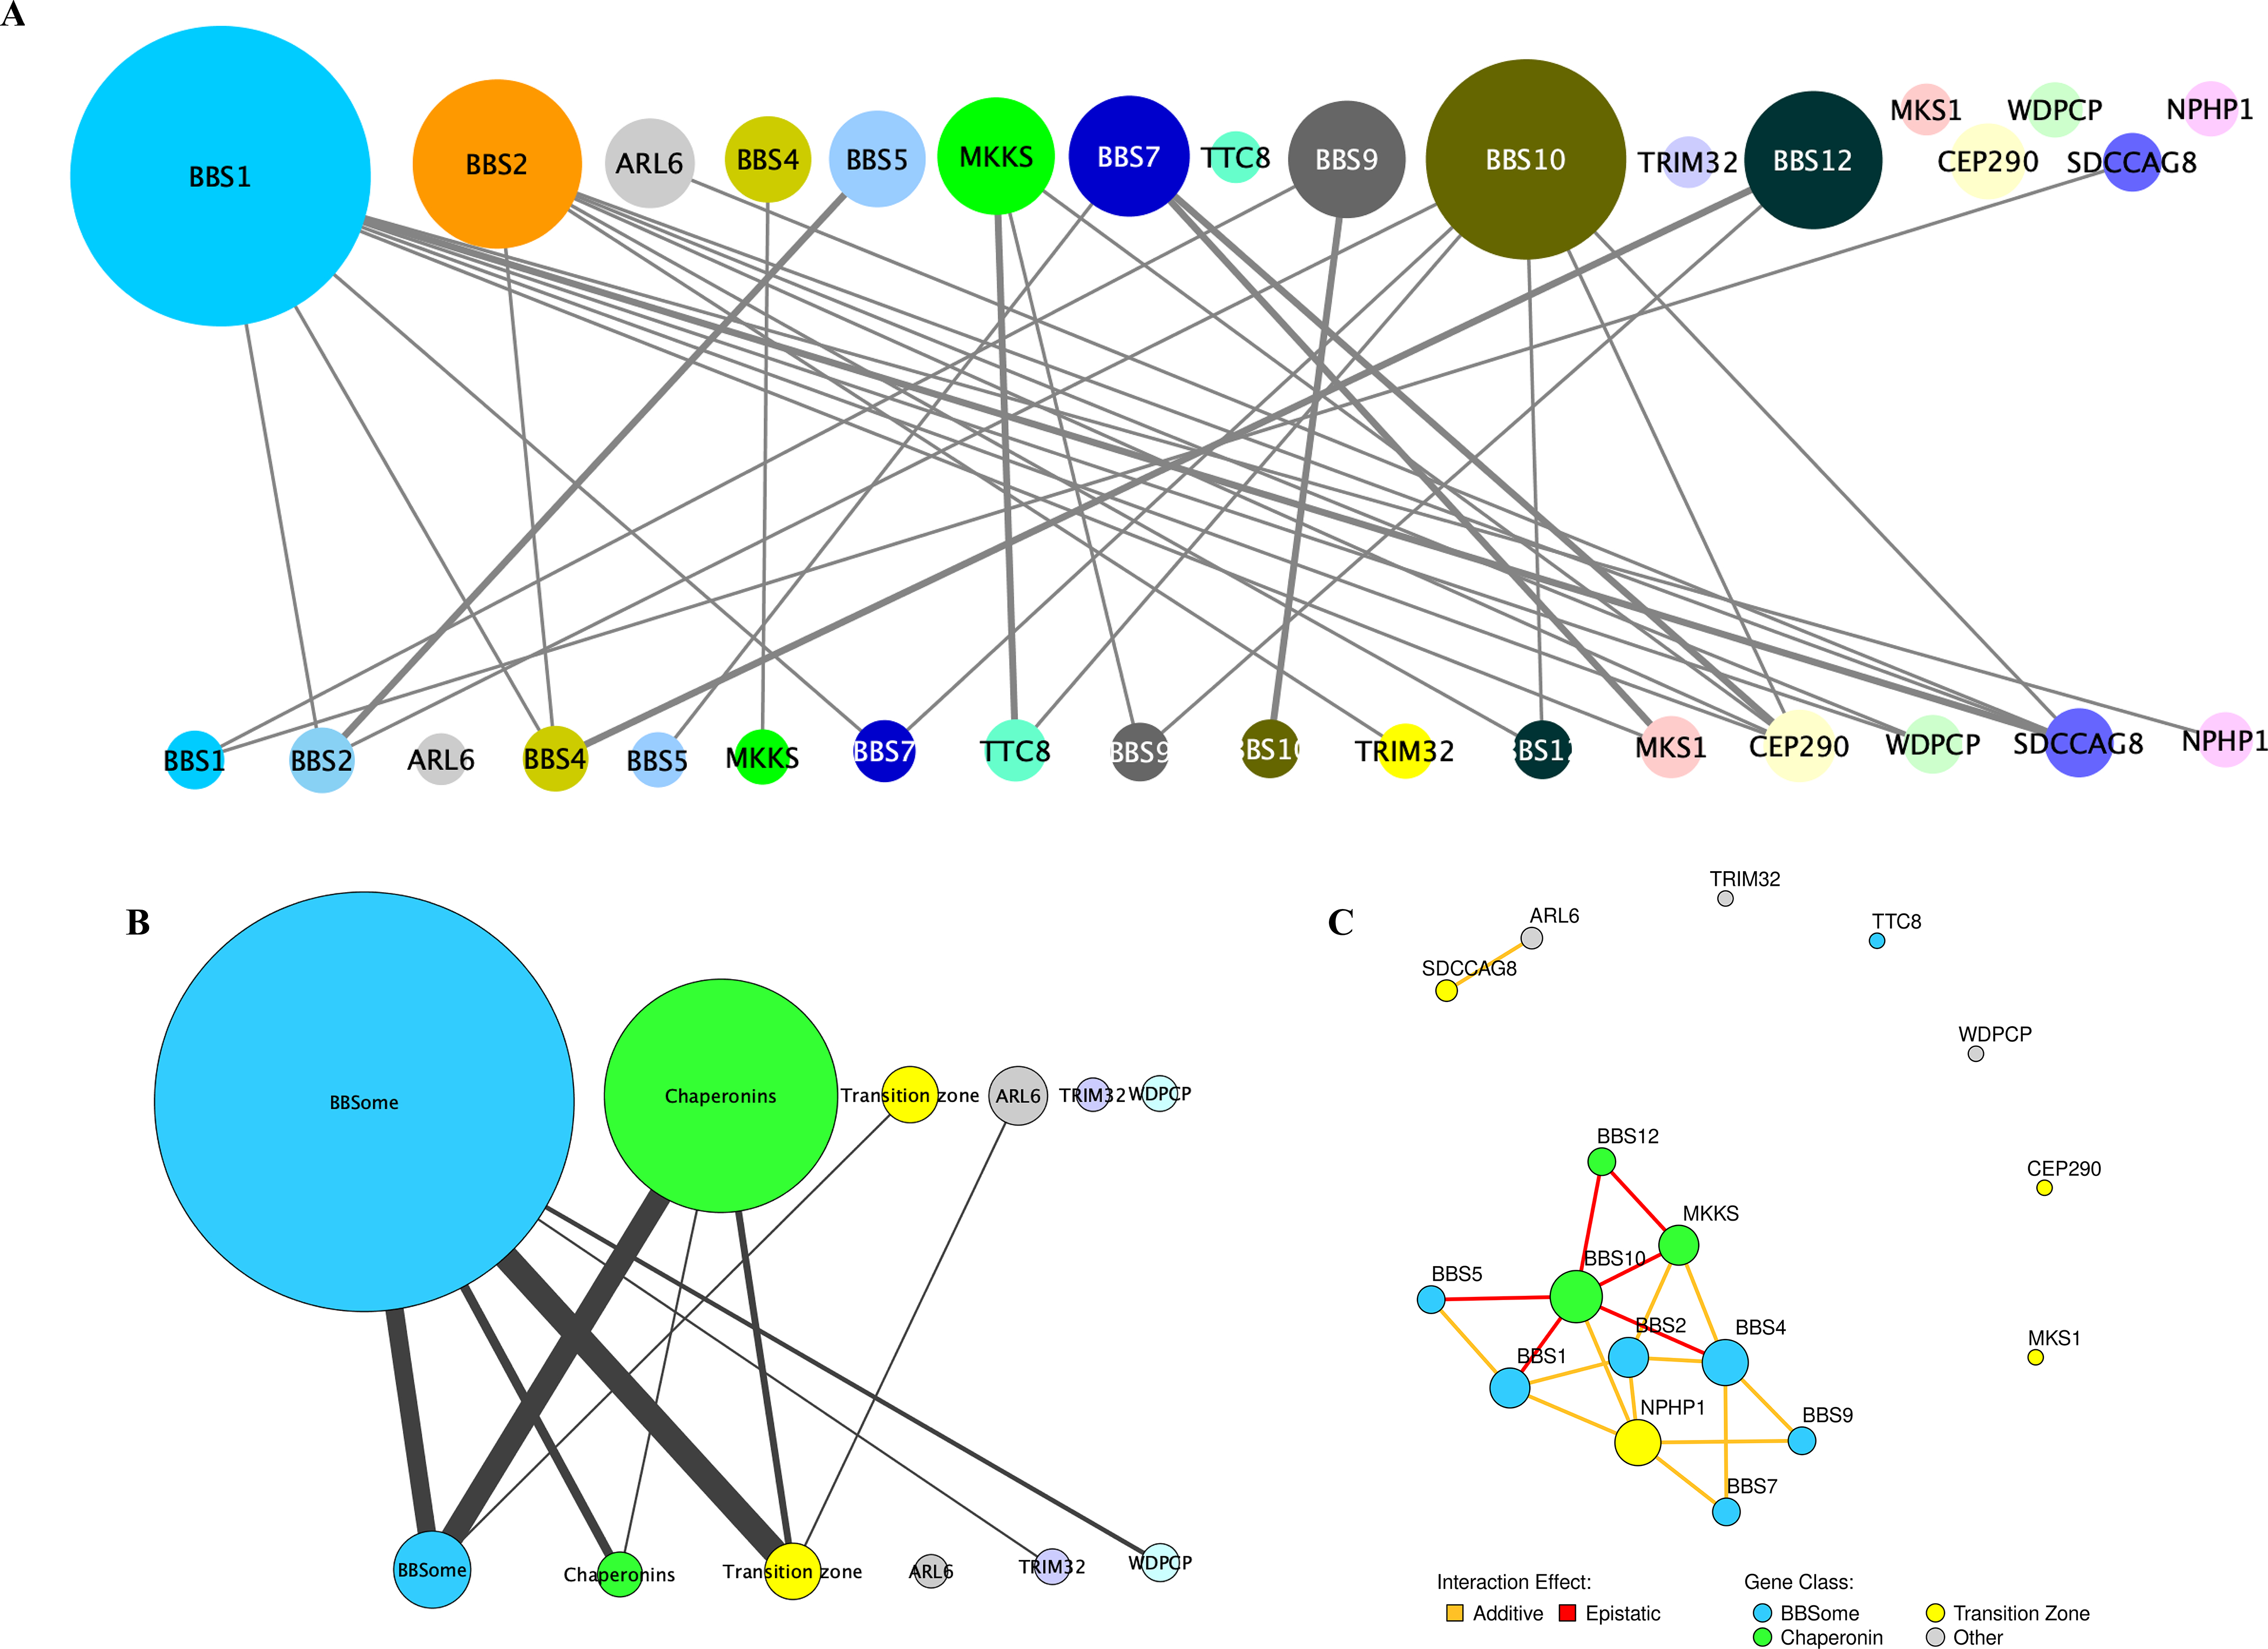
The influence of genetic background on driver mutations is well established; however, the mechanisms by which the background interacts with Mendelian loci remain unclear. We performed a systematic secondary-variant burden analysis of two independent cohorts of patients with Bardet-Biedl syndrome (BBS) with known recessive biallelic pathogenic mutations in one of 17 BBS genes for each individual. We observed a significant enrichment of trans-acting rare nonsynonymous secondary variants in patients with BBS compared with either population controls or a cohort of individuals with a non-BBS diagnosis and recessive variants in the same gene set. Strikingly, we found a significant over-representation of secondary alleles in chaperonin-encoding genes-a finding corroborated by the observation of epistatic interactions involving this complex in vivo. These data indicate a complex genetic architecture for BBS that informs the biological properties of disease modules and presents a model for secondary-variant burden analysis in recessive disorders.


Conflict of interest statement

Competing interests

N.K. is a founder of, and holds significant stock in, Rescindo Therapeutics.

Figures

Extended Data Fig. 1 |
Extended Data Fig. 1 |. Distribution of burden-contributing variation across case and control cohorts.
a, Burden-contributing variants across cases of the Discovery cohort (n= 102), Replication cohort (n= 175), and Meta-analysis of all BBS cases (n= 277) across four population-based minor allele frequency (MAF) cutoffs (1%, 0.5%, 0.1%, and 0.001%). b, Values of burden-contributing variation between BBS cases of the Discovery cohort (n= 102) and the cohort of NEU controls (n= 384) showing a 2.5-fold enrichment for ultra-rare (MAF < 0.001%) alleles in cases compared to controls. c, BBS cases of the Replication cohort (n= 175) and the Replication control cohort (n= 488) showing a 2.5-fold enrichment for ultra-rare (MAF < 0.001%) alleles in cases compared to controls. d, Collapsed case, control and “non-BBS recessive” cohorts. e, f, Distribution of individuals with burden-contributing alleles with MAF < 1% (e) and with MAF < 0.001% (f) in control individuals (blue bars) and BBS cases (orange bars).
Extended Data Fig. 2 |
Extended Data Fig. 2 |. Distribution of burden-contributing variation across case and control cohorts in each of four discrete MAF bins.
a, The Discovery case cohort shows a 2.5-fold enrichment for ultra-rare (0.001% > MAF > 0%) alleles compared to controls. b, The Replication cohort shows a 2-fold enrichment of such alleles compared to the exome control cohort. c, The BBS case meta-analysis shows a 2.2-fold enrichment compared to the combined control cohorts. d, Collapsed cohorts. a–d show plots across four MAF bins (1% > MAF > 0.5%, 0.5% > MAF > 0.1%, 0.1% > MAF > 0.001%, and 0.001% > MAF > 0%).
Extended Data Fig. 3 |
Extended Data Fig. 3 |. Estimate of protein impact for the least disruptive of the diagnostic variants for BBS cases and non-BBS recessive individuals, with at least one missense change in the primary locus.
With high BLOSUM62 scores denoting biochemically similar amino acid changes and lower scores marking radical amino acid changes, the graph shows evidence for bona fide BBS cases harboring more disruptive variants.
Fig. 1 |
Fig. 1 |. Graphical outline of the study and mutational burden across cases and controls.
a, Distribution of primary drivers underlying BBS in the cases within the discovery and replication cohorts and across the 50 individuals with recessive BBS mutations but no BBS-compatible diagnosis. b, Mutational burden across the BBS proteins following removal of the primary locus identified for each patient. The graph shows 2.3-fold and twofold enrichment for the discovery and replication cohorts (red lines), respectively, for ultra-rare alleles (MAF < 0.001%). In contrast, the non-BBS cohort (gray line) is depleted for the same alleles. The burden for each cohort has been normalized to the control, which is represented by a dashed horizontal line. c, Distribution of individuals with burden-contributing alleles across the four MAF bins (1, 0.5, 0.1 and 0.001%), showing progressive enrichment for burden alleles in cases versus controls in the rarer allele categories.
Fig. 2 |
Fig. 2 |. Genetic and modular interactions in BBS cases and controls.
a, In the meta-analysis of BBS cases, BBS1, BBS2, BBS10 and BBS12 harbored recessive driver alleles most frequently (top), but there was an even distribution of burden-contributing alleles (bottom) across the 17 BBS loci. b, Analysis of modules within the BBS proteome (the BBSome (BBS1, BBS2, BBS4, BBS5, BBS7, TTC8 and BBS9); chaperonin complex (MKKS, BBS10 and BBS12); and transition zone (MKS1, CEP290, SDCCAG8 and NPHP1) and three genes that belonged to no yet-defined module (ARL6, TRIM32 and WDPCP)) revealed that the components of the chaperonin complex were driving the majority of modular interactions in BBS. c, Schematic showing the functional outcome (epistatic versus additive) upon suppression of select modular interactions using an in vivo zebrafish system. Epistatic interactions among loci are shown in red and additive genetic interactions are shown in yellow. The gene nodes are color coded according to the functional module they belong to. In each panel, the primary loci are represented as circles in the top half and the loci contributing to mutational load are represented as circles in the bottom half. The size of the circles corresponds to the number of individuals carrying changes in the primary and burden-contributing loci, respectively, and the thickness of the lines connecting primary and burden-contributing loci corresponds to the frequency at which a genetic interaction is observed, with thicker lines representing more common interactions.

Comment in

References

    1. Skafdas E et al. Predicting the diagnosis of autism spectrum disorder using gene pathway analysis. Mol. Psychiatry 19, 504–510 (2014). - PMC - PubMed
    1. Beales PL et al. Genetic interaction of BBS1 mutations with alleles at other BBS loci can result in non-Mendelian Bardet–Biedl syndrome. Am. J. Hum. Genet 72, 1187–1199 (2003). - PMC - PubMed
    1. Katsanis N et al. Triallelic inheritance in Bardet–Biedl syndrome, a Mendelian recessive disorder. Science 293, 2256–2259 (2001). - PubMed
    1. Badano JL et al. Dissection of epistasis in oligogenic Bardet–Biedl syndrome. Nature 439, 326–330 (2006). - PubMed
    1. Cardenas-Rodriguez M et al. The Bardet–Biedl syndrome-related protein CCDC28B modulates mTORC2 function and interacts with SIN1 to control cilia length independently of the mTOR complex. Hum. Mol. Genet 22, 4031–4042 (2013). - PMC - PubMed

Publication types