. 2021 May;5(5):399-413.
doi: 10.1038/s41551-020-00625-5. Epub 2020 Oct 12.

CAR-T cells targeting a nucleophosmin neoepitope exhibit potent specific activity in mouse models of acute myeloid leukaemia

Affiliations

CAR-T cells targeting a nucleophosmin neoepitope exhibit potent specific activity in mouse models of acute myeloid leukaemia

Guozhu Xie et al. Nat Biomed Eng. 2021 May.

Erratum in

Abstract

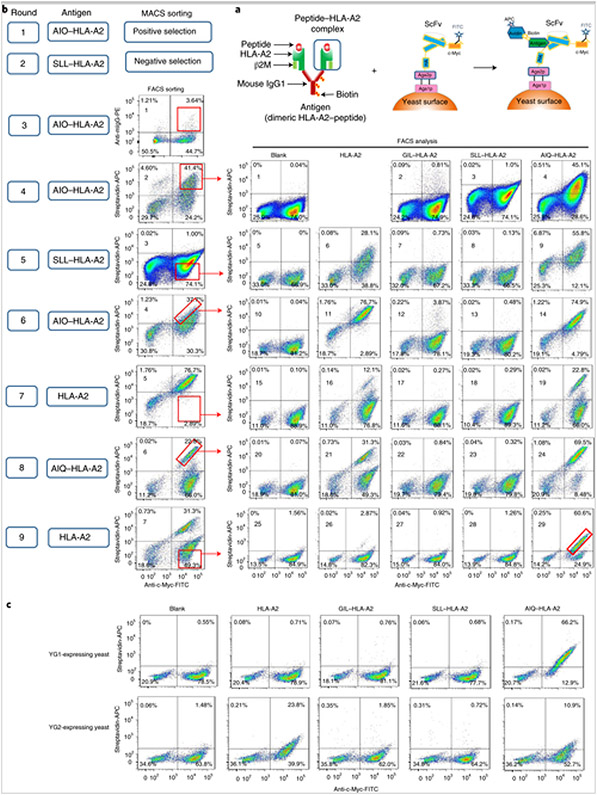
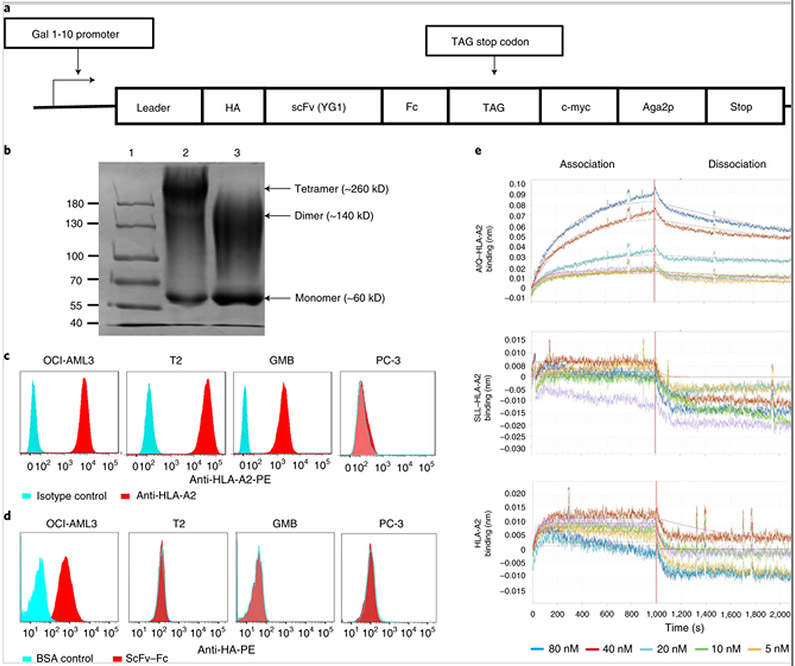
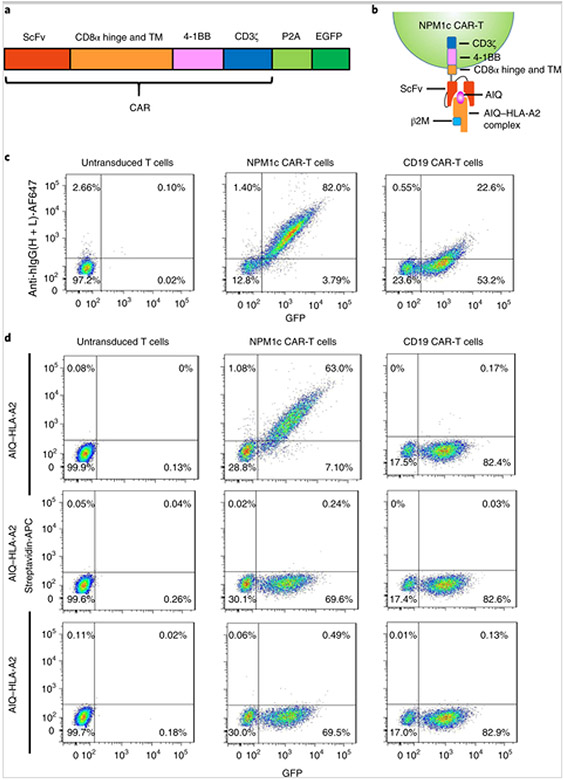
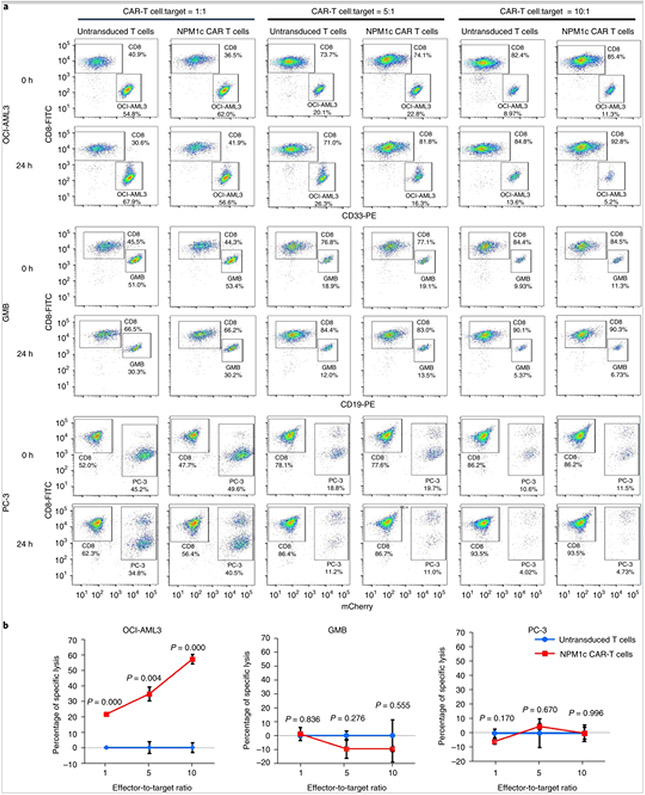
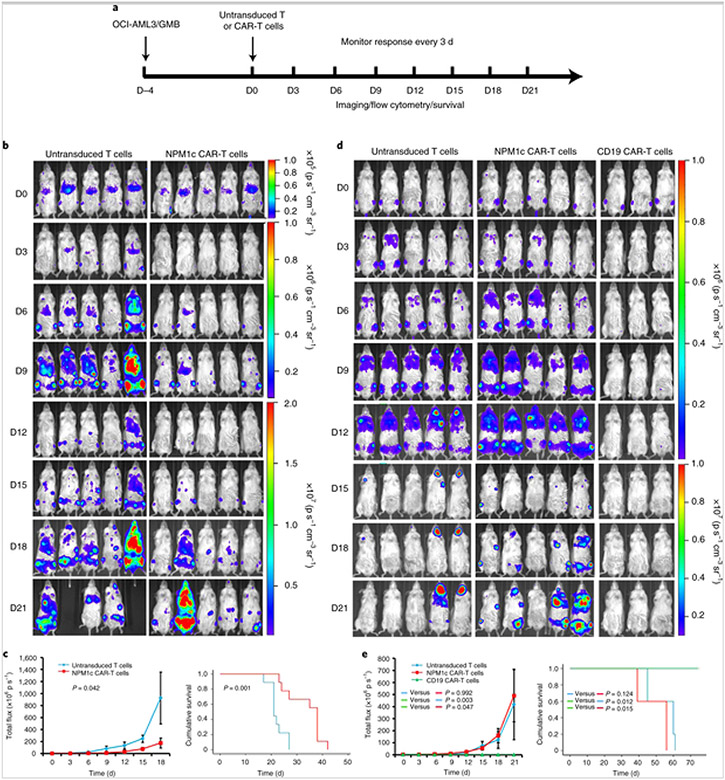
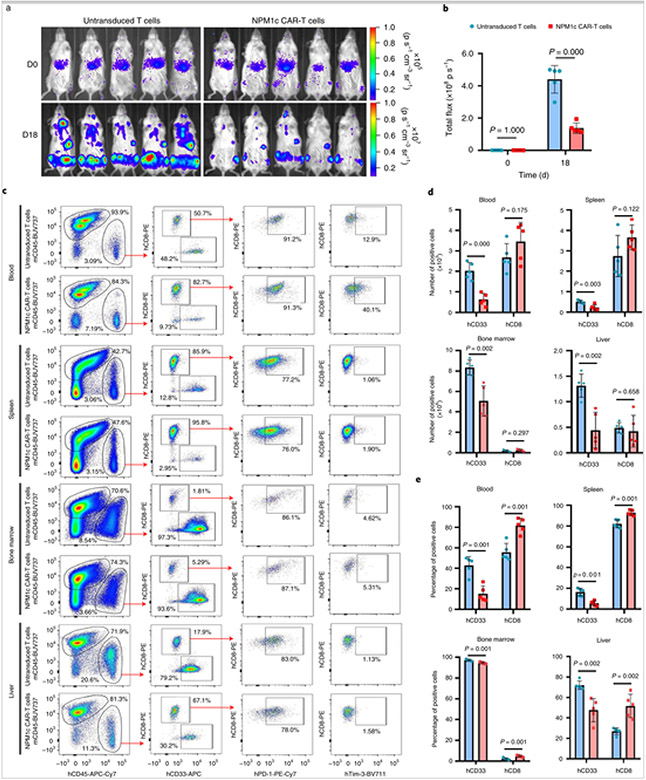
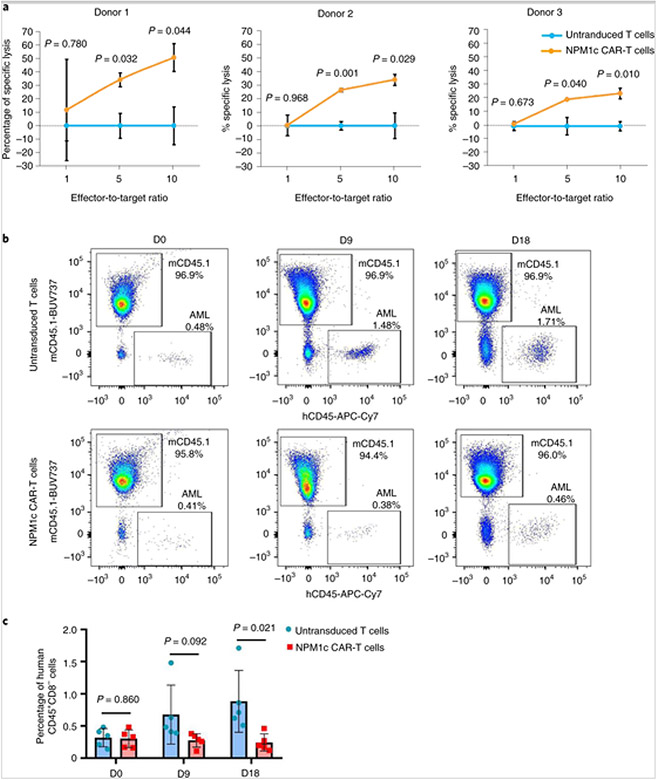
Therapies employing chimeric antigen receptor T cells (CAR-T cells) targeting tumour-associated antigens (TAAs) can lead to on-target-off-tumour toxicity and to resistance, owing to TAA expression in normal tissues and to TAA expression loss in tumour cells. These drawbacks can be circumvented by CAR-T cells targeting tumour-specific driver gene mutations, such as the four-nucleotide duplication in the oncogene nucleophosmin (NPM1c), which creates a neoepitope presented by the human leukocyte antigen with the A2 serotype (HLA-A2) that has been observed in about 35% of patients with acute myeloid leukaemia (AML). Here, we report a human single-chain variable fragment (scFv), identified via yeast surface display, that specifically binds to the NPM1c epitope-HLA-A2 complex but not to HLA-A2 or to HLA-A2 loaded with control peptides. In vitro and in mice, CAR-T cells with the scFv exhibit potent cytotoxicity against NPM1c+HLA-A2+ leukaemia cells and primary AML blasts, but not NPM1c-HLA-A2+ leukaemia cells or HLA-A2- tumour cells. Therapies using NPM1c CAR-T cells for the treatment of NPM1c+HLA-A2+ AML may limit on-target-off-tumour toxicity and tumour resistance.


Conflict of interest statement

Competing interests The authors have filed a provisional patent application on the identified scFv and its applications.

Figures

Fig. 1
Fig. 1. Isolation of human scFv specific for the AIQ–HLA-A2 complex by yeast surface display.
a, Schematics of the peptide–HLA-A2 complex (left), scFv displayed on the yeast surface (middle) and binding of the peptide–HLA-A2 complex to scFv on the yeast cell surface (right). HA, haemagglutinin. b, Strategies and steps used to isolate yeast cells displaying scFvs that specifically recognize the AIQ–HLA-A2 complex. The round of selection is indicated on the left. ‘Antigen’ indicates peptide–HLA-A2 complexes or HLA-A2 alone used in positive or negative selection. In the first two rounds of selection, yeast cells were selected by MACS. In the remaining rounds of selection, yeast cells were sorted by flow cytometry (FACS sorting) based on staining with FITC-labelled anti-c-Myc antibody plus phycoerythrin-labelled anti-mouse IgG or APC-labelled streptavidin. The gates for sorted cells are indicated. Sorted yeast cells from rounds 4–9 were expanded, stained with biotin-labelled HLA-A2, GIL–HLA-A2, SLL–HLA-A2 or AIQ–HLA-A2, followed by FITC-labelled anti-c-Myc antibody and APC-labelled streptavidin, and then analysed by flow cytometry (FACS analysis) gating on live cells (DAPI). The FACS sorting plots are labelled from 1–7 and the FACS analysis plots are labelled from 1–29. c, Yeast cells expressing either YG1 or YG2 clones were stained and analysed as in b. The percentages in b and c indicate the percentages of cells in the gated regions. Diagrams adapted with permission from ref. [19], Springer Nature Ltd.
Fig. 2
Fig. 2. Specific and high-affinity binding of YG1 scFv–Fc to the AIQ–HLA-A2 complex on AML cells.
a, Schematic of the switchable yeast display/secretion vector for expressing the scFv–Fc fusion protein. In this switchable system, scFv–Fc can be secreted or displayed on the yeast cells depending on whether or not OmeY is added to the culture[20]. b, SDS-PAGE analysis of purified scFv–Fc proteins (lane 1: protein ladder; lane 2: non-reduced scFv–Fc protein (1 μg); lane 3: reduced scFv–Fc protein (1 μg)). Gel was stained using Coomassie Blue. Shown are the representative data from three separate experiments. The image of the full scan (with the boundaries of the crops outlined) is provided in the Supplementary Information. c, Flow cytometry analysis of HLA-A2 expression by OCI-AML3, T2, GMB and PC-3 cells. Red histograms show staining with anti-HLA-A2, whereas cyan histograms show staining with isotype control antibody. Representative data from technical triplicates are shown. d, Flow cytometry analysis of AIQ–HLA-A2 expression by OCI-AML3, T2, GMB and PC-3 cells. Red histograms show staining with YG1 scFv–Fc and anti-haemagglutinin, whereas cyan histograms show staining with BSA followed by anti-haemagglutinin. Representative data from three separate experiments with technical triplicates are shown. e, Kinetic analysis of the interactions between scFv–Fc and AIQ–HLA-A2, SLL–HLA-A2 or HLA-A2 by biolayer interferometry. The streptavidin biosensor tips of the FortéBio Octet RED96 instrument were coated with biotinylated scFv–Fc protein. The tips were dipped in increasing concentrations (indicated at the bottom of binding curve) of AIQ–HLA-A2, SLL–HLA-A2 or HLA-A2 to measure their binding to scFv–Fc (association) and subsequently moved to wells containing buffer to measure the dissociation rate (dissociation). Shown are representative data from three separate experiments.
Fig. 3
Fig. 3. Generation of NPM1c CAR-T cells specific to the AIQ–HLA-A2 complex.
a, Schematic of the CAR vector consisting of scFv (YG1 or CD19), the CD8α extracellular hinge and transmembrane domain (TM), the 4-1BB co-stimulatory domain and the CD3ζ activation domain, followed by self-cleavage P2A and EGFP. b, Schematic of the recognition of NPM1c CAR-T cells by the soluble AIQ–HLA-A2 complex. c, Flow cytometry analysis of CAR expression by untransduced and transduced T cells. Transduced T cells were enriched by sorting for GFP+ cells, expanded and stained with AF647-labelled antibody specific for human IgG heavy and light chains. Untransduced T cells were activated and expanded without sorting. Shown are the GFP versus anti-human IgG staining profiles of live cells (DAPI). d, NPM1c CAR-T cells recognize the AIQ–HLA-A2 complex. Untransduced and transduced T cells were incubated with biotinylated AIQ–HLA-A2, SLL–HLA-A2 or HLA-A2, followed by streptavidin-APC staining. Shown are the GFP versus streptavidin-APC staining profiles of live (DAPI) untransduced T cells, NPM1c CAR-T cells and CD19 CAR-T cells. The data in c and d are representative of three separate experiments. The percentages indicate the percentages of cells in the gated regions.
Fig. 4
Fig. 4. NPM1c CAR-T cells specifically kill HLA-A2+NPM1c+ AML cells in vitro.
a,b, NPM1c CAR-T cells were co-cultured with OCI-AML3, GMB and PC-3 tumour cells at the indicated effector-to-target ratios for 24 h. The cell mixtures were stained for CD8 plus CD33, CD19 or mCherry, followed by flow cytometry. The percentages of CAR-T cells were quantified by CD8 staining and the percentages of OCI-AML3, GMB and PC-3 cells were quantified by CD33, CD19 and mCherry, respectively. The percentages of specific lysis of tumour cells were calculated (see Methods for the formula). Shown are examples of CD8 versus CD33, CD19 or mCherry staining profiles (a) and the percentages of specific lysis (b) at different effector-to-target ratios. The percentages of cells in the gated regions are indicated. In a, the plots are representative of three separate experiments. The graphs in b were created using Microsoft Office 2016. The P values (two-sided independent-samples t-test) indicate comparison between NPM1c CAR-T cells and untransduced T cells at the same effector-to-target ratio (n = 3 biologically independent samples; data points and error bars represent means ± s.e.).
Fig. 5
Fig. 5. NPM1c CAR-T cell therapy reduces leukaemia burden and prolongs survival.
a, Schematic of the experimental process. NSG mice were injected with OCI-AML3 cells (1 × 10⁶) or GMB cells (2 × 10⁶) intravenously (D–4) and imaged for engraftment 4 d later (D0). Mice were then injected intravenously with 1 × 10⁷ NPM1c CAR-T cells, untransduced T cells or CD19 CAR-T cells. The mice were monitored by BLI every 3 d to assess tumour burden and survival. b, Comparison of the OCI-AML3 leukaemia burden by BLI between mice treated with NPM1c CAR-T cells and untransduced T cells at the indicated days (D0–D21) post-T cell injection (n = 5). The scales for imaging are shown to the right. The experiment was repeated twice, with four and five mice per group. c, Comparison of the total flux (luciferase signals from systemic OCI-AML3 leukaemia cells) in the mice (n = 5) from b (left), and Kaplan–Meier survival curves (right; n = 9) of mice treated with either NPM1c CAR-T cells or untransduced T cells. d, Comparison of GMB lymphoma burden by BLI between mice treated with NPM1c CAR-T cells (n = 5), untransduced T cells (n = 5) and CD19 CAR-T cells (n = 3) at the indicated days (D0–D21) post-T cell injection. The scales for imaging are shown to the right. The experiment was repeated twice with five mice for the untransduced T cells and NPM1c CAR-T cells groups and three mice for the CD19 CAR-T cells group. e, Comparison of the total flux (luciferase signals from systemic GMB cells; left) and Kaplan–Meier survival curves (right) of mice treated with either NPM1c CAR-T cells (n = 5), untransduced T cells (n = 5) or CD19 CAR-T cells (n = 3). The graphs for total flux were created using Microsoft Office 2016 and the survival curve graphs were created using SPSS Statistics 22 software. Data points and error bars represent means ± s.e. P values (two-way repeated-measures analysis of variance for total flux and two-sided Mantel–Cox log-rank test for survival comparison) are indicated. Note that in b different scales are used for day 0, days 3–9 and days 12–21, and in d different scales are used for days 0–12 and days 15–21, for better comparison among the mice at different days post-treatment.
Fig. 6
Fig. 6. NPM1c CAR-T cells reduce the leukaemia burden in blood, spleen, bone marrow and liver.
a,b, NSG mice were injected with OCI-AML3 AML cells and then either untransduced T cells or NPM1c CAR-T cells, as in Fig. 5a. Mice (n = 5) were imaged on the day of T cell injection (day 0) and 18 d later. Shown are BLI images (a) and total flux (b). c, Representative flow cytometry plots showing the gating strategy and expression profiles. Blood, spleen, bone marrow and liver were harvested on day 18 and single-cell suspensions were prepared and stained for mCD45, hCD45, CD8, CD33, PD-1 and Tim-3, followed by flow cytometry. Shown are representative staining profiles and gating strategies, including: mCD45 versus hCD45 gating on live cells (DAPI); hCD33 versus hCD8 gating on hCD45+ cells; human PD-1 versus hCD8 gating on hCD8+ cells; and human Tim-3 versus hCD8 gating on hCD8+ cells. The numbers indicate the percentages of cells in the gated region. d, Comparison of total numbers of hCD33+ leukaemic cells and hCD8+ T cells in different tissues between mice given NPM1c CAR-T cells and those given untransduced T cells. e, Comparison of percentages of hCD33+ leukaemic cells and hCD8+ T cells among hCD45+ cells in different tissues between mice given NPM1c CAR-T cells and those given untransduced T cells. The blue bars in b, d and e represent treatment with untransduced T cells, whereas the pink bars represent treatment with CAR-T cells. The graphs were created using GraphPad Prism version 8.00 software. Bars heights and error bars represent means ± s.e. P values (two-sided independent-samples t-test) are indicated in b, d and e (n = 5).
Fig. 7
Fig. 7. NMP1c CAR-T cells effectively kill primary human AML blasts in vitro and in vivo.
a, NPM1c CAR-T cells kill NPM1c+HLA-A2+ primary AML blasts from three donors in vitro. NPM1c CAR-T cells or untransduced T cells were incubated with AML blasts at the indicated ratios for 24 h. The absolute numbers of AML blasts were quantified by staining for CD8 and CD33, followed by flow cytometry with precision count beads. The percentages of specific lysis of tumour cells at different effector-to-target ratios were calculated (see Supplementary Information). The graphs were created using Microsoft Office 2016 (n = 3 biological replicates. b, NPM1c CAR-T cell treatment reduces the leukaemia burden in primary HLA-A2+NPM1c+ AML xenografts. NSGS mice were engrafted with human AML blasts. Two weeks later, when AML blasts were detectable in the blood, mice were given NPM1c CAR-T cells or untransduced T cells. At the indicated days after T cell transfer, mice were bled and mononuclear cells were stained for mCD45, hCD45 and hCD8. Shown are representative hCD45 versus mCD45 staining profiles gating on hCD8 live cells. AML blasts were hCD45+hCD8. The numbers indicate the percentages of cells in the gated regions. c, Comparison of the percentages of hCD45+CD8 AML blasts in the peripheral blood between mice given NPM1c CAR-T cells and those given untransduced T cells before T cell injection (day 0) and 9 and 18 d post-T cell injection (n = 5). The blue bars represent treatment with untransduced T cells, whereas the pink bars represent treatment with NPM1c CAR-T cells. The graphs were created using GraphPad Prism version 8.00 software. In a and c, bar heights and error bars represent means ± s.e. and P values (two-sided independent-samples t-test) are indicated.

References

    1. Coulie PG, Van den Eynde BJ, van der Bruggen P & Boon T Tumour antigens recognized by T lymphocytes: at the core of cancer immunotherapy. Nat. Rev. Cancer 14, 135–146 (2014). - PubMed
    1. Srivastava S & Riddell SR Chimeric antigen receptor T cell therapy challenges to bench-to-bedside efficacy. J. Immunol 200, 459–468 (2018). - PMC - PubMed
    1. Blankenstein T, Leisegang M, Uckert W & Schreiber H Targeting cancer-specific mutations by T cell receptor gene therapy. Curr. Opin. Immunol 33, 112–119 (2015). - PMC - PubMed
    1. Schumacher TN & Schreiber RD Neoantigens in cancer immunotherapy. Science 348, 69–74 (2015). - PubMed
    1. Van der Lee DI et al. Mutated nucleophosmin 1 as immunotherapy target in acute myeloid leukemia. J. Clin. Invest 129, 774–785 (2019). - PMC - PubMed

Publication types

MeSH terms