. 2020 Dec;21(12):1552-1562.
doi: 10.1038/s41590-020-0791-5. Epub 2020 Oct 12.

Two subsets of stem-like CD8+ memory T cell progenitors with distinct fate commitments in humans

Affiliations

Two subsets of stem-like CD8+ memory T cell progenitors with distinct fate commitments in humans

Giovanni Galletti et al. Nat Immunol. 2020 Dec.

Abstract

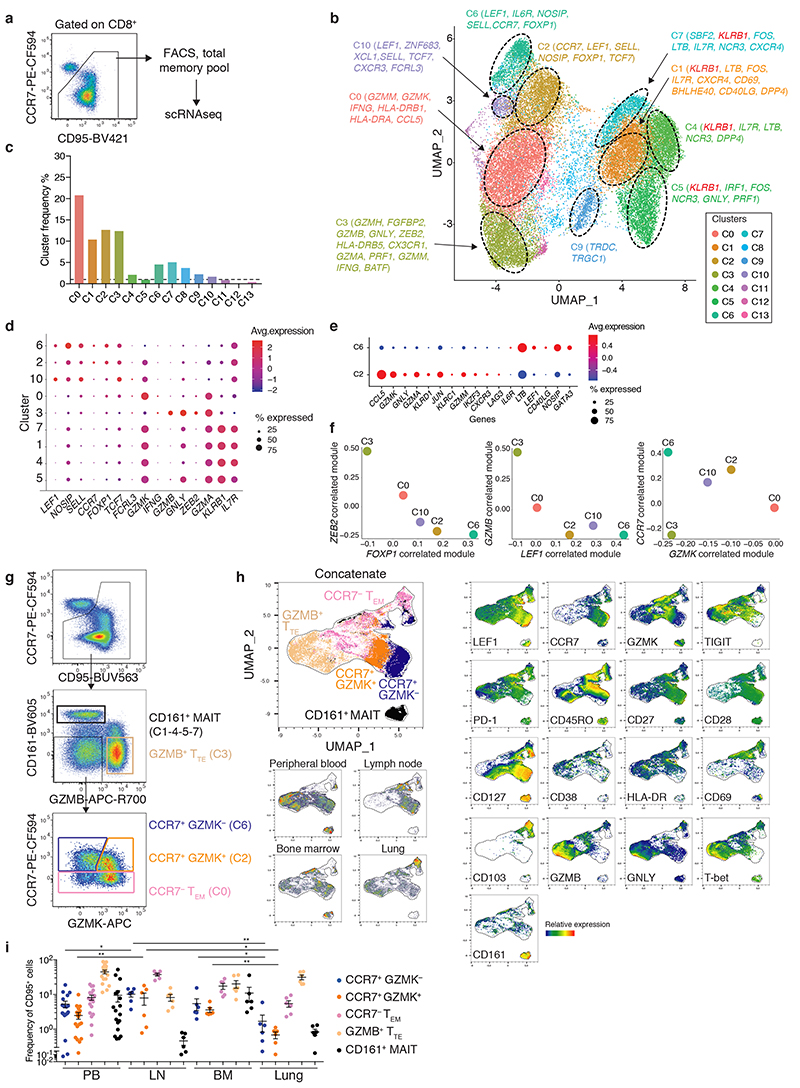
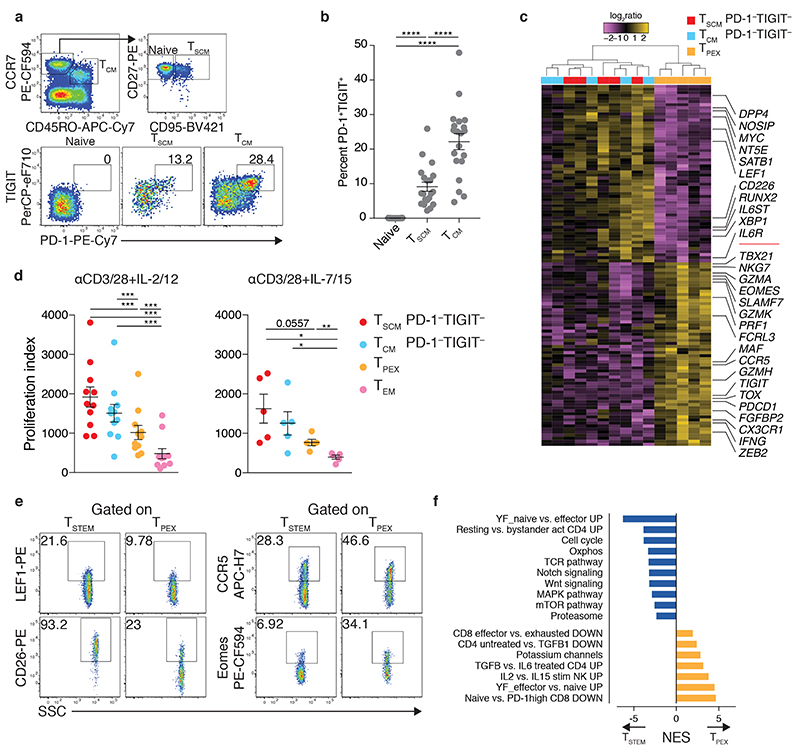
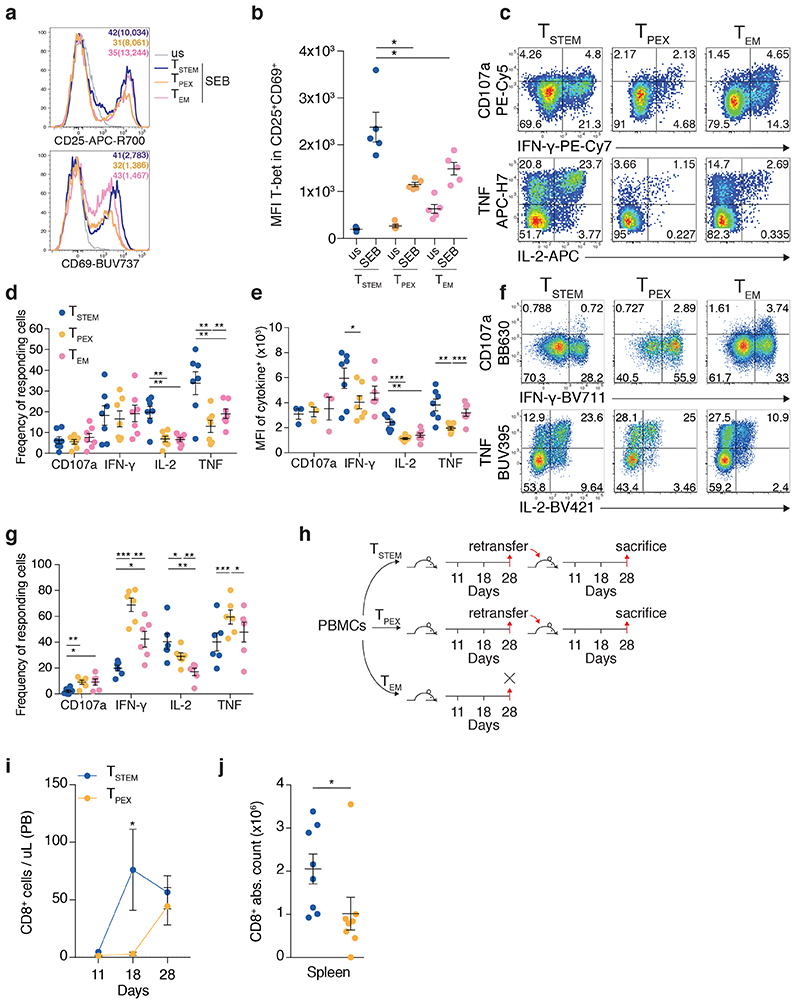
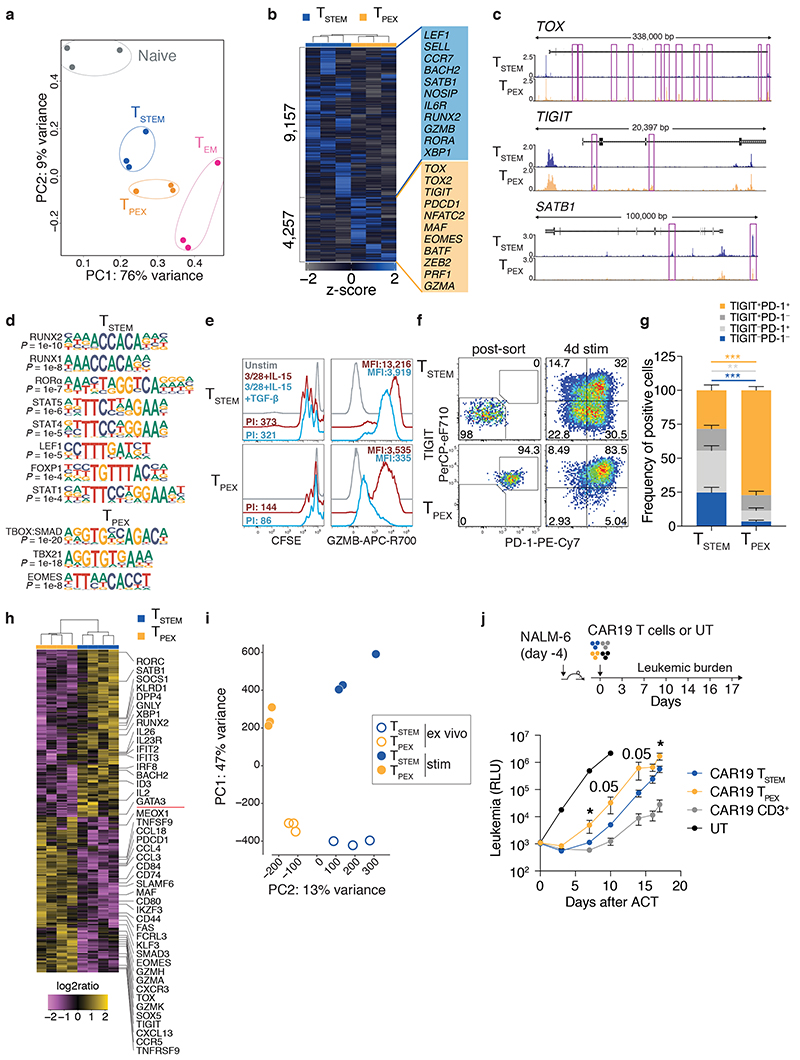
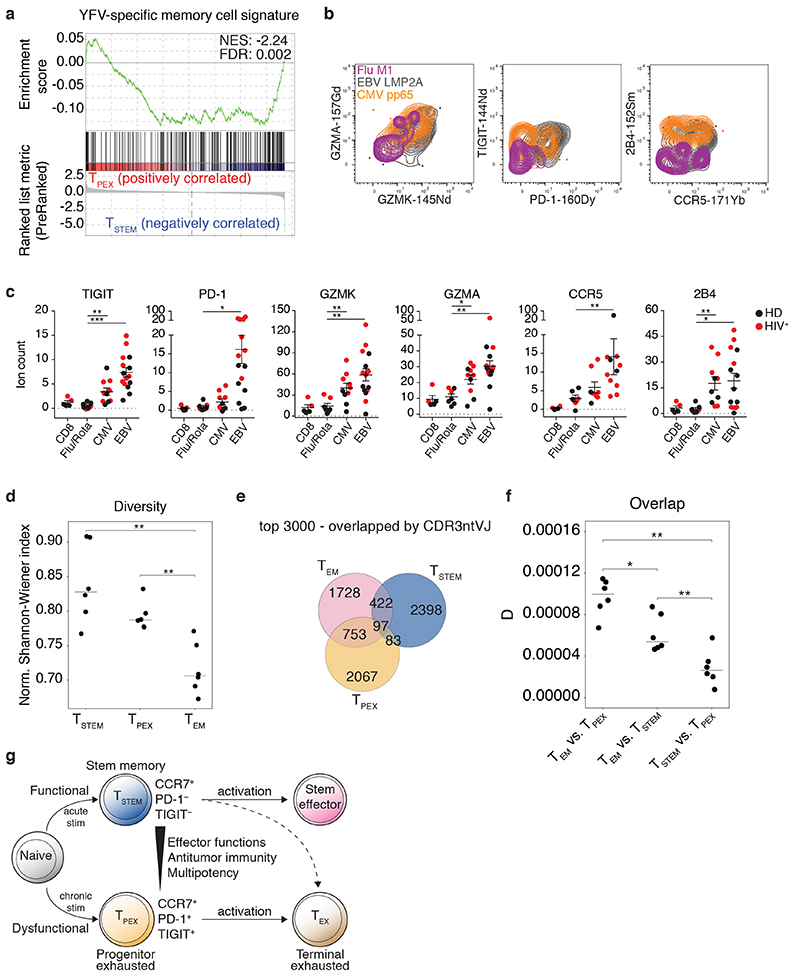
T cell memory relies on the generation of antigen-specific progenitors with stem-like properties. However, the identity of these progenitors has remained unclear, precluding a full understanding of the differentiation trajectories that underpin the heterogeneity of antigen-experienced T cells. We used a systematic approach guided by single-cell RNA-sequencing data to map the organizational structure of the human CD8+ memory T cell pool under physiological conditions. We identified two previously unrecognized subsets of clonally, epigenetically, functionally, phenotypically and transcriptionally distinct stem-like CD8+ memory T cells. Progenitors lacking the inhibitory receptors programmed death-1 (PD-1) and T cell immunoreceptor with Ig and ITIM domains (TIGIT) were committed to a functional lineage, whereas progenitors expressing PD-1 and TIGIT were committed to a dysfunctional, exhausted-like lineage. Collectively, these data reveal the existence of parallel differentiation programs in the human CD8+ memory T cell pool, with potentially broad implications for the development of immunotherapies and vaccines.


Conflict of interest statement

Competing Interests

The Laboratory of Translational Immunology receives reagents in kind as part of a collaborative research agreement with BD Biosciences (Italy). L.G. and E.L. are inventors on a patent describing methods for the generation and isolation of TSCM cells. L.G. has consulting agreements with Lyell Immunopharma and Advaxis Immunotherapies. E.W.N. is a cofounder and advisor for ImmunoScape Pte. Ltd. The other authors have no conflicts of interest to disclose.

Figures

Fig. 1
Fig. 1. Heterogeneity of the human CD8+ memory T cell pool.
a, Strategy for the isolation of CD8+ memory T cells from PB via FACS. b, UMAP plot showing the distribution of 31,640 cells (n = 4 donors). Cluster labels indicate selected DEGs. c, Histogram plot showing the median frequency of each cluster obtained in b. The dashed line is set at 1%. d, Balloon plot showing the average expression levels and expression frequencies of selected genes in each cluster obtained in b. e, Balloon plot showing the average expression levels and expression frequencies of selected genes in C2 versus C6. f, Bivariate plots depicting transcriptional module scores correlated with specific genes for selected clusters obtained in b. g, Flow cytometric gating strategy for the identification of CD8+ memory T cell subsets. Representative data are shown from PB. h, UMAP plot showing the expression of selected markers among CD8+ memory T cells isolated from different tissues (n = 6 donors per tissue with matched peripheral blood samples). Top left: overlays of the cell populations identified in g. i, Dot plot showing the tissue-specific frequencies of each subset identified in g. PB, peripheral blood; LN, lymph node; BM, bone marrow. Each dot represents one donor (n = 6 per tissue with matched peripheral blood samples). Bars indicate mean ± SEM. Statistics were calculated only for the GZMK and GZMK+ populations. *P < 0.05, **P < 0.01 (two-tailed unpaired t-test for GZMK+ in PB versus LN and lung versus LN, two-tailed Mann-Whitney U test for all other comparisons).
Fig. 2
Fig. 2. Identification of stem-like CD8+ memory T cell progenitors with differential expression of GZMK, PD-1, and TIGIT.
a, Flow cytometric gating strategy for the identification of PD-1+ TIGIT+ cells in the CD8+ naive (CCR7+ CD45RO CD95), TSCM (CCR7+ CD45RO CD95+), and TCM compartments (CCR7+ CD45RO+ CD95+). Numbers indicate percentages in the drawn gates. b, Dot plot summarizing the data obtained as in a. Each dot represents one donor (n = 20 from two independent experiments). Bars indicate mean ± SEM. ****P < 0.0001 (one-way repeated measures ANOVA). c, Heatmap showing DEGs (adjusted P value < 0.01) for the indicated CD8+ memory T cell subsets (n = 5 donors). Labels highlight genes associated with memory or effector differentiation or exhaustion. Significance was evaluated using edgeR analysis with glmQLFTest and Benjamini-Hochberg correction. d, Proliferation of the indicated CD8+ memory T cell subsets in response to stimulation with anti-CD3 plus CD28 for 4 d in the presence of IL-2 and IL-12 (n = 11 donors from six independent experiments) or IL-7 and IL-15 (n = 5 donors from three independent experiments). Index calculations were based on the dilution of carboxyfluorescein succinimidyl ester (CFSE). Each dot represents one donor. Bars indicate mean ± SEM. *P < 0.05, **P < 0.01, ***P < 0.001 (two-tailed Wilcoxon signed rank test for each population versus TEM in the presence of IL-2 and IL-12, two-tailed paired t-test for all other comparisons). e, Representative flow cytometric analysis of TSTEM (CCR7+ PD-1 TIGIT) and TPEX cells (CCR7+ PD-1+ TIGIT+) showing the expression of markers selected from the DEGs identified in c. Numbers indicate percentages in the drawn gates. Similar data were obtained from other donors (n = 5 for LEF1 and CCR5, n = 4 for CD26 and Eomes). f, GSEA based on 1,000 permutations showing manually curated signatures that differed significantly (adjusted P value < 0.05) between TSTEM and TPEX cells. NES, normalized enrichment score.
Fig. 3
Fig. 3. Functional properties of TSTEM and TPEX cells.
a, Representative flow cytometric analysis of FACS-purified TSTEM, TPEX, and TEM cells showing the expression of CD25 and CD69 before (us, unstimulated) and after stimulation with SEB for 24 h. Similar data were obtained from other donors (n = 4). Numbers colored to match each subset indicate percent marker+ cells with the corresponding median fluorescence intensity (MFI) in brackets. b, Dot plot showing the expression of T-bet among CD25+ CD69+ TSTEM, TPEX, and TEM cells before (us) and after stimulation as in a. Data are shown in terms of MFI. Each dot represents one donor (n = 5 from two independent experiments). Bars indicate mean ± SEM. *P < 0.05 (two-tailed paired t-test). c, Representative flow cytometric analysis showing the expression of CD107a, IFN-γ, IL-2, and TNF among TSTEM, TPEX, and TEM cells stimulated with anti-CD3 plus CD28 for 12 h. Numbers indicate percentages in the drawn gates. d, Dot plot summarizing the data obtained as in c. Each dot represents one donor (n = 7 from four independent experiments). Bars indicate mean ± SEM. **P < 0.01 (two-tailed paired t-test). e, Dot plot showing the function+ populations identified in d in terms of MFI. Each dot represents one donor (n = 3 from four independent experiments for CD107a, n = 7 from four independent experiments for IFN-γ, IL-2, and TNF). Bars indicate mean ± SEM. *P < 0.05, **P < 0.01, ***P < 0.001 (two-tailed paired t-test). f, Representative flow cytometric analysis showing the expression of CD107a, IFN-γ, IL-2, and TNF among TSTEM, TPEX, and TEM cells after stimulation of magnetically-enriched CD8+ T cells with PMA and ionomycin for 3 h. Numbers indicate percentages in the drawn gates. Subsets were gated as CCR7+ GZMK (TSTEM), CCR7+ GZMK+ (TPEX), or CCR7 CD45RO+ CD95+ (TEM). g, Dot plot summarizing the data obtained as in f. Each dot represents one donor (n = 6 from three independent experiments). Bars indicate mean ± SEM. *P < 0.05; **P < 0.01; ***P < 0.001 (two-tailed paired t-test). h, Schematic layout of the serial transfer experiments. i, Line chart showing the absolute numbers of CD8+ T cells in PB on days 11, 18, and 28 after transfer of TSTEM or TPEX cells into secondary NSG recipients. Data were pooled from two independent experiments (total n = 8 mice). Bars indicate mean ± SEM. *P = 0.0117 (two-way ANOVA). j, Dot plot showing the absolute numbers of CD8+ T cells in spleen on day 28 after transfer of TSTEM or TPEX cells into secondary NSG recipients. Each dot represents one mouse (n = 8 from two independent experiments). Bars indicate mean ± SEM. *P = 0.0148 (two-tailed Mann-Whitney U test).
Fig. 4
Fig. 4. Fate commitments of TSTEM and TPEX cells.
a, PCA plot showing the top 1,000 hypervariable peaks obtained from ex vivo ATAC-seq analysis (adjusted P value < 0.01) of TSTEM, TPEX, and TEM cells. Each dot represents one donor (n = 3). b, Heatmap showing DARs. Labels highlight accessible genes associated with memory or effector differentiation or exhaustion. c, Representative genomic regions showing the ATAC-seq profiles of TOX, TIGIT, and SATB1 in TSTEM and TPEX cells. DARs are highlighted in purple. d, TFBMs enriched among the DARs shown in b. Enrichment was assessed using a one-sided hypergeometric test in HOMER with correction for FDR. e, Representative overlay histograms showing CFSE dilution (left) and GZMB expression profiles (right) for TSTEM and TPEX cells stimulated with anti-CD3 plus CD28 and IL-15 for 3 d in the absence or presence of TGF-β. Unstimulated controls are shown for comparison. Similar data were obtained from other donors in the absence (n = 8 from four independent experiments) or presence of TGF-β (n = 6 from four independent experiments). PI, proliferation index. f, Representative flow cytometric analysis of TSTEM and TPEX cells showing the expression of PD-1 and TIGIT after stimulation with anti-CD3 plus CD28 for 4 d in the presence of IL-2 and IL-12. Numbers indicate percentages in the drawn gates. g, Bar graph summarizing the data obtained as in f (n = 5 donors from three independent experiments). Bars indicate mean ± SEM. **P < 0.01, ***P < 0.001 (two-tailed Mann-Whitney U test). h, Heatmap showing selected DEGs (adjusted P value < 0.05) for TSTEM and TPEX cells stimulated as in f (n = 4 donors). Significance was evaluated using edgeR analysis with glmQLFTest and Benjamini-Hochberg correction. i, PCA plot as in a comparing TSTEM and TPEX cells before and after stimulation as in f. j, Top: schematic layout of the adoptive transfer experiment. Bottom: time series plot showing the growth of NALM6 cells in NSG mice (n = 5/group) adoptively transferred with TSTEM or TPEX cells expressing a CAR specific for CD19 (CAR19). RLU, relative light unit; UT, untransduced CD3+ cells. Follow-up was stopped when RLU values ≥ 106 were observed in more than 75% of mice in one of the treated groups. Bars indicate mean ± SEM. *P < 0.05 (two-tailed unpaired t-test for CAR19 TSTEM versus CAR19 TPEX on day 17, two-tailed Mann-Whitney U test for all other comparisons).
Fig. 5
Fig. 5. Antigen specificity and clonal identity of TSTEM and TPEX cells.
a, GSEA of the YFV-specific CD8+ memory T cell signature in TSTEM versus TPEX cells. b, Representative CyTOF analysis showing the expression of GZMK, GZMA, PD-1, TIGIT, CCR5, and 2B4 among CCR7+ virus-specific CD8+ T cell populations from healthy (n = 3) and HIV+ donors (n = 2). c, Dot plots summarizing the data obtained as in b. Epitopes derived from influenza virus (n = 6) and rotavirus (n = 1) were pooled for simplicity. Comparative data are shown for the corresponding total CD8+ T cell populations. Each dot represents one specificity in one donor (n = 3 healthy donors, n = 2 HIV+ donors). Bars indicate mean ± SEM. *P < 0.05, **P < 0.01, ***P < 0.001 (two-tailed Mann-Whitney U test for CCR5 comparisons, two-tailed unpaired t-test for all other marker comparisons). HD, healthy donor. d, Dot plot showing the normalized Shannon-Wiener index for TCRβ repertoires obtained from the TSTEM, TPEX, and TEM subsets. Each dot represents one donor (n = 6). Bars indicate median values. **P < 0.01 (two-tailed paired t-test with Bonferroni correction). e, Venn diagram showing the numbers of shared and unique clonotypes among TSTEM, TPEX, and TEM cells from a representative donor. Similar data were obtained from other donors (n = 5). Analysis was restricted to the top 3,000 clonotypes. f, Dot plot summarizing the pairwise comparisons among subsets illustrated in e. D metric in VDJtools. Each dot represents one donor (n = 6). Bars indicate median values. *P < 0.05, **P < 0.01 (two-tailed paired t-test with Bonferroni correction). g, Proposed model showing the origins and differentiation trajectories of TSTEM and TPEX cells.

Comment in

  • Two parallel worlds of memory T cells.
    Chu T, Berner J, Zehn D. Chu T, et al. Nat Immunol. 2020 Dec;21(12):1484-1485. doi: 10.1038/s41590-020-00815-y. Nat Immunol. 2020. PMID: 33116302 No abstract available.

Similar articles

Cited by

References

    1. Kaech SM, Wherry EJ, Ahmed R. Effector and memory T-cell differentiation: implications for vaccine development. Nat Rev Immunol. 2002;2:251–262. - PubMed
    1. Gattinoni L, Speiser DE, Lichterfeld M, Bonini C. T memory stem cells in health and disease. Nat Med. 2017;23:18–27. - PMC - PubMed
    1. Lugli E, Galletti G, Boi SK, Youngblood BA. Stem, effector, and hybrid states of memory CD8+ T cells. Trends Immunol. 2020;41:17–28. - PMC - PubMed
    1. Gattinoni L, et al. A human memory T cell subset with stem cell-like properties. Nat Med. 2011;17:1290–1297. - PMC - PubMed
    1. Biasco L, et al. In vivo tracking of T cells in humans unveils decade-long survival and activity of genetically modified T memory stem cells. Sci Transl Med. 2015;7:273ra13 - PubMed

Publication types

MeSH terms