. 2020 Nov;17(11):1083-1091.
doi: 10.1038/s41592-020-0965-y. Epub 2020 Oct 12.

A systematic evaluation of the design and context dependencies of massively parallel reporter assays

Affiliations

A systematic evaluation of the design and context dependencies of massively parallel reporter assays

Jason C Klein et al. Nat Methods. 2020 Nov.

Abstract

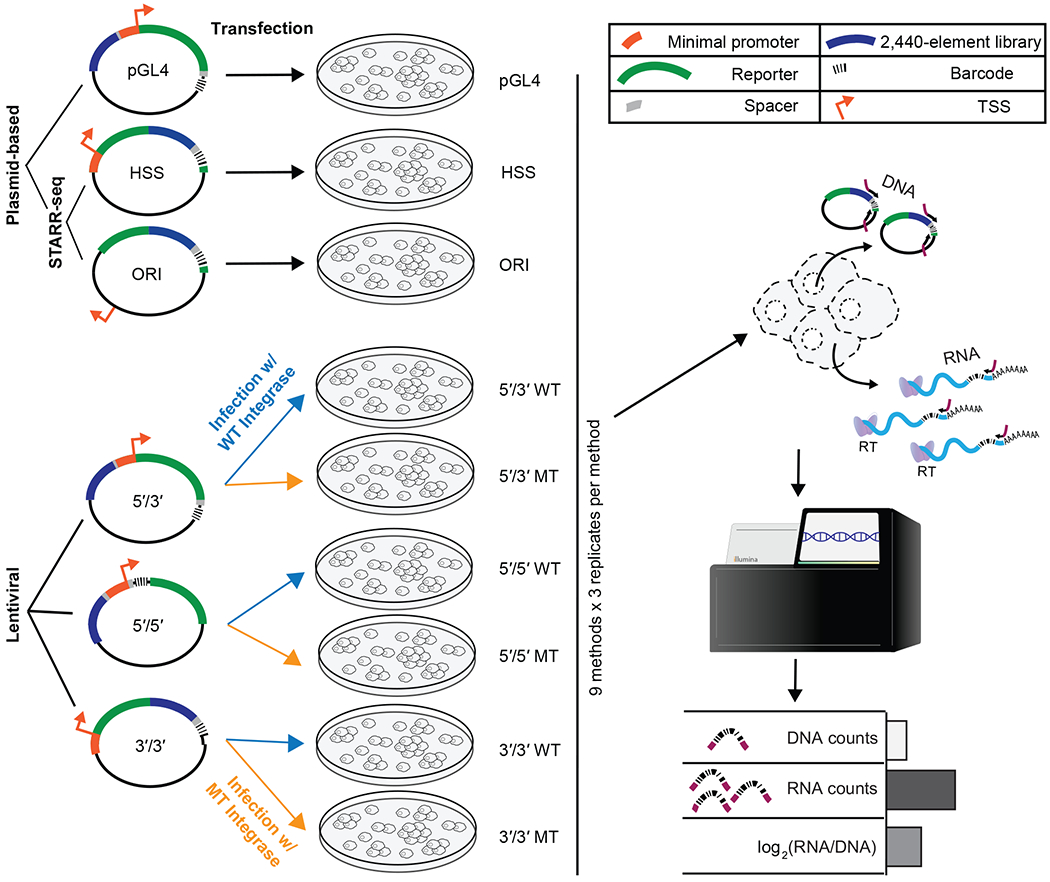
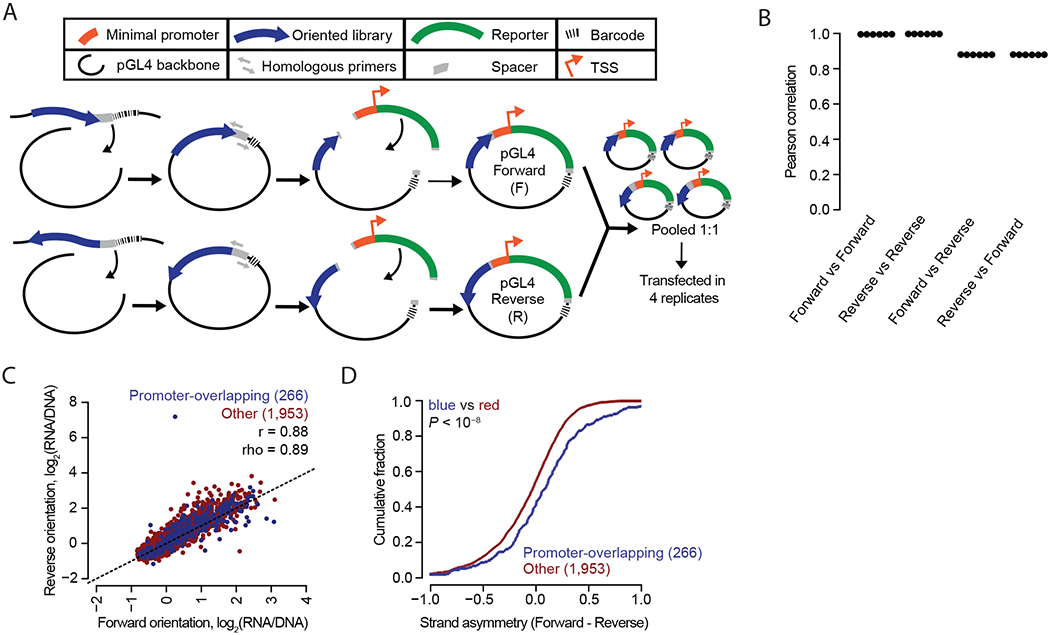
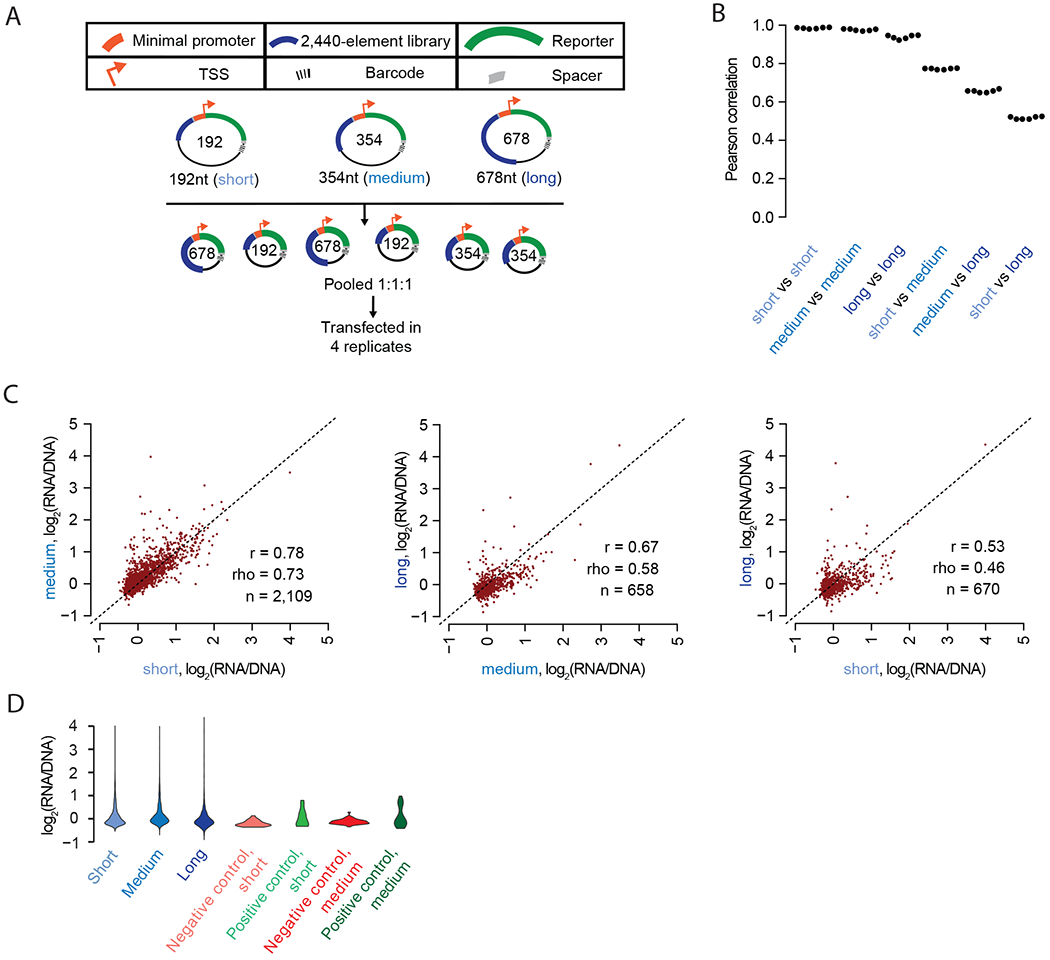
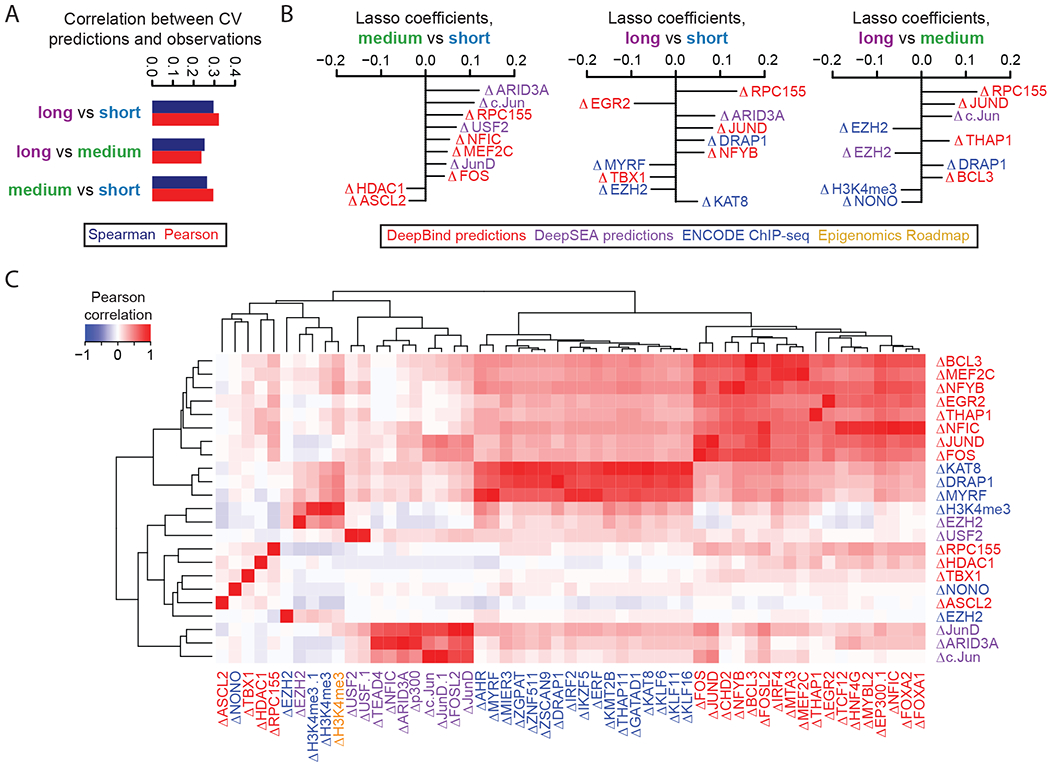
Massively parallel reporter assays (MPRAs) functionally screen thousands of sequences for regulatory activity in parallel. To date, there are limited studies that systematically compare differences in MPRA design. Here, we screen a library of 2,440 candidate liver enhancers and controls for regulatory activity in HepG2 cells using nine different MPRA designs. We identify subtle but significant differences that correlate with epigenetic and sequence-level features, as well as differences in dynamic range and reproducibility. We also validate that enhancer activity is largely independent of orientation, at least for our library and designs. Finally, we assemble and test the same enhancers as 192-mers, 354-mers and 678-mers and observe sizable differences. This work provides a framework for the experimental design of high-throughput reporter assays, suggesting that the extended sequence context of tested elements and to a lesser degree the precise assay, influence MPRA results.


Conflict of interest statement

Competing interests

The authors declare no competing interests.

Figures

Figure 1.
Figure 1.. Nine MPRA strategies and experimental workflow.
Nine different MPRA designs were tested. These are schematically represented on the left, and from top to bottom include pGL4.23c (pGL4); the original STARR-seq vector (HSS); STARR-seq with no minimal promoter (ORI); and lentiMPRAs with the enhancer library upstream of the minimal promoter and the associated barcodes in the 3′ UTR of the reporter gene (5′/3′), the enhancer library upstream of the minimal promoter and barcodes in the 5′ UTR of the reporter (5′/5′), or with both the enhancer library and the barcodes in the 3′ UTR of the reporter (3′/3′). The episomal designs (pGL4, HSS, ORI) were transfected into HepG2 cells, while 5′/5′, 5′/3′, and 3′/3′ were packaged with either wild type (WT) or mutant (MT) integrase and infected into HepG2 cells. DNA and RNA were extracted from the cells, and the enhancer-associated barcodes amplified and sequenced, and a normalized activity score for each element computed on the basis of the counts.
Figure 2.
Figure 2.. Quantitative comparison of different MPRA strategies.
A) Beeswarm plot of the Pearson correlation values for each of the three possible pairwise comparisons among the replicates of each MPRA technique. B) Scatter matrix displaying scatter plots corresponding to each of the 36 pairs of possible inter-assay comparisons (lower diagonal elements). Shown on the diagonal is a histogram of the log2(RNA/DNA) ratios, averaged among replicate samples. Also shown are Pearson correlation values among each pair of comparisons, with the size of the text proportional to the magnitude of the correlation coefficient (upper diagonal elements). See Supplemental Figure 5 for equivalent but with Spearman correlations. C) PCA of 27 experiments, i.e. three replicates x nine different MPRA designs. Shown are the first two PCs that together explain over half of the variation. Slight jitter was added to each data point to enhance readability. D) Violin plots displaying the distribution of average log2(RNA/DNA) ratios across independent transfections for positive controls, negative controls, and putative enhancer sequences tested, for each of the nine assays.
Figure 3.
Figure 3.. Predictive modeling of the ratios and differences between MPRA methods.
A) Pearson and Spearman correlation coefficients for 10-fold cross-validated predictions derived from lasso regression models and the observed RNA/DNA ratios, for each of the 7 indicated differential comparisons tested. Also indicated are the Pearson (r) and Spearman (rho) correlation values. B) The top 10 coefficients derived from lasso regression models trained on the full dataset to predict observed differences in the indicated pairs of MPRA methods. Features with the extension “.1”, “.2”, etc allude to redundant features or replicate samples. C) Pearson correlation matrix between the union of all top 10 features from (B), shown as rows, and other features sharing a Pearson correlation either ≤ −0.8 or ≥ 0.8, shown as columns. Feature names are colored according to the origin of the feature as shown in the boxed key above. Hierarchical clustering was used to group features exhibiting similar correlation patterns.
Figure 4.
Figure 4.. Enhancer activity is largely, but not completely, independent of sequence orientation.
A) Workflow used to produce an MPRA library with each element in both orientations. The 2,336 element library was cloned into the pGL4 backbone in both orientations as two separate libraries. These were then pooled and transfected into HepG2 cells in quadruplicate. B) Beeswarm plot of the Pearson correlations corresponding to each of the six possible pairwise comparisons among the four replicates. The correlations are computed between observed enhancer activity values for elements positioned either in the same (Forward vs. Forward and Reverse vs. Reverse) or opposite (Forward vs. Reverse and Reverse vs. Forward) orientations. C) Scatter plots of the average activity score of each element in the Forward vs. Reverse orientation, split out by promoter-overlapping (blue; +/− 1 Kb of the TSS of a protein-coding gene) and other (red) elements. D) Cumulative distributions measuring strand asymmetry between promoter-overlapping elements and other elements. Here, “Forward” and “Reverse” were defined as “sense” and “antisense”, respectively, in relation to the orientation of the TSS for promoter-overlapping elements (n = 266); and were defined as “plus” and “minus”-stranded, respectively, in relation to the chromosome annotation for other elements (n = 1,953). Similarity of the blue distribution to that of the red was tested (one-sided Kolmogorov–Smirnov [K–S] test, P value).
Figure 5.
Figure 5.. Including additional sequence context around tested elements leads to differences in the results of MPRAs.
A) Experimental schematic. 192 bp, 354 bp, and 678 bp libraries were synthesized, assembled, and cloned into the pGL4 backbone. These were pooled and transfected into HepG2 cells in quadruplicate. B) Beeswarm plot of the Pearson correlation values corresponding to each of the six possible pairwise comparisons among the four replicates. The correlations are computed between observed enhancer activity values for elements measured in each of the three possible size classes. C) Scatter plots of the average activity score of each element, comparing short vs. medium, medium vs. long, and short vs. long versions of each element, and restricting to elements detected with at least 10 unique barcodes at both lengths (n). D) Violin plot displaying the distribution of average log2(RNA/DNA) ratios for short, medium, and long versions of the elements tested, as well as for positive and negative controls at short and medium lengths.
Figure 6.
Figure 6.. Predictive modeling of factors dependent on element size.
A) Pearson and Spearman values between the 10-fold cross-validated predictions and observed values for each of the three size classes tested. B) The top 10 coefficients derived from lasso regression models trained on the full dataset to predict observed values from the differential size comparisons indicated. Features with the extension “.1”, “.2”, etc allude to redundant features or replicate samples. C) Pearson correlation matrix between the union of all top 10 features from (B), shown as rows, and other features sharing a Pearson correlation either ≤ −0.8 or ≥ 0.8, shown as columns. Feature names are colored according to the origin of the feature as shown in the boxed key above. Hierarchical clustering was used to group features exhibiting similar correlation patterns.

References

    1. Banerji J, Rusconi S & Schaffner W Expression of a beta-globin gene is enhanced by remote SV40 DNA sequences. Cell 27, 299–308 (1981). - PubMed
    1. Moreau P et al. The SV40 72 base repair repeat has a striking effect on gene expression both in SV40 and other chimeric recombinants. Nucleic Acids Res. 9, 6047–6068 (1981). - PMC - PubMed
    1. Banerji J, Olson L & Schaffner W A lymphocyte-specific cellular enhancer is located downstream of the joining region in immunoglobulin heavy chain genes. Cell 33, 729–740 (1983). - PubMed
    1. Neuberger MS Expression and regulation of immunoglobulin heavy chain gene transfected into lymphoid cells. EMBO J. 2, 1373–1378 (1983). - PMC - PubMed
    1. Bernstein BE et al. The NIH Roadmap Epigenomics Mapping Consortium. Nat. Biotechnol. 28, 1045–1048 (2010). - PMC - PubMed

METHODS-ONLY REFERENCES

    1. Quinlan AR & Hall IM BEDTools: a flexible suite of utilities for comparing genomic features. Bioinformatics 26, 841–842 (2010). - PMC - PubMed
    1. Klein JC, Agarwal V, Inoue F, Keith A, Martin B, Kircher M, Ahituv N, Shendure J. A systematic evaluation of the design, orientation, and sequence context dependencies of massively parallel reporter assays. Protocol Exchange (2020) doi:10.21203/rs.3.pex-1065/v1. - DOI - PMC - PubMed
    1. Zhang J, Kobert K, Flouri T & Stamatakis A PEAR: a fast and accurate Illumina Paired-End reAd mergeR. Bioinformatics 30, 614–620 (2014). - PMC - PubMed
    1. Li H Aligning sequence reads, clone sequences and assembly contigs with BWA-MEM. arXiv [q-bio.GN] (2013).
    1. Gordon MG et al. lentiMPRA and MPRAflow for high-throughput functional characterization of gene regulatory elements. Nat. Protoc. 15, 2387–2412 (2020). - PMC - PubMed

Publication types

Substances