. 2020 Nov 11;20(11):7980-7986.
doi: 10.1021/acs.nanolett.0c02815. Epub 2020 Oct 13.

Folding a Single-Molecule Junction

Affiliations

Folding a Single-Molecule Junction

Chuanli Wu et al. Nano Lett. .

Abstract

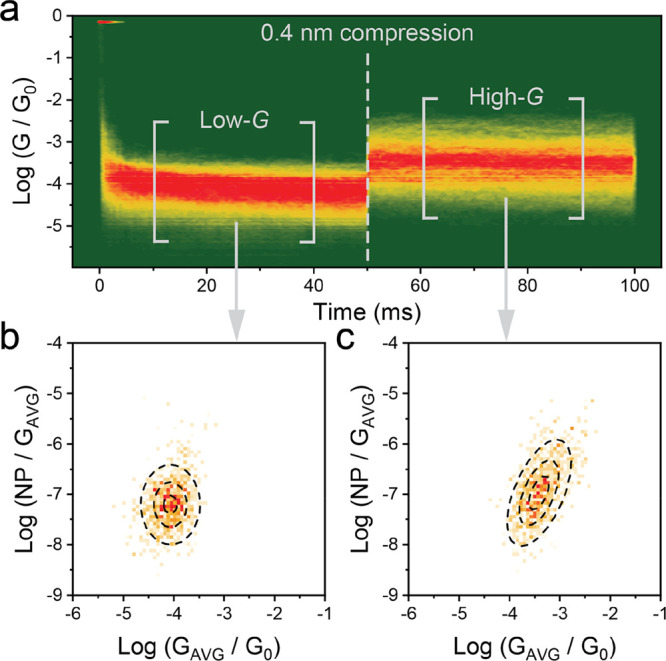
Stimuli-responsive molecular junctions, where the conductance can be altered by an external perturbation, are an important class of nanoelectronic devices. These have recently attracted interest as large effects can be introduced through exploitation of quantum phenomena. We show here that significant changes in conductance can be attained as a molecule is repeatedly compressed and relaxed, resulting in molecular folding along a flexible fragment and cycling between an anti and a syn conformation. Power spectral density analysis and DFT transport calculations show that through-space tunneling between two phenyl fragments is responsible for the conductance increase as the molecule is mechanically folded to the syn conformation. This phenomenon represents a novel class of mechanoresistive molecular devices, where the functional moiety is embedded in the conductive backbone and exploits intramolecular nonbonding interactions, in contrast to most studies where mechanoresistivity arises from changes in the molecule-electrode interface.

Keywords: conformational; dionemolecular devices; mechanoresistivity; single-molecule junctions; switching.


Conflict of interest statement

The authors declare no competing financial interest.

Figures

Figure 1
Figure 1
Molecular Design. (a) Structure of compound 1 with the conformationally flexible bond highlighted in orange. (b) Energy vs O=C—C=O dihedral angle for compound 1 obtained by MM2 Force Field calculations. (c) Three-dimensional structures of 1 in the anti (dihedral of 155°) and syn (dihedral of 23°) conformations with S–S length shown.
Figure 2
Figure 2
STM-BJ data for 1. (a) Example Gz traces for 1 under constant electrode displacement speed (20 nm/s). (b) Conductance histogram for 1 compiled with 7678 traces as shown in (a) with no data selection. (c) Conductance–electrode displacement density map of 1. (d) Density map of piezo-modulation experiments. After an abrupt 1.2 nm stretch that opens the nanogap, the junction size is compressed by 0.4 nm and then relaxed again for four times in 100 ms. The piezo signal is superimposed as a gray line for clarity. Histograms and 2D maps compiled with 100 bins/decade, 100 bins/nm, and 1000 bins/second. Experiments performed at 200 mV bias. White contours in (c) are a guide for the eye. Plots in (b,c) compiled from 7678 traces with no selection. Density map (d) obtained from 1767 traces, selected from a data set of 5036 traces using an automated algorithm, described in Section 2.2 of the SI.
Figure 3
Figure 3
PSD analysis of 1. (a) Conductance versus time density map for a single compression cycle of 1. The portions between brackets were then cut off and analyzed with a FFT algorithm to calculate the noise power. (b) Normalized noise power versus GAVG heatmap for 1 in the relaxed, low-G state. (c) Normalized noise power versus GAVG heatmap for 1 in the compressed, high-G state The dashed lines in panels (b,c) are the 25, 50 and 75% height contours of a 2D Gaussian surface fitted to the experimental data. All experiments performed at 200 mV tip–substrate bias. Plots compiled from 8213 traces, using the data selection algorithms described in the SI.
Figure 4
Figure 4
Control experiments. (a) Structures of compounds 2 and 3. (b) Density map of piezo-modulation experiments for 2. (c) Density map of piezo-modulation experiments for 3. (d) Comparison of line profile histograms obtained during modulation experiments (56 and 68 ms). Extended, low conductance junction in shaded, lighter color. Compressed, high-conductance junction in darker, solid color. The conductance boost upon compression is ∼21× for 1, ∼2× for 2, and ∼3× for 3. The same piezo ramp used for compound 1 and shown in Figure 2d was used to obtain the data in (b,c).
Figure 5
Figure 5
Theoretical calculations. (a) Structure of the junctions obtained by DFT and used for the transport calculations. (b) T(E) curves for compound 1 in the relaxed (anti) and compressed (syn) junction conformations, with and without through-space (π–π) couplings. The gray-shaded area represents the range of energy values where there is good agreement with the experimental data. (c) Schematic depiction of the junction structure used in the tight-binding calculations. (d) Tight-binding transmission function for 1 in the syn configuration, with ϵ0 = ϵ1 = 0, γ = −1, and α = −0.2.

References

    1. Xu B.; Tao N. Measurement of Single-Molecule Resistance by Repeated Formation of Molecular Junctions. Science 2003, 301 (5637), 1221–1223. 10.1126/science.1087481. - DOI - PubMed
    1. Haiss W.; Nichols R. J.; van Zalinge H.; Higgins S. J.; Bethell D.; Schiffrin D. J. Measurement of Single Molecule Conductivity Using the Spontaneous Formation of Molecular Wires. Phys. Chem. Chem. Phys. 2004, 6, 4330–4337. 10.1039/b404929b. - DOI
    1. Vezzoli A.; Brooke R. J.; Higgins S. J.; Schwarzacher W.; Nichols R. J. Single-Molecule Photocurrent at a Metal–Molecule–Semiconductor Junction. Nano Lett. 2017, 17 (11), 6702–6707. 10.1021/acs.nanolett.7b02762. - DOI - PubMed
    1. Venkataraman L.; Klare J. E.; Tam I. W.; Nuckolls C.; Hybertsen M. S.; Steigerwald M. L. Single-Molecule Circuits with Well-Defined Molecular Conductance. Nano Lett. 2006, 6 (3), 458–462. 10.1021/nl052373+. - DOI - PubMed
    1. Zhou J.; Chen G.; Xu B. Probing the Molecule-Electrode Interface of Single-Molecule Junctions by Controllable Mechanical Modulations. J. Phys. Chem. C 2010, 114 (18), 8587–8592. 10.1021/jp101257y. - DOI

Publication types