. 2020 Dec 7;219(12):e201911100.
doi: 10.1083/jcb.201911100.

Hydroxylated sphingolipid biosynthesis regulates photoreceptor apical domain morphogenesis

Affiliations

Hydroxylated sphingolipid biosynthesis regulates photoreceptor apical domain morphogenesis

Sarita Hebbar et al. J Cell Biol. .

Abstract

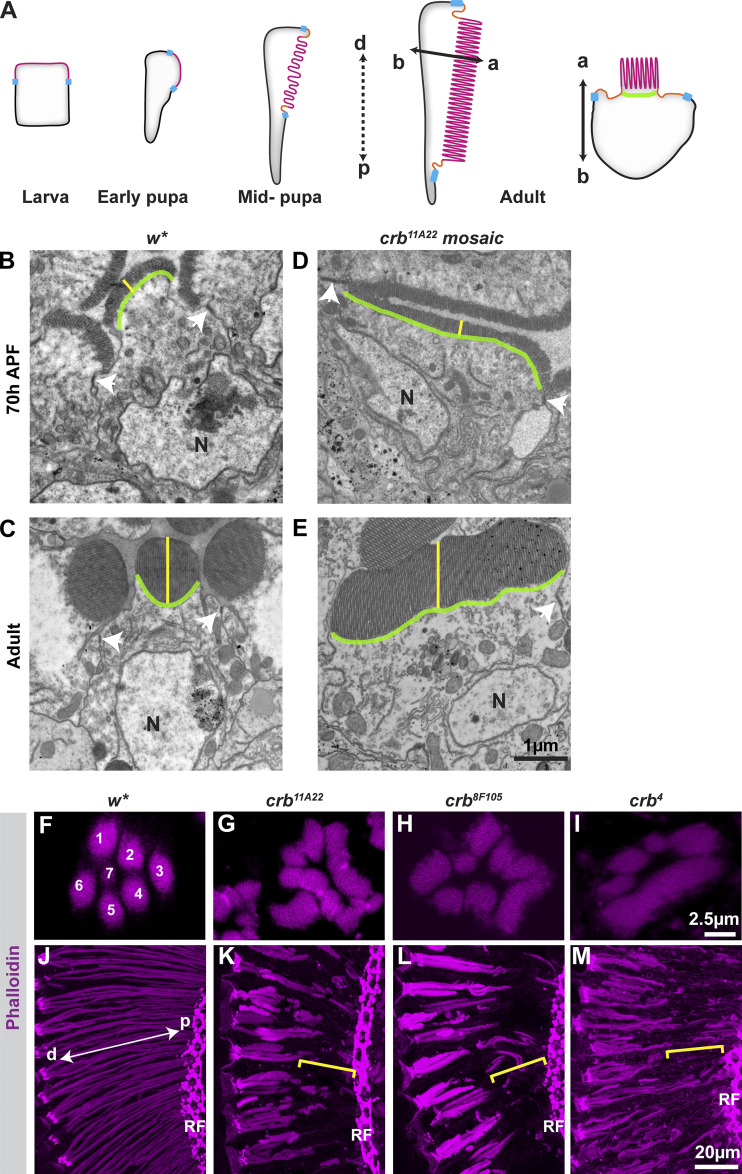
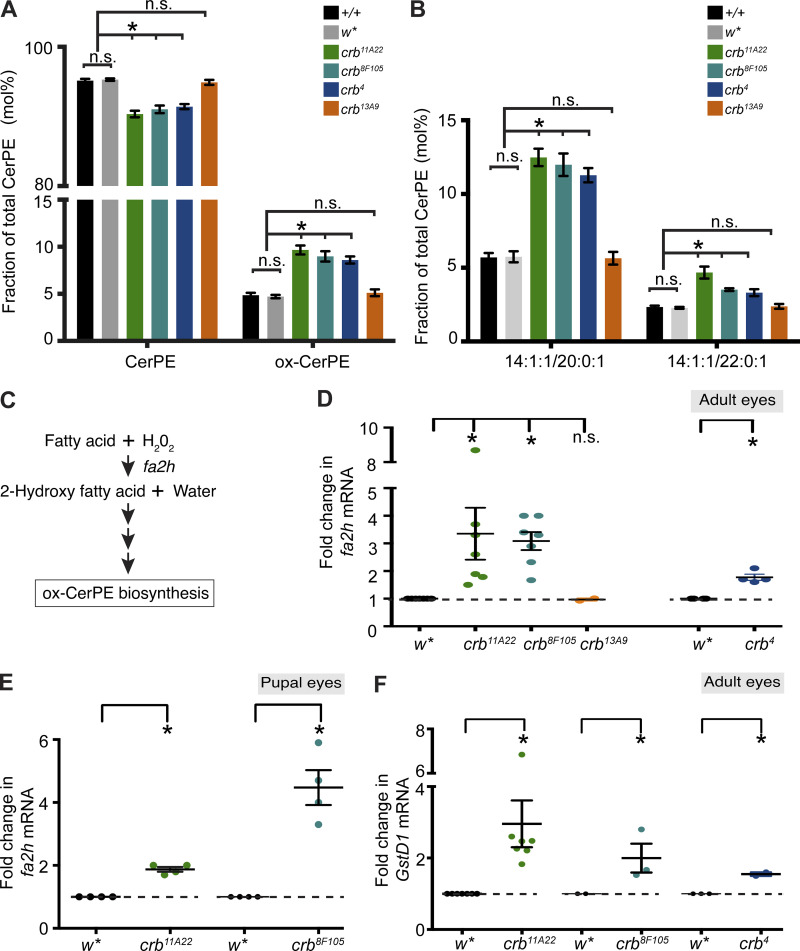
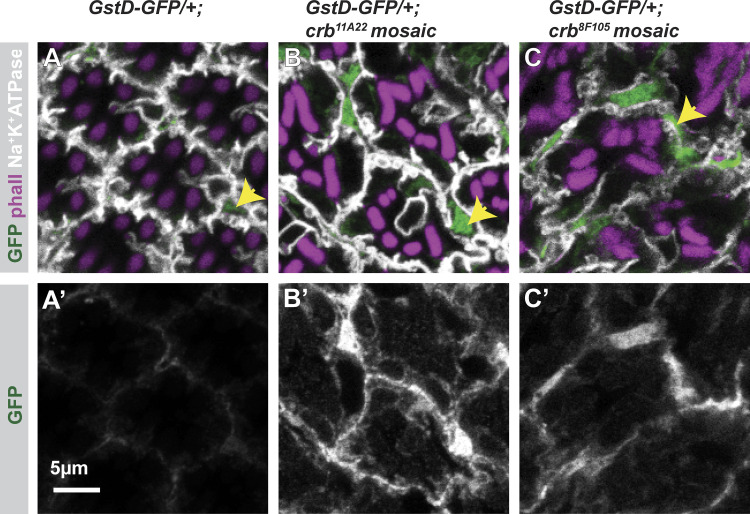
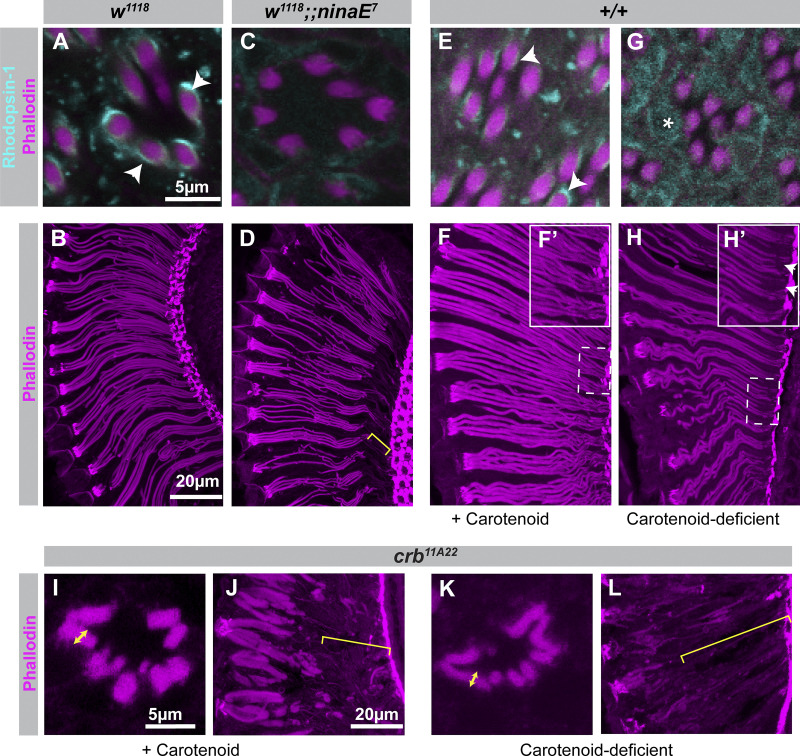
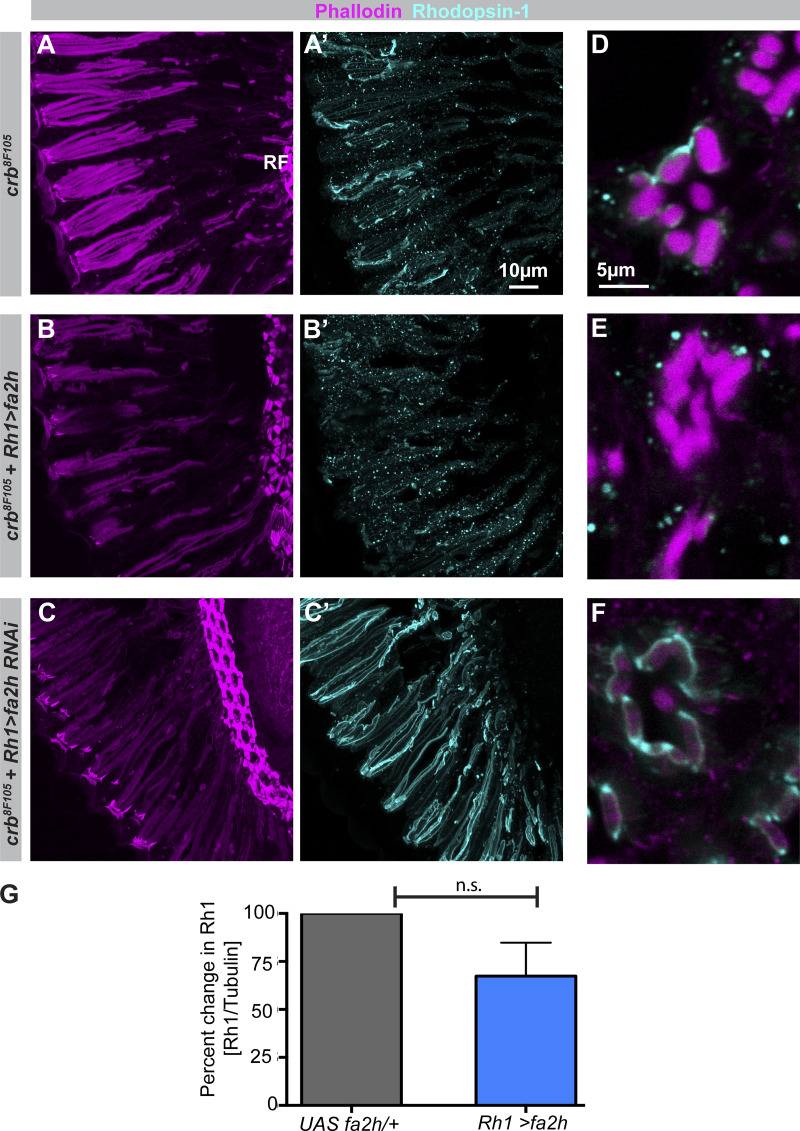
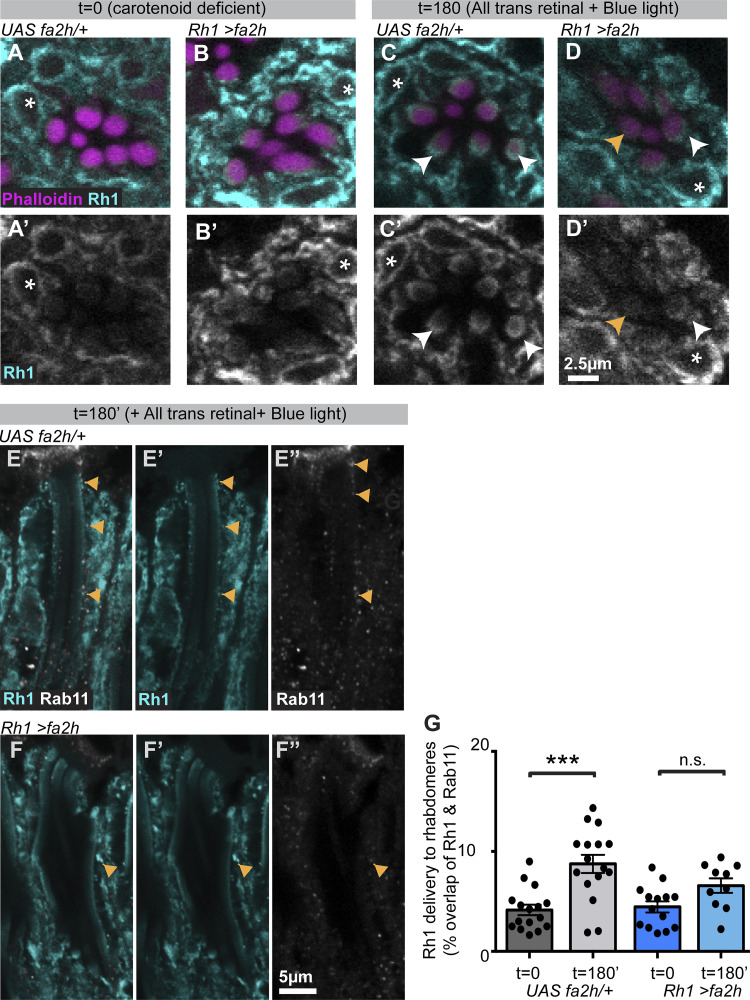
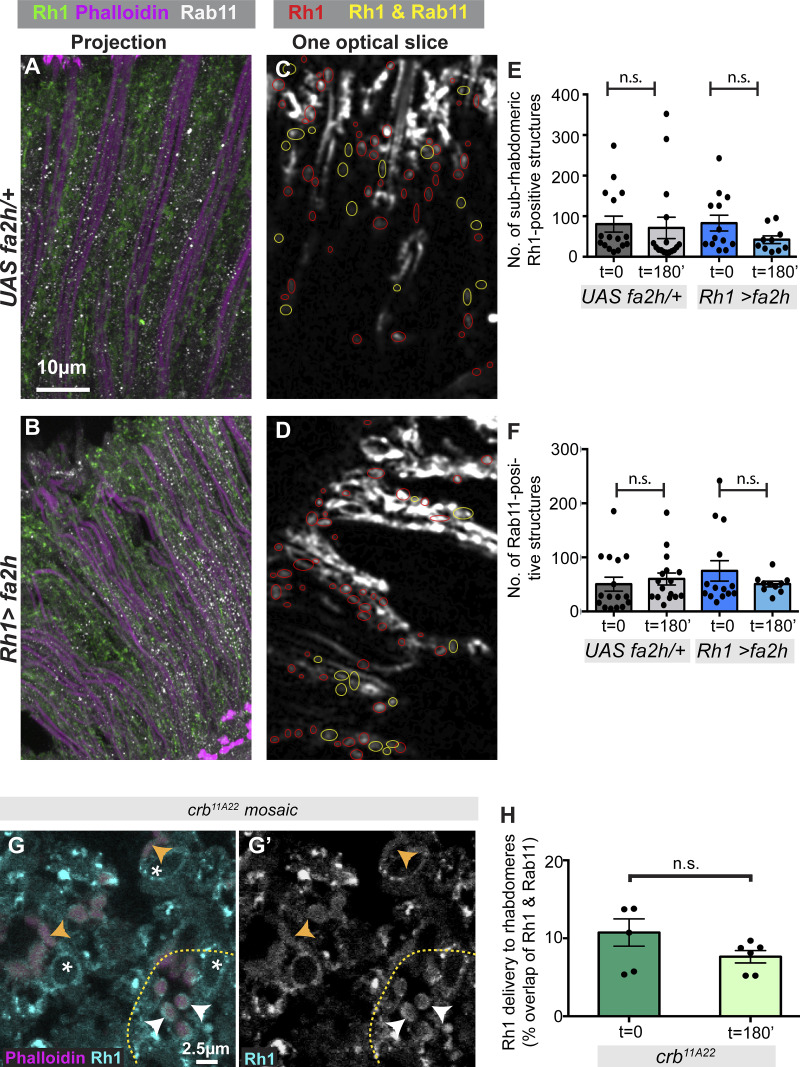
Apical domains of epithelial cells often undergo dramatic changes during morphogenesis to form specialized structures, such as microvilli. Here, we addressed the role of lipids during morphogenesis of the rhabdomere, the microvilli-based photosensitive organelle of Drosophila photoreceptor cells. Shotgun lipidomics analysis performed on mutant alleles of the polarity regulator crumbs, exhibiting varying rhabdomeric growth defects, revealed a correlation between increased abundance of hydroxylated sphingolipids and abnormal rhabdomeric growth. This could be attributed to an up-regulation of fatty acid hydroxylase transcription. Indeed, direct genetic perturbation of the hydroxylated sphingolipid metabolism modulated rhabdomere growth in a crumbs mutant background. One of the pathways targeted by sphingolipid metabolism turned out to be the secretory route of newly synthesized Rhodopsin, a major rhabdomeric protein. In particular, altered biosynthesis of hydroxylated sphingolipids impaired apical trafficking via Rab11, and thus apical membrane growth. The intersection of lipid metabolic pathways with apical domain growth provides a new facet to our understanding of apical growth during morphogenesis.


Figures

Figure 1.
Figure 1.
Rhabdomere proximodistal extension is affected in crumbs mutants in the last quarter of pupal development. (A) Cartoon (not drawn to scale) depicting the remodeling of an epithelial precursor cell from the larval imaginal disc to the mature adult photoreceptor (Cagan and Ready, 1989). The precursor is a simple epithelial cell with its apical domain (magenta), adherens junction (blue), and basal membrane (black). In the first day of pupal development (early pupa), the apical domain shifts to adopt a lateral position. In midpupal stages, the apical domain is subdivided into the stalk membrane (orange) and the incipient rhabdomere (magenta). Finally, in the second half of pupal development, the apical domain/rhabdomere grows tremendously by extending along its proximodistal (p-d) axis (black dashed double-headed arrow) and by increasing its thickness along the apicobasal (a-b) axis (black solid double-headed arrow) of the cell. The width in the rhabdomere in the adult (cartoon of a cross section) is highlighted by a light green curved line. (B–E) Electron micrographs of distal transverse sections of pupal eyes at 70 h APF (B and D) and adult eyes (C and E) showing rhabdomeres in control (w*; B and C) and crb11A22 mutants (D and E). N indicates the nucleus of the cells, and white arrowheads point to the adherens junctions, which are evident in wild-type and mutant cells at both time points. Yellow solid lines indicate rhabdomere thickness along the apicobasal axis of the cell. Green curved lines demarcate the rhabdomere width. Note that the width in the mutant is already affected at 70 h APF. Scale bar is indicated in E. (F–I) Optical sections from 12-µm-thick transverse sections at the distal end of adult eyes labeled with Alexa Fluor 555-Phalloidin to visualize F-actin. Seven PRCs (1–7) are evident. In three different crb mutant alleles (G–I), altered rhabdomeres are visible. At the distal end of PRCs, rhabdomeres are wider. (J–M) Projections of confocal stacks obtained from 12-µm-thick longitudinal sections of adult eyes labeled with Alexa Fluor 555-Phalloidin to visualize F-actin. White double-headed arrow indicates the p-d axis, with the lens to the left and the retinal floor (RF) to the right. Yellow brackets indicate the lack of rhabdomeric extension in crb mutant alleles. Scale bars are indicated in I and M.
Figure S1.
Figure S1.
Growth of rhabdomeres in the last quarter of pupal development is manifested by an extension and an increase in thickness. (A–C) Projections of confocal stacks obtained from 12-µm-thick longitudinal sections of pupal (A and B) and adult (C) eyes labeled with Alexa Fluor 555-Phalloidin to visualize F-actin. White dashed double-headed arrows indicate the proximodistal axis, with the lens to the left and the retinal floor (RF) to the right. Scale bar is as indicated in C. (D–F′) Optical sections from 12-µm-thick transverse sections of pupal (D–E′) and adult (F and F′) eyes, labeled with Alexa Fluor 555-Phalloidin. (D′–F′) Individual ommatidia, shown at higher magnification. Yellow solid lines indicate the rhabdomeric thickness along the apicobasal axis of the cell, while the green curved line demarcates the rhabdomere width. Scale bar is as indicated in F′.
Figure 2.
Figure 2.
crb mutant eyes have an altered lipidome and increased levels of fatty acid hydroxylase mRNA. (A) Lipid distribution (denoted in mol%) within the sphingolipid class for nonhydroxylated CerPE and ox-CerPE, quantified by MS of eye extracts from controls (+/+ and w*), three crb mutants with bulky rhabdomeres (crb11A22, crb8F105, and crb4), and the crb allele crb13A9, which does not develop bulky rhabdomeres (Spannl et al., 2017). Bars represent mean ± SEM, and sample size = three biological replicates. Increased abundance of hydroxylated CerPE is observed only in crb mutants with bulky rhabdomeres. Statistical significance between groups is denoted by * (P < 0.05), whereas n.s. denotes no significant difference. (B) Lipid distribution (denoted in mol%) for major ox-CerPE species (14:1:1/20:0:1 and 14:1:1/22:0:1), with hydroxylation at fatty acid components identified and quantified by MS using MSn fragmentation of lipids from eye extracts. Increased hydroxylation at the fatty acid moiety of the sphingolipids was observed in crb mutants with bulky rhabdomeres. Bars represent mean ± SEM, and sample size = three biological replicates. Statistical significance between groups is denoted by * (P < 0.05), whereas n.s. denotes no significant difference. (C) Part of the pathway proposed for the generation of sphingolipids hydroxylated at the fatty acid moiety, shown here for ox-CerPE. The process begins with the hydroxylation of the fatty acid by an enzyme encoded by fa2h (fatty acid (2) hydroxylase) in the presence of hydrogen peroxide. The hydroxylated fatty acid thus generated is included in the typical sphingolipid biosynthetic process to form the hydroxylated sphingolipid. (D–F) Comparison of mRNA levels by qRT-PCR for fa2h (D and E) and GstD1 (F) in adult (D and F) and pupal (60–80 h APF; E) eyes. Each replicate is shown as a dot, and lines represent mean ± SEM for fold-change in mRNA as indicated. Values are calculated after normalization with Gapdh1 mRNA and are relative to the control (w*; level indicated by black dotted line). *, statistical significance (P < 0.05); n.s., no significant difference between pairs as indicated by brackets.
Figure S2.
Figure S2.
Identification of CerPE species by FT MS and HCD FT MS/MS in positive ion mode. Representative FTMS+ (left) and HCD FT MS/MS+ (right) spectra used for the identification of four CerPE species (CerPE34:1:1, A; CerPE 34:1:2, B; CerPE36:1:1, C; and CerPE36:1:2, D). With HCD FT MS/MS, using NCE of 35%, class- and species-specific fragments are obtained; these include species with the neutral loss of m/z 141.03 (CerPE NL), a corresponding water loss (CerPE NL-H2O), two fatty acid amide (FAA), and the long-chain base fragments (LCB).
Figure S3.
Figure S3.
Increased intensity of GstD-GFP reporter in crb mutant PRCs. (A–C′) Optical sections from confocal images of a z-stack of 12-µm transverse cryosections of control (A and A′), crb11A22 (B and B′), and crb8F105 (C and C′) mosaic adult eyes carrying a copy of the GstD-GFP reporter gene. Tissues are labeled with anti-GFP (green; oxidative stress signaling marker), Phalloidin (phall, magenta) to mark rhabdomeres, and anti-Na+-K+-ATPase (white) to mark the basolateral membrane of PRCs. A–C are overlay images, whereas A′–C′ are the extracted grayscale images of the GstD-GFP channel. The GFP signal in control is detected in the tertiary pigment cells (yellow arrow) but cannot be detected in PRCs (A′). In mutant ommatidia, the GFP signal not only is increased in pigment cells (yellow arrows), but also is detected in PRCs (B′–C′) as indicated by the signal within the hexagonal outline of the ommatidium.
Figure 3.
Figure 3.
Altered oxidative stress signaling is associated with increased fatty acid hydroxylase mRNA levels and improper rhabdomere extension. (A and B) Comparison of mRNA (GstD1, A; fa2h, B) levels in wild-type (+/+) and Sod1n1 heterozygous adult heads by real-time qRT-PCR. Each replicate is shown as a dot, and lines represent mean ± SEM for fold-change in mRNA as indicated. Values are calculated after normalization with Gapdh1 mRNA and are relative to the control (+/+; level indicated by black dotted line). *, statistical significance (P < 0.05) between pairs as indicated by brackets. (C–E) Projections of confocal stacks obtained from 12-µm-thick longitudinal sections of adult eyes for genotypes indicated. Sections are labeled with Alexa Fluor 555-Phalloidin. Distal is to the left, proximal end with the retinal floor (RF) to the right. Scale bar is as indicated in E. (C′–E′) Digitally magnified areas as indicated by white dotted boxes in C–E, respectively, to show the incomplete extension of rhabdomeres in D′–E′ compared with C′. Scale bar is as indicated in E′.
Figure 4.
Figure 4.
Altering fatty acid hydroxylase levels in crb mutants modulates rhabdomere extension. (A–I) Projections of confocal stacks obtained from 12-µm-thick longitudinal sections of fly heads labeled with Alexa Fluor 555-Phalloidin to visualize F-actin in rhabdomeres and the retinal floor (RF). Overexpression and RNAi-mediated knockdown specifically in the last quarter of metamorphosis is achieved with Rh1-Gal4 (Rh1>). In the sensitized background of crb11A22 (D–F) and crb8F105 (G–I), overexpression (Rh1>fa2h; E and H) and knockdown (Rh1> fa2h RNAi; F and I) of fa2h enhances (E and H) and decreases (F and I) the mutant phenotype of rhabdomere extension. The rescue upon fa2h RNAi overexpression is more complete in crb8F105, where rhabdomeres appear leaner (I), as opposed to bulky rhabdomeres (G), and reach the retinal floor. Rhabdomere morphology is not affected by overexpression (B) or knockdown (C) of fa2h in a control (+/+) background. Scale bar is as indicated in C. (J) Comparison of mRNA levels in adult eyes by real-time qRT-PCR. Each replicate is shown as a dot, and lines represent mean ± SEM for fold-change in mRNA as indicated. Values are calculated after normalization with Gapdh1 mRNA and are relative to the control (w*; level indicated by black dotted line). (K–M′) Representative examples of optical sections of rhabdomeres from distal (K–M) and proximal (K’-M’) regions from 12-µm-thick transverse sections of the retina, labeled with Phalloidin (magenta). In the distal regions, the rhabdomeres appear wider in crb8F105 (L), and upon knockdown of fa2h (M). Proximally, the extension defect in crb8F105 (L′) is evident as smaller (white asterisk) or absent rhabdomeres (yellow asterisk). These defects are rescued upon knocking down fa2h in this genetic background (M′). (N) Box plot showing the range of rhabdomeric extension within each group (sample size of at least three eyes) for each genotype. 100 = full extension to the retinal floor. Each replicate is indicated by a dot, and the minimum and maximum values are indicated by the whiskers of the boxplot. n.s., not significant; ** (P < 0.001) and * (P < 0.05) indicate significant differences between population medians (brackets).
Figure 5.
Figure 5.
Rhodopsin reduction results in abnormal rhabdomere extension. (A–D) Representative images of optical sections (A and C) and projections (B and D) of 12-µm-thick transverse (A and C) and longitudinal (B and D) sections of control (A and B) and ninaE7 (C and D) fly eyes, labeled with Alexa Fluor 555-Phalloidin (magenta; A–D) and an antibody against Rh1 (cyan; A and C). White arrowheads in A indicate Rh1 localized in a thin crescent in the inner rim of the rhabdomeres. Consistent with previous reports, Rh1 immunostaining does not fill the entire rhabdomere. This has been attributed to the inaccessibility of the antibody inside the tightly packed microvilli and light activation of phototransduction (Schopf et al., 2019). Rh1 staining is substantially reduced in rhabdomeres of mutant PRCs (ninaE7, C). Yellow bracket in D denotes the incomplete extension of rhabdomeres of ninaE7 mutant PRCs (D) compared with genetic control (B). (E–H′) Representative images of optical sections (E and G) and projections (F and H) of 12-µm-thick transverse (E and G) and longitudinal (F–H) sections of fly eyes (wild-type, +/+) raised on standard food (+ carotenoid, E and F) or carotenoid-depleted food (carotenoid deficient, G and H). F′ and H′ are digitally magnified images of the white dotted boxes indicated in F and H, respectively. Sections are labeled with Phalloidin (magenta; E–H) and an antibody against Rh1 (cyan; E and G). White arrowheads (E) indicate Rh1 in the thin crescent in the inner rim of the rhabdomeres. In rhabdomeres of flies raised in carotenoid-depleted food, Rh1 in the rhabdomere is substantially reduced, while opsin accumulates in the ER compartment surrounding the nucleus (asterisk). Note that rhabdomeres of flies raised on carotenoid-depleted food do not reach the retinal floor (white arrowhead in H′). Scale bar for transverse sections is as indicated in A and for longitudinal sections as indicated in B. (I–L) Representative images of optical sections (I and K) and projections (J and L) of 12-µm-thick distal transverse (I and K) and longitudinal (J and L) sections, prepared from crb11A22 mosaic eyes from flies raised on either standard food (+ carotenoid, I and J) or carotenoid-depleted food (carotenoid-deficient, K and L). Sections were labeled with Alexa Fluor 555-Phalloidin (magenta). Upon carotenoid depletion, rhabdomeres of crb mutant PRCs are not as thick (K) as those of flies raised on normal food (I); yellow double-headed arrows denote the thickness of the rhabdomere. Yellow brackets indicate incomplete extension of rhabdomeres along the proximodistal axis. Scale bar for transverse sections is as indicated in I and for longitudinal sections as indicated in J.
Figure S4.
Figure S4.
Rh1 localization at steady state. (A–F) Projections of confocal stacks obtained from 12-µm horizontal sections (A–C′) and 1-µm optical sections from 12-µm cross sections (D–F) of adult fly heads of indicated genotypes, labeled with Alexa Fluor 555-Phalloidin (magenta), to visualize F-actin, and an antibody against Rh1 (cyan). Note increased cytoplasmic, Rh1-positive punctae upon fa2h overexpression (B′ and E) and more rhabdomeric Rh1 staining upon knocking down fa2h (C′ and F) in a mutant background. (G) Graph representing percentage change of normalized Rh1 levels (mean ± SEM) in adult heads, following normalization to loading control Tubulin, obtained from Western blots of controls (UAS fa2h/+; gray) and upon fa2h overexpression (Rh1>fa2h; blue). Sample size = five independent biological replicates of five heads each.
Figure 6.
Figure 6.
fa2h overexpression results in reduced Rh1 in rhabdomeres. (A–D′) Images from BLICS assays. Representative images of optical cross sections of 12-µm-thick transverse sections of control eyes (UAS fa2h/+; A, A′, C, and C′) and eyes overexpressing fa2h (Rh1>fa2h; B, B′, D, and D′) double labeled with Alexa Fluor 555-Phalloidin (magenta) and an antibody against Rh1 (cyan). A′–D′ are the Rh1/cyan channels from A–D, respectively. Images were taken from flies at t = 0 (before retinal supplementation; A–B′) and t = 180 min (180') after exposure to blue light and with retinal supplementation (C–D′). In the absence of dietary carotenoids, opsin remains in the ER surrounding the nucleus (white asterisk). 180 min after BLICS, Rh1 is clearly visible in rhabdomeres in control eyes (white arrowhead, C–C′). Upon fa2h overexpression, some rhabdomeres have decreased Rh1 staining (orange arrowheads in D and D′). Scale bar is indicated in D′. (E–F") Representative images of optical slices from confocal stacks of 12-µm-thick longitudinal sections of control eyes (UAS fa2h/+; E–E") and eyes overexpressing fa2h (Rh1>fa2h; F–F") at t = 180' after exposure to blue light and with retinal supplementation. Sections are triple labeled with Alexa Fluor 555-Phalloidin (magenta, not shown here) and antibodies against Rh1 (cyan) and Rab11 (gray). Overlays of the cyan and gray channels are shown in E and F, whereas single-channel images for Rh1 and Rab11 are shown in E′/F′ and E"/F", respectively. Rh1-positive structures that overlap with Rab11-positive structures are indicated with orange arrowheads in E–F". (G) Graph representing percentage overlap (mean ± SEM, at least three biological replicates) of sub-rhabdomeric Rh1- and Rab11-positive structures along the rhabdomere length obtained after applying BLICS assays (t = 0 and 180 min after blue light exposure and with retinal supplementation) in control retinas (UAS fa2h/+) and retinas after fa2h overexpression (Rh1> fa2h). The extent of Rh1 and Rab11 overlap is computed from confocal images of fly eye sections labeled with antibodies against Rh1 and Rab11 (examples provided in E–F"). Control eyes (gray) show a statistically significant increase in the extent of overlap in these two structures upon release of Rh1 trafficking (+ all trans retinal and blue light). In comparison, upon fa2h overexpression, there is no difference in extent of overlap between Rh1 and Rab11 upon release of Rh1 trafficking. n.s., no significant difference; ***, significant difference (P < 0.001).
Figure S5.
Figure S5.
Rh1-Rab11 overlap following BLICS assays. (A–D) A and B are projected overlays of 12-µm sections of fly eyes labeled with phalloidin and antibodies against Rh1 and Rab11 following 180 min of BLICS. C and D are representative optical slices from the projections shown in A and B, respectively, after application of the ComDet plugin for quantification. Red outlines are the Rh1-positive structures outside the rhabdomere (not overlapping with phalloidin staining), whereas yellow outlines are a subset of these Rh1-positive structures that overlap with Rab11-positive structures. (E and F) Graphs representing the number (no.) of sub-rhabdomeric Rh1-positive (E) and Rab1l-positive (F) structures along the rhabdomere length, obtained from BLICS assays (t = 0 and 180 min after blue light exposure and with retinal supplementation) in control (gray) and upon fa2h overexpression (blue). The number of structures is estimated from confocal images of fly eye sections labeled with antibodies against Rh1 and Rab11. (G) Image showing a single optical cross section of a mosaic crb11A22 adult eye double labeled with Alexa Fluor 555-Phalloidin (magenta) and an antibody against Rh1 (cyan) at t = 180 min (180') after blue light exposure and with retinal supplementation. (G′) Extracted Rh1 channel in grayscale of the image shown in G. Yellow dashed line demarcates the wild-type and mutant clones. BLICS assays reveal that in wild-type photoreceptor cells at this time point, Rh1 is visible in the perinuclear ER (white asterisk) and as a crescent staining in the rhabdomere (white arrowhead). However, in mutant rhabdomeres, easily identified by their abnormal morphology (orange arrowheads), less Rh1 is detected in the rhabdomere. Scale bar is as indicated in G. (H) Graph representing percent overlap (mean ± SEM) of sub-rhabdomeric Rh1- and Rab11-positive structures, along the rhabdomere length, obtained by BLICS assays (t = 0 and 180 min after blue light exposure and with retinal supplementation) in mosaic crb11A22 adult eyes. In mutant PRCs, no difference in extent of overlap between Rh1 and Rab11 following BLICS is observed, implying a restriction on delivery of Rh1 to the rhabdomeres.

References

    1. Apodaca, G. 2018. Role of Polarity Proteins in the Generation and Organization of Apical Surface Protrusions. Cold Spring Harb. Perspect. Biol. 10. a027813. 10.1101/cshperspect.a027813 - DOI - PMC - PubMed
    1. Arikawa, K., Hicks J.L., and Williams D.S.. 1990. Identification of actin filaments in the rhabdomeral microvilli of Drosophila photoreceptors. J. Cell Biol. 110:1993–1998. 10.1083/jcb.110.6.1993 - DOI - PMC - PubMed
    1. Baumann, O. 2004. Spatial pattern of nonmuscle myosin-II distribution during the development of the Drosophila compound eye and implications for retinal morphogenesis. Dev. Biol. 269:519–533. 10.1016/j.ydbio.2004.01.047 - DOI - PubMed
    1. Beronja, S., Laprise P., Papoulas O., Pellikka M., Sisson J., and Tepass U.. 2005. Essential function of Drosophila Sec6 in apical exocytosis of epithelial photoreceptor cells. J. Cell Biol. 169:635–646. 10.1083/jcb.200410081 - DOI - PMC - PubMed
    1. Cagan, R.L., and Ready D.F.. 1989. The emergence of order in the Drosophila pupal retina. Dev. Biol. 136:346–362. 10.1016/0012-1606(89)90261-3 - DOI - PubMed

Publication types

MeSH terms