. 2020 Nov;19(11):e13247.
doi: 10.1111/acel.13247. Epub 2020 Oct 13.

Increased marrow adipogenesis does not contribute to age-dependent appendicular bone loss in female mice

Affiliations

Increased marrow adipogenesis does not contribute to age-dependent appendicular bone loss in female mice

Maria Almeida et al. Aging Cell. 2020 Nov.

Abstract

Marrow adipocytes and osteoblasts differentiate from common mesenchymal progenitors in a mutually exclusive manner, and diversion of these progenitors toward adipocytes in old age has been proposed to account for the decline in osteoblasts and the development of involutional osteoporosis. This idea has been supported by evidence that thiazolidinedione (TZD)-induced activation of PPARγ, the transcription factor required for adipocyte differentiation, increases marrow fat and causes bone loss. We functionally tested this hypothesis using C57BL/6J mice with conditional deletion of PPARγ from early mesenchymal progenitors targeted by the Prx1-Cre transgene. Using a longitudinal littermate-controlled study design, we observed that PPARγ is indispensable for TZD-induced increase in marrow adipocytes in 6-month-old male mice, and age-associated increase in marrow adipocytes in 22-month-old female mice. In contrast, PPARγ is dispensable for the loss of cortical and trabecular bone caused by TZD or old age. Instead, PPARγ restrains age-dependent development of cortical porosity. These findings do not support the long-standing hypothesis that increased marrow adipocyte differentiation contributes to bone loss in old age but reveal a novel role of mesenchymal cell PPARγ in the maintenance of cortical integrity.

Keywords: PPARγ; aging; osteoblasts; osteoporosis; porosity; rosiglitazone.


Conflict of interest statement

D.Z. is co‐founder and advisor to Unity Biotechnology, which develops small‐molecule senolytic drugs for age‐related disease. The other authors have no conflicts.

Figures

Figure 1
Figure 1
Deletion of PPARγ from mesenchymal cells has no effect on femoral cortical or trabecular bone in 3 month‐old mice. (a) PPARγ gene number levels in humeral cortical bone of control (n = 17) and PPARγΔPrx1 mice (n = 15) males. Data were analyzed by t test. (b) Alizarin red staining of the mineralized matrix in bone marrow stromal cells cultured from 6‐month‐old male control mice or PPARγΔPrx1 mice. (c) Total body weight, (d) BMD determined by dual‐energy X‐ray absorptiometry (DXA), and (e‐f) bone architecture by micro‐CT, of 3‐month‐old female control (n = 11) and PPARγΔPrx1 mice (n = 9), and 3‐month‐old male mice (n = 9 and 7, respectively). Data were analyzed by 2‐way ANOVA
Figure 2
Figure 2
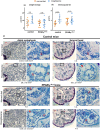
Deletion of PPARγ prevents rosiglitazone‐induced weight gain and peripheral and marrow adiposity. (a) Percent change in total body weight and (b) total interscapular fat in 6‐month‐old male mice. Controls fed normal (n = 10) or rosiglitazone (n = 11) diet; PPARγΔPrx1 mice fed normal (n = 14) or rosiglitazone (n = 15) diet. Data were analyzed by 2‐way ANOVA. (c) Photomicrographs of femoral bone longitudinal sections stained with toluidine blue. Boxes denote the region of high power image shown to the right, observed with phase illumination. Filled red arrows denote adipocytes, and open red arrows mark capillaries and vascular sinuses that contain red blood cells. Bar = 100 µm in low power images and 25 µm in high power images. Histomorphometric measurements of marrow adipocyte content are shown at the bottom of each group expressed as Ad.N per mm2 of marrow area, (n = 5/group), n.d., none detected
Figure 3
Figure 3
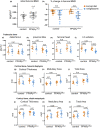
Deletion of PPARγ does not affect the magnitude of rosiglitazone‐induced loss of bone mass. (a) Baseline BMD of 4‐mo‐old male control (n = 22) and PPARγΔPrx1 (n = 27) mice. Data analyzed by Student’s t test. (b) Rosiglitazone‐induced change in BMD in control mice fed normal diet (n = 11) or rosiglitazone (n = 11), and in PPARγΔPrx1 mice fed normal diet (n = 13) or rosiglitazone (n = 14). Data analyzed by 2‐way RMANOVA. (c‐l) Micro‐CT measurements of indicated bones. Data analyzed by 2‐way ANOVA
Figure 4
Figure 4
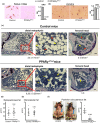
Deletion of PPARγ prevents marrow adiposity and accumulation of subcutaneous fat in aged mice. (a‐b) Oil red O staining to visualize (right panel) and quantify (left panel) adipogenesis in bone marrow stromal cell cultures from the indicated bones of 22‐month‐old female mice. Bars depict mean ± SD (c) Photomicrographs of histologic sections of the distal metaphysis of the femur near remnants of the growth plate (gp) (left and middle panels) and of the femoral head (right panels). White arrows mark sites of cortical porosity. Histomorphometric measurements of marrow adipocyte content are shown (Ad.N/mm2) n = 4/group, n.d. none detected). Red arrows indicate adipocytes, and yellow arrows indicate sinusoids containing red blood cells and granulocytes. Black bar = 100 µm (left and right panels) or 40 µm (middle panels). (d‐f) Weight of fat depots in 22‐month‐old female mice. (f) Appearance and weight of posterior subcutaneous fat. Data were analyzed by Students t test
Figure 5
Figure 5
Deletion of PPARγ does not prevent age‐dependent loss of bone mass, but increases bone size. (a) Loss of femoral BMD with age in female control (n = 22) and PPAR∆Prx1 mice (n = 25). Data shown are mean ± SD; analyzed by RMANOVA. (b) Left panel, representative micro‐CT images of the femoral head in control mice. Right panel, BV/TV of the femoral head of 6‐ and 22‐month‐old control (n = 3, 13) and PPARγΔPrx1 mice (n = 7, 15). Some femoral heads were lost during dissection. (c‐e) Micro‐CT analysis of femoral diaphysis of 6‐ and 22‐month‐old control (n = 7, 14) and PPARγΔPrx1 mice (n = 8, 17). Data analyzed by 2‐way ANOVA
Figure 6
Figure 6
Deletion of PPARγ intensifies age‐dependent cortical porosity. (a) Cross‐sectional micro‐CT images of the femoral metaphysis from 22‐month‐old mice used to score cortical integrity: 1 = no porosity and intact endosteum; 2 = porosity with intact endosteum; 3 = porosity with moderate loss of the endosteal boundary; 4 = extensive porosity with loss of the endosteal boundary. (b) Cortical integrity score of 6‐ and 22‐month‐old control (n = 7, 13) and PPARγΔPrx1 mice (n = 8, 17). (c) Representative micro‐CT images of cortex comprising a 0.6 mm section of bone of the proximal third of the distal femoral metaphysis depicting cortical porosity (arrows), which was (d) quantified by micro‐CT. (e) Representative photomicrographs of distal femur to visualize cortical porosity; TRAPase (red arrowhead) and cement lines stained with toluidine blue (black arrowheads). Bar = 20 µm. (f) Calcein labeling (white arrowheads) in fluorescence images of unstained sections. Bar = 100 µm. Data were analyzed by 2‐way ANOVA on Ranks
Figure 7
Figure 7
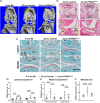
Deletion of PPARγ attenuates age‐associated osteoarthritis. (a). Representative micro‐CT reconstructions of knees in the mid‐coronal plane. White arrows indicate subarticular cortical bone, and yellow arrows mark porous cortical bone. (b) Sagittal sections of knees stained with H&E. ACL, anterior cruciate ligament; Ad, adipose tissue; Fb, fibrous tissue; IFP, infrapatellar fat pad; PT, patellar tendon. (c) Safranin O/Fast Green staining of knee joints. (d‐f) OARSI scoring in (d) lateral compartments of 6‐month‐old B6 (n = 9), 22‐month‐old control (n = 8) and PPARγΔPrx1 littermates (n = 7), (e) medial compartments (n = 5, 7, 7, respectively), and (f) the sum of all four compartments (n = 5, 7, 7, respectively). Some medial compartments could not be scored due to persistent sectioning artifacts. Bars = 500 μm. Data were analyzed by ANOVA on Ranks

References

    1. Akune, T. , Ohba, S. , Kamekura, S. , Yamaguchi, M. , Chung, U. , Kubota, N. , Terauchi, Y. , Harada, Y. , Azuma, Y. , Nakamura, K. , Kadowaki, T. , & Kawaguchi, H. (2004). PPARγ insufficiency enhances osteogenesis through osteoblast formation from bone marrow progenitors. Journal of Clinical Investigation, 113(6), 846–855. - PMC - PubMed
    1. Ali, A. A. , Weinstein, R. S. , Stewart, S. A. , Parfitt, A. M. , Manolagas, S. C. , & Jilka, R. L. (2005). Rosiglitazone causes bone loss in mice by suppressing osteoblast differentiation and bone formation. Endocrinology, 146(3), 1226–1235. - PubMed
    1. Almeida, M. , Ambrogini, E. , Han, L. , Manolagas, S. C. , & Jilka, R. L. (2009). Increased lipid oxidation causes oxidative stress, increased PPAR{gamma} expression and diminished pro‐osteogenic Wnt signaling in the skeleton. Journal of Biological Chemistry, 284(40), 27438–27448. - PMC - PubMed
    1. Almeida, M. , Iyer, S. , Martin‐Millan, M. , Bartell, S. M. , Han, L. , Ambrogini, E ., Onal, M. , Xiong, J. , Weinstein, R. S. , Jilka, R. L. , O'Brien, C. A. & Manolagas, S. C. (2013). Estrogen receptor‐alpha signaling in osteoblast progenitors stimulates cortical bone accrual. Journal of Clinical Investigation, 123(1), 394–404. 10.1172/JCI65910 - DOI - PMC - PubMed
    1. Ambrosi, T. H. , Scialdone, A. , Graja, A. , Gohlke, S. , Jank, A. M. , Bocian, C. , Woelk, L. , Fan, H. , Logan, D. W. , Schürmann, A. , Saraiva, L. R. , & Schulz, T. J. (2017). Adipocyte accumulation in the bone marrow during obesity and aging impairs stem cell‐based hematopoietic and bone regeneration. Cell Stem Cell, 20(6), 771–784 e776. 10.1016/j.stem.2017.02.009 - DOI - PMC - PubMed

Publication types

LinkOut - more resources