. 2020 Oct 13;16(10):e1008994.
doi: 10.1371/journal.ppat.1008994. eCollection 2020 Oct.

IL-27 signalling regulates glycolysis in Th1 cells to limit immunopathology during infection

Affiliations

IL-27 signalling regulates glycolysis in Th1 cells to limit immunopathology during infection

Marcela Montes de Oca et al. PLoS Pathog. .

Abstract

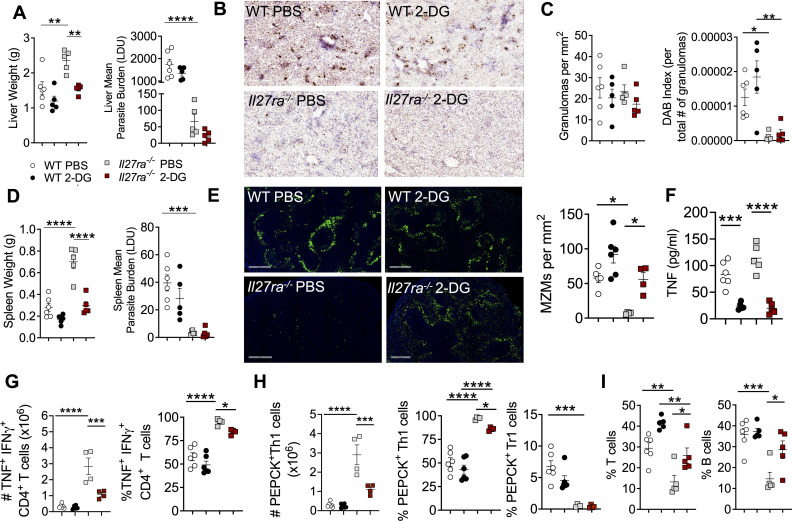
Inflammation is critical for controlling pathogens, but also responsible for symptoms of infectious diseases. IL-27 is an important regulator of inflammation and can limit development of IFNγ-producing Tbet+ CD4+ T (Th1) cells. IL-27 is thought to do this by stimulating IL-10 production by CD4+ T cells, but the underlying mechanisms of these immunoregulatory pathways are not clear. Here we studied the role of IL-27 signalling in experimental visceral leishmaniasis (VL) caused by infection of C57BL/6 mice with the human pathogen Leishmania donovani. We found IL-27 signalling was critical for the development of IL-10-producing Th1 (Tr1) cells during infection. Furthermore, in the absence of IL-27 signalling, there was improved control of parasite growth, but accelerated splenic pathology characterised by the loss of marginal zone macrophages. Critically, we discovered that IL-27 signalling limited glycolysis in Th1 cells during infection that in turn attenuated inflammation. Furthermore, the modulation of glycolysis in the absence of IL-27 signalling restricted tissue pathology without compromising anti-parasitic immunity. Together, these findings identify a novel mechanism by which IL-27 mediates immune regulation during disease by regulating cellular metabolism.


Conflict of interest statement

The authors have declared that no competing interests exist.

Figures

Fig 1
Fig 1. IL-27 signalling impedes control of parasite growth and determines the balance between Th1 and Tr1 cells during infection.
WT and Il27ra-/- mice were infected with 2x10⁷ L. donovani amastigotes i.v.. Organ pathology, parasite burdens and cellular immune responses were measured in both the spleen (A) and liver 14 days p.i. (B). (A) Left to right: spleen weights shown in grams (g). Parasite burdens in the spleen were expressed by Leishman Donovan Units (LDU) where organ weight is multiplied by the number of parasites per 1000 nuclei in each organ. CD4+ T cell numbers were measured by flow cytometry as CD4+ TCRβ+. Antigen specific CD4+ T cell numbers defined as CD44+ PEPCK+. Antigen specific Th1 cell numbers defined as CD44+ PEPCK+ Tbet+ IFNγ+. Antigen specific Tr1 cell numbers defined as CD44+ PEPCK+ IL-10+ IFNγ+. (B) Left to right: liver weights shown in grams (g). Parasite burdens in the liver were expressed by Leishman Donovan Units (LDU). CD4+ T cell numbers are shown. Antigen specific CD4+ T cell numbers are shown. Antigen specific Th1 cell numbers are shown. Antigen specific Tr1 cell numbers are shown. (C) Splenocytes were cultured with or without the presence of L. donovani antigen and cytokines in culture supernatants were measured by CBA, 72 hours post re-stimulation. (D) WT (n = 22) and Il27ra-/- (n = 19); Correlation of antigen-specific Th1 cells and antigen-specific Tr1 cells in the spleens of WT and Il27ra-/- mice at day 14 p.i. shown by linear regression analysis. Data shown is representative of 3 independent experiments performed with n = 6–7 mice per group, in each experiment and are presented as mean ± SEM, **p<0.01, Mann-Whitney U test.
Fig 2
Fig 2. IL-27 signalling protects splenic architecture against TNF-mediated pathology during infection.
(A) WT and Il27ra-/- mice were infected with 2x10⁷ L. donovani amastigotes i.v.. Mice were injected with 100μg of FITC dextran (in saline) i.v. and euthanized 2 hours later. Spleens harvested on day 0 and day 14 p.i.. (B) Marginal zone macrophages were quantified in 20μM thick sections using Metamorph software as total number of marginal zone macrophages (MZMs) per millimetre squared, normalised to total spleen weight and to total splenocyte counts. Scale bar: 500μM. Data shown is representative of 2 independent experiments performed with n = 4–7 mice per group, in each experiment and are presented as mean ± SEM, **p<0.01, Mann-Whitney U test.
Fig 3
Fig 3. IL-27 signalling mediates mitochondrial changes in the spleen but not the liver during infection.
(A, E) WT and Il27ra-/- mice were infected with 2x10⁷ L. donovani amastigotes i.v.. Spleen and liver cells were harvested and stained for CD4, TCRβ, CXCR3 and CXCR5 along with MitoTracker Green (volume), MitoTracker DeepRed (membrane potential) and MitoSOX (mitochondrial ROS) to assess mitochondria in CD4+ T cells by flow cytometry. All plots are gated on CD4+ T cells. MTDRhi (black gate and histogram), MTDRlo (blue gate and histogram). CD4+ T cells defined as CD4+ TCRβ+ and Th1 cells defined as CD4+ TCRβ+ CXCR3+ CXCR5- (B, F) Mitochondrial mass and membrane potential are shown as MitoTracker Green+ MitoTracker DeepRed+ on CD4+ T cells and Th1 cells at day 14 p.i.. (C, G) Mitochondrial Reactive Oxygen Species (mROS) measured by flow cytometry on CD4+ T cells and Th1 cells at day 14 p.i.. (D, H) Forward (FSC-A) and size scatter (SSC-A) histogram plots, WT (grey) and Il27ra-/- (red). Data shown is representative of 2 independent experiments performed with n = 5–7 mice per group, in each experiment and are presented as mean ± SEM, **p<0.01, *p<0.05, Mann-Whitney U test.
Fig 4
Fig 4. Th1 cells are more glycolytic than Tr1 cells in vivo during infection.
WT and Il27ra-/- mice were infected with 2x10⁷ L. donovani amastigotes i.v.. Splenic and hepatic CD4+ T cells were MACS purified and assayed on the Seahorse XF96 using the glycolysis stress test kit at day 14 p.i. ex vivo. Total extracellular acidification rate (ECAR) was assessed after the addition of glucose, oligomycin and 2-DG at indicated times in the (A) spleen and (B) liver. Basal ECAR and maximal glycolysis (final measurement after the last oligomycin injection–final measurement after the last glucose injection) measured in the (C) spleen and (D) liver. (E) Th1:Tr1 cell ratio determined by flow cytometry. (F) Il10gfp x Ifngyfp x foxp3rfp mice were infected with 2x10⁷ L. donovani amastigotes i.v.. Splenic and hepatic CD4+ T cells were sorted on the ARIA III for Th1 (IFNγ+ IL-10-) and Tr1 (IFNγ+ IL-10+) cells 14 days p.i.. Total extracellular acidification rate (ECAR) was assessed after the addition of glucose, oligomycin and 2-DG at indicated times in the spleen and liver ex vivo. (G) Splenic CD4+ T cells MACS purified from uninfected WT and Il27ra-/- mice and polarised under Th1 conditions for 72 hours and then assayed on the Seahorse XF96. Glycolysis (ECAR) measured in all conditions. Data shown is representative of 2 independent experiments performed with n = 3–7 mice per group, in each experiment and are presented as mean ± SEM, *p<0.05, Mann-Whitney U test.
Fig 5
Fig 5. IL-27 signalling limits glycolysis in Th1 cells and protects against tissue pathology during infection.
WT and Il27ra-/- mice infected with 2x10⁷ L. donovani amastigotes i.v.. Mice were treated with PBS (controls) or 1g/kg of 2-DG daily i.p. beginning at day 7 p.i., until day 14 p.i. Organs were harvested 14 days p.i. and processed for cellular analysis. (A) Liver weights (g) and parasite burdens measured in Leishman Donovan Units (LDU: number of amastigotes per 1000 nuclei x organ weight) 14 days p.i.. (B) Liver sections (scale bars: 200μM) imaged on the Aperio XT Turbo slide scanner. (C) Total granulomas and DAB quantification (DAB index) were performed using Image J and adjusted to the section area in mm2. (D) Spleen weights (g) and parasite burdens measured in LDU 14 days p.i.. (E) Marginal zone macrophages (MZMs) were quantified in the spleen by injecting mice with 100μg of FITC dextran i.v. (scale bars: 500μΜ) and imaged of the Aperio FL slide scanner. MZMs were quantified using Metamorph per mm2. (F) TNF levels (pg/mL) measured in the serum 14 days p.i. (G) Number and frequencies of splenic CD4+ T cells co-producing IFNγ and TNF was measured by flow cytometry 14 days p.i. (H) Number and frequencies of antigen-specific Th1 and Tr1 cells was measured by flow cytometry 14 days p.i. (I) T (TCRβ+) and B (B220+ CD19+) cell frequencies measured by flow cytometry 14 days p.i. Data shown is representative of 3 independent experiments performed with n = 4–6 mice per group, in each experiment and are presented as mean ± SEM, ****p<0.0001, ***p<0.0005, **p<0.005, *p<0.05, One-Way ANOVA with Tukey’s multiple comparisons test.
Fig 6
Fig 6. Th1 cells rely on metabolic intermediates generated during glycolysis to produce pro-inflammatory cytokines.
(A) 2x10⁵ CD4+ T cells were MACS purified from the spleens and livers of L. donovani infected WT and Il27ra-/- mice at day 14 p.i. and treated with either media, or 1mM of either 2-DG or heptelidic acid (HA) for 1 hour and re-stimulated with PMA/Ionomycin in the presence of monensin for 3 hours. Red crosses show the targets of 2-DG and HA within the glycolysis pathway. (B) Frequencies of IFNγ+ TNF+ CD4+ T cells measured in the spleen by flow cytometry. (C) IFNγ+ Τbet+ (Th1) cell frequencies measured in the spleen and IFNγ expression shown as the Mean Fluorescence Intensity (MFI). (D) Frequencies of IFNγ+ TNF+ CD4+ T cells measured in the liver by flow cytometry. (E) IFNγ+ Τbet+ (Th1) cell frequencies measured in the liver and IFNγ expression shown as the Mean Fluorescence Intensity (MFI). Data shown is representative of 2 independent experiments performed with n = 5 mice per group, in each experiment and are presented as mean ± SEM, ****p<0.0001, **p<0.005, *p<0.05, Two-Way ANOVA with Sidak’s multiple comparisons test.

References

    1. Singh OP, Gidwani K, Kumar R, Nylen S, Jones SL, Boelaert M, et al. Reassessment of immune correlates in human visceral leishmaniasis as defined by cytokine release in whole blood. Clinical and vaccine immunology: CVI. 2012;19(6):961–6. 10.1128/CVI.00143-12 - DOI - PMC - PubMed
    1. Costa CH, Werneck GL, Costa DL, Holanda TA, Aguiar GB, Carvalho AS, et al. Is severe visceral leishmaniasis a systemic inflammatory response syndrome? A case control study. Revista da Sociedade Brasileira de Medicina Tropical. 2010;43(4):386–92. 10.1590/s0037-86822010000400010 - DOI - PubMed
    1. Herwaldt BL. Leishmaniasis. Lancet (London, England). 1999;354(9185):1191–9. - PubMed
    1. Burza S, Croft SL, Boelaert M. Leishmaniasis. The Lancet. 2018;392(10151):951–70. - PubMed
    1. Rosas LE, Satoskar AA, Roth KM, Keiser TL, Barbi J, Hunter C, et al. Interleukin-27R (WSX-1/T-Cell Cytokine Receptor) Gene-Deficient Mice Display Enhanced Resistance to Leishmania donovani Infection but Develop Severe Liver Immunopathology. The American Journal of Pathology. 2006;168(1):158–69. 10.2353/ajpath.2006.050013 - DOI - PMC - PubMed

Publication types