. 2021 May 5;23(5):812-826.
doi: 10.1093/neuonc/noaa225.

Association of supratotal resection with progression-free survival, malignant transformation, and overall survival in lower-grade gliomas

Affiliations

Association of supratotal resection with progression-free survival, malignant transformation, and overall survival in lower-grade gliomas

Marco Rossi et al. Neuro Oncol. .

Abstract

Background: Supratotal resection is advocated in lower-grade gliomas (LGGs) based on theoretical advantages but with limited verification of functional risk and data on oncological outcomes. We assessed the association of supratotal resection in molecularly defined LGGs with oncological outcomes.

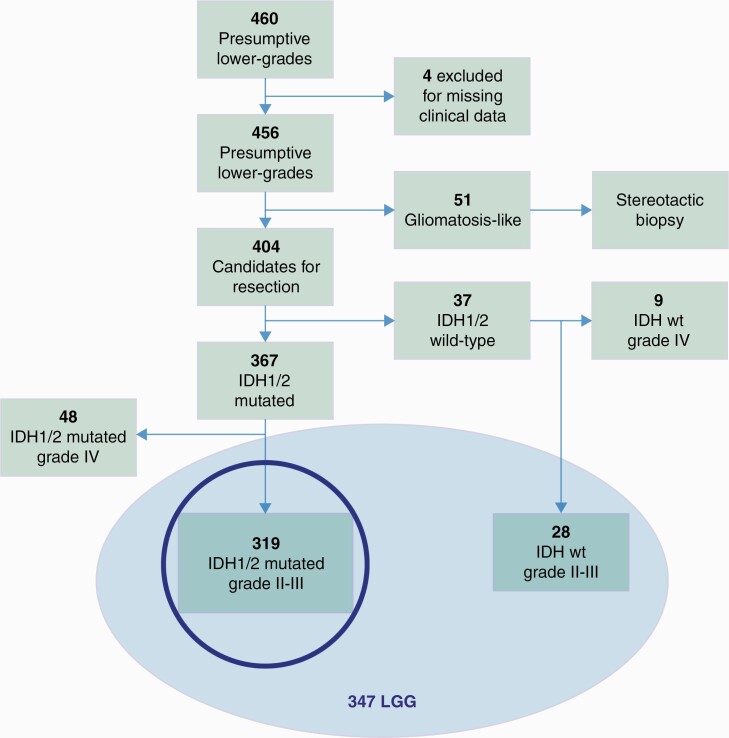
Methods: Included were 460 presumptive LGGs; 404 resected; 347 were LGGs, 319 isocitrate dehydrogenase (IDH)-mutated, 28 wildtype. All patients had clinical, imaging, and molecular data. Resection aimed at supratotal resection without any patient or tumor a priori selection. The association of extent of resection (EOR), categorized on volumetric fluid attenuated inversion recovery images as residual tumor volume, along with postsurgical management with progression-free survival (PFS), malignant (M)PFS, and overall survival (OS) assessed by univariate, multivariate, and propensity score analysis. The study mainly focused on IDH-mutated LGGs, the "typical LGGs."

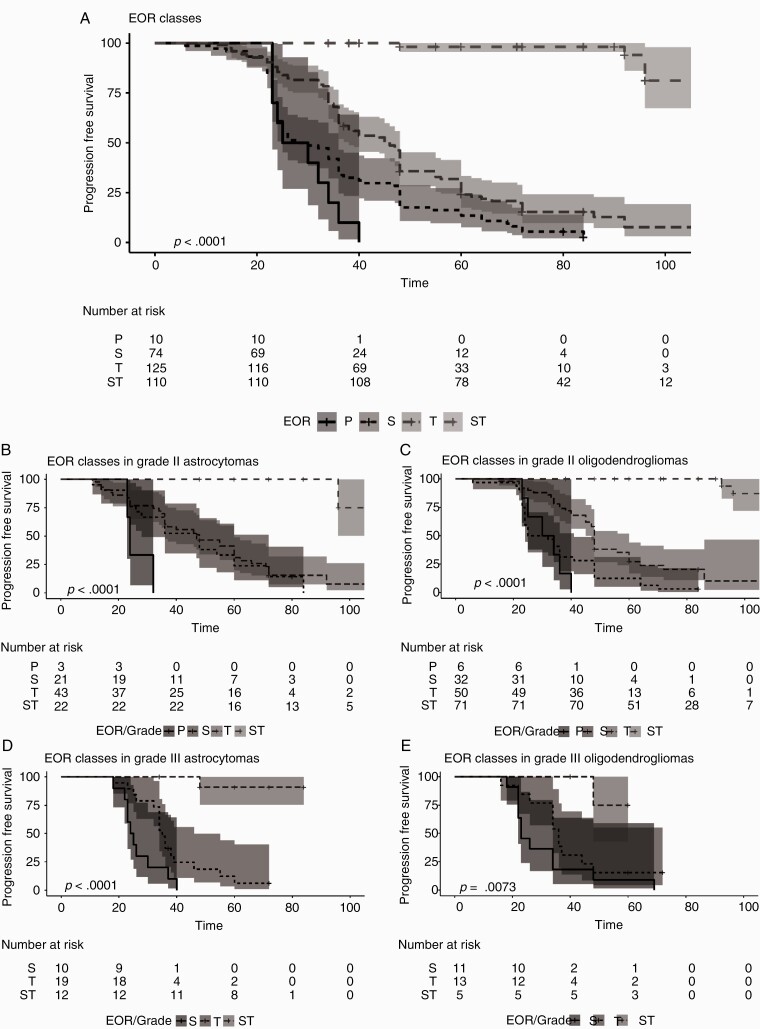
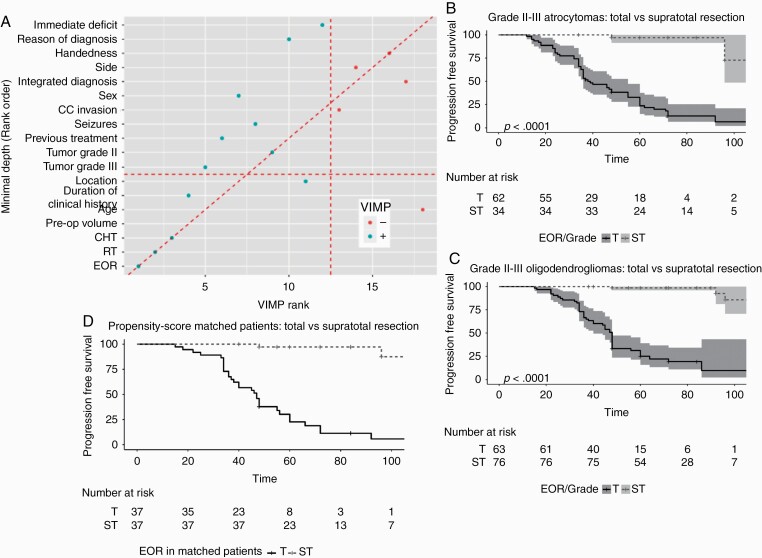
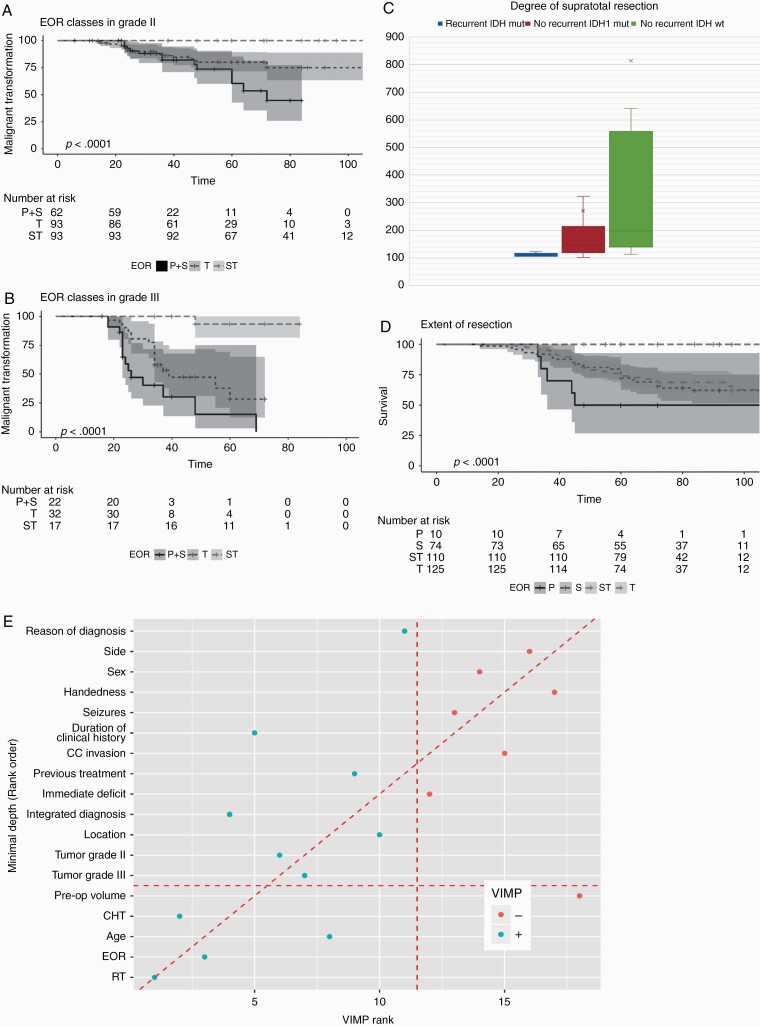
Results: Median follow-up was 6.8 years (interquartile range, 5-8). Out of 319 IDH-mutated LGGs, 190 (59.6%) progressed, median PFS: 4.7 years (95% CI: 4-5.3). Total and supratotal resection obtained in 39% and 35% of patients with IDH1-mutated tumors. In IDH-mutated tumors, most patients in the partial/subtotal group progressed, 82.4% in total, only 6 (5.4%) in supratotal. Median PFS was 29 months (95% CI: 25-36) in subtotal, 46 months (95% CI: 38-48) in total, while at 92 months, PFS in supratotal was 94.0%. There was no association with molecular subtypes and grade. At random forest analysis, PFS strongly associated with EOR, radiotherapy, and previous treatment. In the propensity score analysis, EOR associated with PFS (hazard ratio, 0.03; 95% CI: 0.01-0.13). MPFS occurred in 32.1% of subtotal total groups; 1 event in supratotal. EOR, grade III, previous treatment correlated to MPFS. At random forest analysis, OS associated with EOR as well.

Conclusions: Supratotal resection strongly associated with PFS, MPFS, and OS in LGGs, regardless of molecular subtypes and grade, right from the beginning of clinical presentation.

Keywords: lower-grade gliomas; malignant progression-free survival; overall survival; progression-free survival; supratotal resection.


Figures

Fig. 1
Fig. 1
Data flow diagram for the retrospective cohort; the study mainly focuses on IDH-mutated LGGs (highlighted with a circle).
Fig. 2
Fig. 2
Kaplan Meier curves for PFS for EOR classes, and in molecular and tumor grade defined subtypes. (A) Kaplan‒Meier curves and number at risk for PFS and EOR classes. The analysis includes all 319 IDH-mutated LGGs. Time is expressed as months. Patients were categorized according to EOR classes. In Partial (N = 10) (black line) median PFS was 27.5 (95% CI: 23 NA) months (univariable HR, 1[reference]); in Subtotal (N = 74) (black small dotted line) was 29(95% CI: 29–25) months (univariable HR, 0.51 [95% CI: 0.26–1]; P = 0.05), in Total (N = 125) (black medium dotted line) was 46 (95% CI: 38–48) months (univariable HR, 0.27 [95% CI: 0.14–0.54]; P < 0.001); in supratotal (N = 110) (black large dotted lined) at 92 months 94% of patients had no recurrences (univariable HR, 0.01 [95% CI: 0.00–0.02]; P < 0.001). Shadings are the 95% confidence intervals. (B) Kaplan‒Meier curves and number at risk for PFS and EOR classes in IDH-mutated grade II astrocytomas. Only grade II IDH mutated astrocytomas were included (N = 89). Time is expressed as months. Patients were categorized according to EOR classes. In Partial (N = 3) (black line) median PFS was 24 (95% CI: 23 NA) months (univariable HR, 1[reference]); in Subtotal (N = 21) (black small dotted line) was 47 (95% CI: 28–72) months (univariable HR, 0.26 [95% CI: 0.07–0.94]; P = 0.04), in Total (N = 43) (black medium dotted line) was 48 (95% CI: 36–60) months (univariable HR, 0.21 [95% CI: 0.06–0.73]; P = 0.01); in supratotal (N = 22) (black large dotted lined) at 80 months 100% of patients had no recurrences months (univariable HR, 0.01 [95% CI: 0.00–0.06]; P < 0.001). Shadings are the 95% confidence intervals. (C) Kaplan‒Meier curves and number at risk for PFS and EOR classes in IDH-mutated grade II oligodendrogliomas. Only grade II IDH-mutated oligodendrogliomas were included (N = 159). Time is expressed as months. Patients were categorized according to EOR classes. In Partial (N = 6) (black line) median PFS was 32 (95% CI: 25 NA) months (univariable HR, 1[reference]); in Subtotal (N = 32) (black small dotted line) was 28.5 (95% CI: 24–41) months (univariable HR, 0.60 [95% CI: 0.25–1.48]; P = 0.27), in Total (N = 50) (black medium dotted line) was 48 (95% CI: 45–60) months (univariable HR, 0.24 [95% CI: 0.10–0.60];P = 0.002); in supratotal (N = 71) (black large dotted lined) at 80 months 100% of patients had no recurrence, at 92 months 93.8% had no recurrence months (univariable HR, 0.004 [95% CI: 0.00–0.02]; P < 0.001). Shadings are the 95% confidence intervals. (D) Kaplan‒Meier curves and number at risk for PFS and EOR classes in IDH mutated grade III astrocytomas. Only grade III IDH mutated astrocytomas were included (N = 41). Time is expressed as months. Patients were categorized according to EOR classes. In Subtotal (N = 10) (black line) was 24.5 (95% CI: 23 NA) months (univariable HR, 1 [reference]), in Total (N = 19) (black small dotted line) was 35(95% CI: 34–46) months (univariable HR, 0.35 [95% CI: 0.15–0.81]; P = 0.01); in supratotal (N = 12) (black large dotted lined) at 48 months 90% of patients had no recurrence (univariable HR, 0.01 [95% CI: 0.00–0.11]; P < 0.001). Shadings are the 95% confidence intervals. (E) Kaplan Meier curves and number at risk for PFS and EOR classes in IDH mutated grade III oligodendrogliomas. Only grade III IDH mutated oligodendrogliomas were included (N = 30). Time is expressed as months. Patients were categorized according to EOR classes. In Partial (1 case, not shown in figure and in the analysis) PFS was 23 months, in Subtotal (N = 11) (black dotted line) median PFS was 23 (95% CI: 22 NA) months (univariable HR, 1[reference]), in Total (N = 13) (black small dotted line) was 36 (95% CI: 34 NA) months (univariable HR, 0.53 [95% CI: 0.23–1.25]; P = 0.15); in supratotal (N = 5) (black large dotted lined) at 48 months 75% of patients had no recurrence (univariable HR, 0.07[95% CI: 0.01–0.58]; P = 0.01). Shadings are the 95% confidence intervals.
Fig. 3
Fig. 3
(A) Variable importance for PFS using Random.Forest in the IDH mutant LGGs. All the clinical, imaging, histomolecular and treatments (EOR, radiotherapy, chemotherapy) were considered together. VIMP and Minimal Depth are two criteria proposed in the context of random forests algorithms to evaluate variable importance in explaining the PFS. The variables on the diagonal red line are those ranked equally by the two methods. The vertical line divides variables with positive VIMP (left) from those with negative VIMP (right; unimportant). The horizontal line indicates the minimal depth threshold: important variables are below the line. PFS was mainly associated to treatments, particularly EOR and radiotherapy. The VIMP rank is reported in x-axis. The Minimal Depth (Rank Order) is in y-axis. (B) Kaplan‒Meier curve and number at risk for IDH mutated grade II III astrocytomas underwent to total vs supratotal resection (N = 96). Time is expressed as months. In Total (N = 62) (black line) was 38(95% CI: 36–55) months (univariable HR, 1 [reference]); in Supratotal (N = 34) (black dotted line) at 48 and 96 months, 97% and 72.7% respectively, of patients had no recurrence (univariable HR, 0.05 [95% CI: 0.02–0.16]; P < 0.001). Shading is the 5–95% range across distribution. (C) Kaplan‒Meier curve and number at risk for IDH-mutated grades II–III oligodendrogliomas underwent to total vs supratotal resection (N = 139). Time is expressed as months. In Total (N = 63) (black line) was 48 (95% CI: 40–48) months (univariable HR, 1 [reference]); in Supratotal (N = 76) (black dotted lined) at 48 and 96 months, 98.6% and 85.6% respectively, of patients had no recurrence (univariable HR, 0.02 [95% CI: 0.01–0.07]; P < 0.001). Shadings are the 95% confidence intervals. (D) Kaplan‒Meier curve and number at risk for the 74 IDH mutant LGGs patients of the propensity score matched group. Time is expressed as months. In Total (N = 37) (black line) was 55 (95% CI: 40–72) months (univariable HR, 1 [reference]); in Supratotal (N = 37) (black dotted line) at 96 months 87.5% of patients had no recurrence (univariable HR, 0.01 [95% CI: 0.00–0.11]; P < 0.001).
Fig. 4
Fig. 4
Malignant PFS in 319 IDH mutated LGGs patients, and degree of supratotal resection. (A) Kaplan‒Meier curve and number at risk for MPFS in IDH mutated grade II tumors according to EOR classes. Grade II tumors (N = 248) are inclusive of grade II astrocytomas and grade II oligodendrogliomas. Partial and Subtotal resection groups were merged for the analysis. Time is expressed as months. In Partial+Subtotal resection group (N = 62) (black line) median PFS was 72 (95% CI: 60 NA) months (univariable HR, 1 [reference]), in Total (N = 93) (black small dotted line) at 48 and 72 months, 80% and 75% of patients had no transformation (univariable HR, 0.59 [95% CI: 0.29–1.21]; P = 0.15); in supratotal (N = 93) (black large dotted lined) no events were recorded during the observation period (univariable HR, 0.01 [95% CI: 0.00–0.08]; P < 0.001). Shadings are the 95% confidence intervals. B) Kaplan‒Meier curve and number at risk for MPFS in IDH-mutated grade III tumors according to EOR classes. Grade III tumors (N = 71) are inclusive of grade III astrocytomas and grade III oligodendrogliomas. Partial and Subtotal resection groups were merged for the analysis. Time is expressed as months. In Partial+Subtotal resection group (N = 22) (black line) median PFS was 26 (95% CI: 23 NA) months (univariable HR, 1 [reference]), in Total (N = 32) (black small dotted line) was 39 (95% CI: 34 NA) months (univariable HR, 0.46 [95% CI: 0.22–0.94]; P = 0.03); in supratotal (N = 17) (black large dotted line) only one event at 48 months (grade III oligodendroglioma; the patient refused postsurgical treatments) was recorded during the observation period (univariable HR, 0.03 [95% CI: 0.00–0.21]; P = 0.001). Shadings are the 95% confidence intervals. (C) Degree of supratotal resection in patients who underwent progression (N = 6, IDH mutated) and in those who didn’t recur, in the IDH mutated group (N = 104) and in the IDH wt group (N = 12). Data are reported as mean and median. The degree of supratotal was lower in recurrent patients (mean 111.3%, median 107.41%;) than in those who didn’t recur (IDH mutated: mean 271.11%,median 148.775%; IDH wt: mean 818.20%,median 197.08%). (D) Kaplan‒Meier curve and number at risk for OS in IDH mutated tumors according to EOR classes. Time is expressed as months. In Partial resection group (N = 10) (black line) median OS was 45 (95% CI: 36 NA) months (univariable HR, 1 [reference]), in Subtotal (N = 74) (black small dotted line) and in Total (N = 125) (black large dotted line) at 45 months, 83.8% (95% CI: 0.75–0.92) and 83.2% (95% CI: 0.76–0.90) of patients were alive; in supratotal (N = 110) (black large dotted lined) no deaths were recorded during the observation period (univariable HR, 0.01 [95% CI: 0.00–0.08]; P < 0.001). Shadings are the 95% confidence intervals. (E) Variable importance for OS using Random Forest in the IDH mutated LGGs. All the clinical, imaging, histomolecular and treatments (EOR, radiotherapy, chemotherapy) were considered together. VIMP and Minimal Depth are two criteria proposed in the context of random forests algorithms to evaluate variable importance in explaining the OS. The variables on the diagonal red line are those ranked equally by the two methods. The vertical line divides variables with positive VIMP (left) from those with negative VIMP (right; unimportant). The horizontal line indicates the minimal depth threshold: important variables are below the line. OS was mainly associated to treatments, particularly radiotherapy and EOR. The VIMP rank is reported in x-axis. The Minimal Depth (Rank Order) is in y-axis.

References

    1. Reuss DE, Mamatjan Y, Schrimpf D, et al. . IDH mutant diffuse and anaplastic astrocytomas have similar age at presentation and little difference in survival: a grading problem for WHO. Acta Neuropathol. 2015;129(6):867–873. - PMC - PubMed
    1. Buckner J, Giannini C, Eckel-Passow J, et al. . Management of diffuse low-grade gliomas in adults—use of molecular diagnostics. Nat Rev Neurol. 2017;13(6):340–351. - PubMed
    1. Schiff D, Van den Bent M, Vogelbaum MA, et al. . Recent developments and future directions in adult lower-grade gliomas: Society for Neuro-Oncology (SNO) and European Association of Neuro-Oncology (EANO) consensus. Neuro Oncol. 2019;21(7):837–853. - PMC - PubMed
    1. Jakola AS, Myrmel KS, Kloster R, et al. . Comparison of a strategy favoring early surgical resection vs a strategy favoring watchful waiting in low-grade gliomas. JAMA. 2012;308(18):1881–1888. - PubMed
    1. Jakola AS, Skjulsvik AJ, Myrmel KS, et al. . Surgical resection versus watchful waiting in low-grade gliomas. Ann Oncol. 2017;28(8):1942–1948. - PMC - PubMed

Publication types

Substances