. 2020 Nov;19(11):e13166.
doi: 10.1111/acel.13166. Epub 2020 Oct 13.

Age-induced mitochondrial DNA point mutations are inadequate to alter metabolic homeostasis in response to nutrient challenge

Affiliations

Age-induced mitochondrial DNA point mutations are inadequate to alter metabolic homeostasis in response to nutrient challenge

Timothy M Moore et al. Aging Cell. 2020 Nov.

Abstract

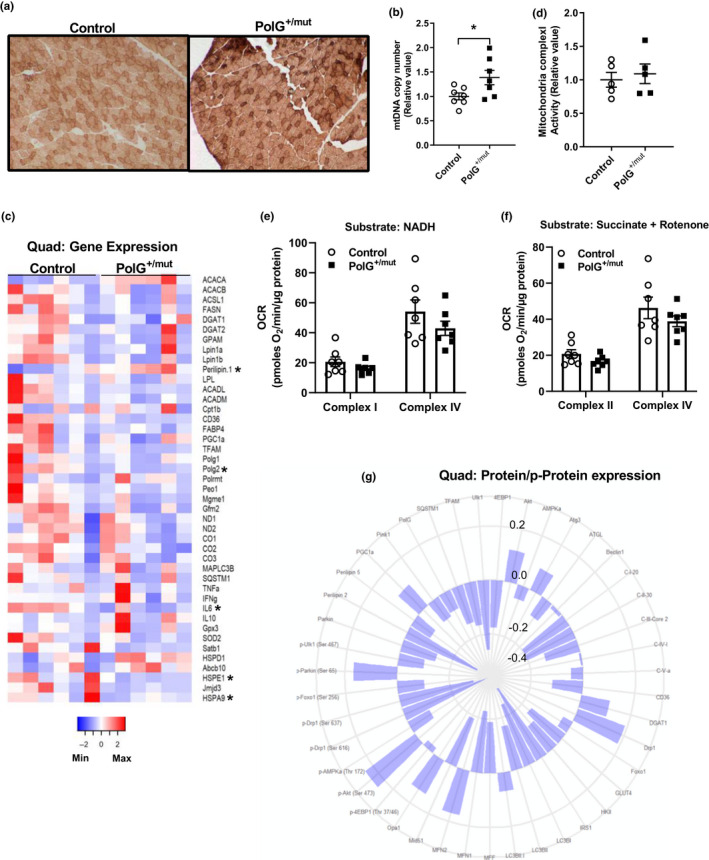
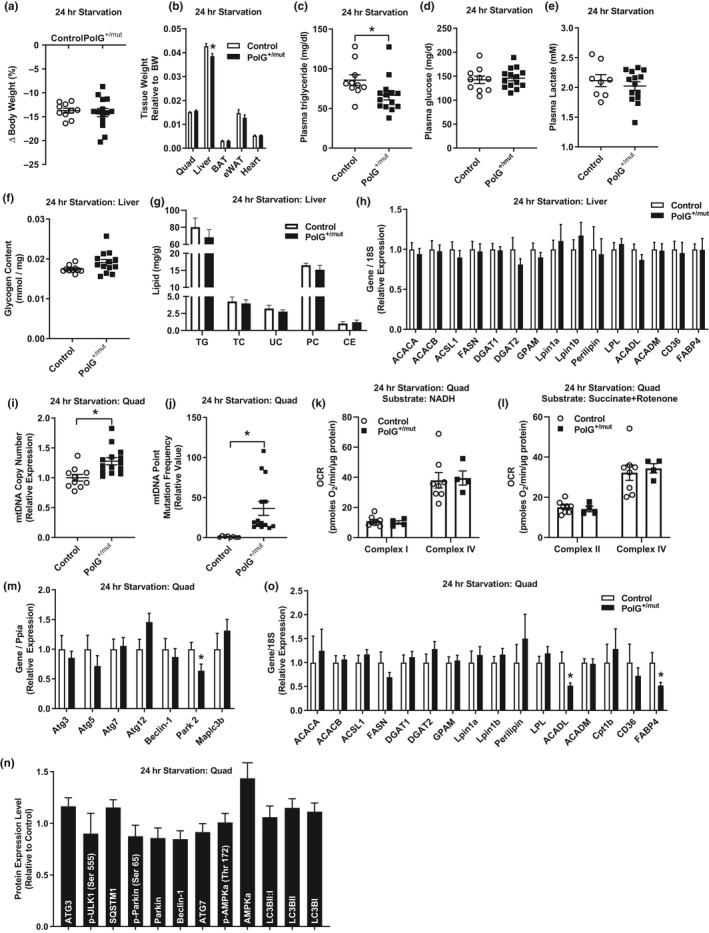
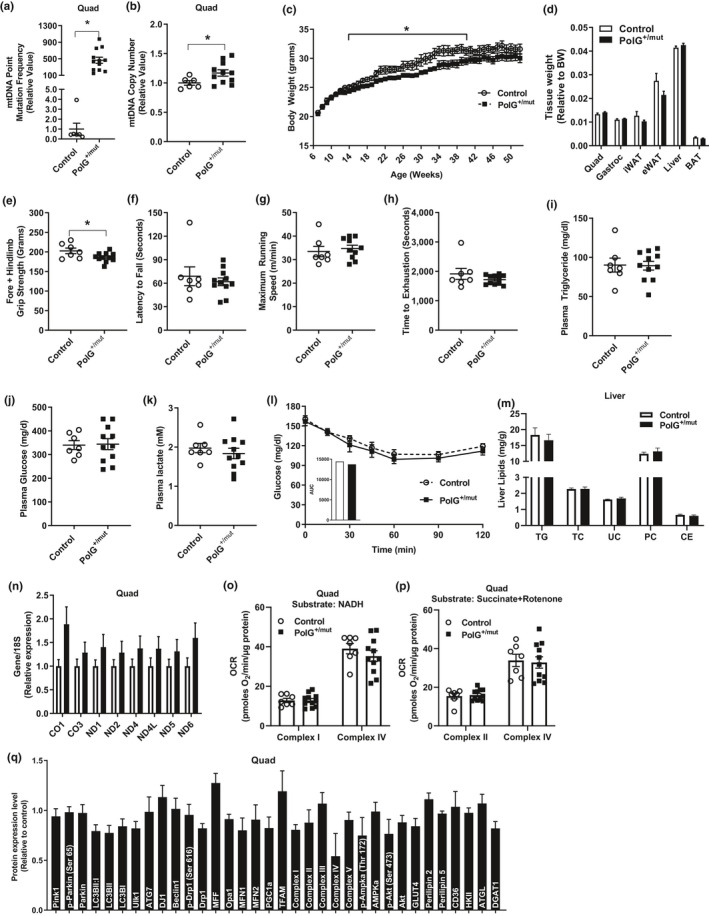
Mitochondrial dysfunction is frequently associated with impairment in metabolic homeostasis and insulin action, and is thought to underlie cellular aging. However, it is unclear whether mitochondrial dysfunction is a cause or consequence of insulin resistance in humans. To determine the impact of intrinsic mitochondrial dysfunction on metabolism and insulin action, we performed comprehensive metabolic phenotyping of the polymerase gamma (PolG) D257A "mutator" mouse, a model known to accumulate supraphysiological mitochondrial DNA (mtDNA) point mutations. We utilized the heterozygous PolG mutator mouse (PolG+/mut ) because it accumulates mtDNA point mutations ~ 500-fold > wild-type mice (WT), but fails to develop an overt progeria phenotype, unlike PolGmut/mut animals. To determine whether mtDNA point mutations induce metabolic dysfunction, we examined male PolG+/mut mice at 6 and 12 months of age during normal chow feeding, after 24-hr starvation, and following high-fat diet (HFD) feeding. No marked differences were observed in glucose homeostasis, adiposity, protein/gene markers of metabolism, or oxygen consumption in muscle between WT and PolG+/mut mice during any of the conditions or ages studied. However, proteomic analyses performed on isolated mitochondria from 12-month-old PolG+/mut mouse muscle revealed alterations in the expression of mitochondrial ribosomal proteins, electron transport chain components, and oxidative stress-related factors compared with WT. These findings suggest that mtDNA point mutations at levels observed in mammalian aging are insufficient to disrupt metabolic homeostasis and insulin action in male mice.

Keywords: POLG; aging; insulin resistance; metabolism; mitochondria; mitochondrial DNA; obesity.


Conflict of interest statement

The authors declare no competing financial interests.

Figures

Figure 1
Figure 1
Increased mtDNA point mutations do not induce insulin resistance or adiposity in male mice at 6 months of age. Mitochondrial DNA (a) point mutation frequency and (b) deletion mutation frequency in muscle from PolG+/mut versus Control. (c) Body weight and (d) wet tissue weight in Control and PolG+/mut male mice. (e–h) Iron, triglyceride, lactate, and glucose levels measured in plasma from Control and PolG+/mut following a 6‐hr fast. (i–l) Muscle grip strength, latency to fall, maximum running speed, and time to running exhaustion. (m) Glucose tolerance test. Values are expressed as means ± SEM, and mean differences were detected by Student's t test. *p < .05 between‐group significance, PolG+/mut versus Control. N = 6–11/group
Figure 2
Figure 2
Increased mtDNA point mutations in muscle increase mtDNA copy number. (a) Cytochrome C oxidase (COX)‐positive fibers (darker brown) in muscle sections from the tibialis anterior with representative images from each group. (b) Mitochondrial DNA copy number in quadriceps muscle of PolG+/mut versus normalized Control. (c) Heat map of mRNA expression in quadriceps muscles normalized to Control. (d) Mitochondrial complex 1 activity in gastrocnemius muscle and normalized to Control. (e–f) Oxygen consumption rates from complex I and complex IV in quadriceps muscle expressed as picomoles of oxygen/minute/ microgram of protein using NADH or succinate + rotenone as substrates. (g) Polar histogram of fold change in protein/phosphoprotein expression in whole quadriceps muscle lysates of PolG+/mut over Control. Protein name depicted at edge with each successive circle representing a 0.2‐, 0.0‐, ‐0.2‐, or ‐0.4‐fold change compared with Control. Values are expressed as means ± SEM, and mean differences were detected by Student's t test. *p < .05, significantly different from Control. N = 4–7/group
Figure 3
Figure 3
Increased mtDNA point mutations do not alter metabolic response to 24‐hr starvation. (a) Change in body weight and (b) wet tissue weights in PolG+/mut versus Control following 24‐hr starvation. (c–e) Plasma triglycerides, glucose, and lactate levels. (f) Hepatic glycogen content expressed relative to g of tissue. (g) Hepatic lipid concentration expressed as milligram of lipid/ gram of liver (TG, triglyceride; TC, total cholesterol; UC, unesterified cholesterol; PC, phosphatidylcholine; CE, cholesterol ester). (h) Hepatic gene expression relative to Control normalized to 1.0. (i) Mitochondrial DNA (i) point mutation frequency and (j) copy number in quadriceps muscles from PolG+/mut versus normalized Control. (k–l) Measurement of oxygen consumption rate from complex I and complex IV in quadriceps muscle expressed as picomoles of oxygen/ minute/ microgram of protein with either NADH or succinate + rotenone as substrates. (m–n) Gene and protein/phosphoprotein expression of mitophagy markers in quadriceps muscle from PolG+/mut relative to normalized Control following 24‐hr starvation. (o) Expression of genes regulating lipid metabolism in PolG+/mut relative to normalized Control. Values are expressed as means ± SEM, and mean differences were detected by Student's t test. *p < .05, significantly different from Control. N = 8–14/group
Figure 4
Figure 4
Increased mtDNA point mutations do not alter metabolic response to HFD feeding. Mitochondrial DNA (a) point mutation frequency and (b) DNA copy number in quadriceps muscles from PolG+/mut relative to normalized Control. (c) Weekly body weight in mice after initiation of HFD at 12 weeks of age. (d) Change in body weight between groups consuming a HFD. (e) Wet tissue weight relative to body weight. (f–h) Plasma triglyceride, glucose, and lactate. (i) Hepatic lipid concentration expressed as milligram of lipid/gram of liver (TG, triglyceride; TC, total cholesterol; UC, unesterified cholesterol; PC, phosphatidylcholine; CE, cholesterol ester). (j–k) Oxygen consumption rates from complex I and complex IV in quadriceps muscle expressed as picomoles of oxygen/minute/microgram of protein using NADH or succinate + rotenone as substrates. Quadriceps muscle (l) gene and (m) protein/phosphoprotein expression in HFD‐fed PolG+/mut versus normalized Control. Values are expressed as means ± SEM, and mean differences were detected by Student's t test. *p < .05, significantly different from Control. N = 6–8/group
Figure 5
Figure 5
Increased mtDNA point mutations fail to disrupt insulin sensitivity or promote adiposity in aged mice. Mitochondrial DNA (a) point mutation frequency and (b) DNA copy number in quadriceps muscle from PolG+/mut relative to normalized Control. (c) Weekly body weight in aging mice. (d) Wet tissue weights relative to body weight of PolG+/mut versus Control. (e–h) Muscle strength and endurance. (i–k) Plasma triglyceride, glucose, and lactate concentrations. (l) Insulin tolerance test with area under the curve (AUC) insert. (m) Hepatic lipid levels expressed as milligram of lipid/gram of liver (TG, triglyceride; TC, total cholesterol; UC, unesterified cholesterol; PC, phosphatidylcholine; CE, cholesterol ester). (n) Muscle expression of genes encoded by the mitochondrial genome. (o–p) Muscle oxygen consumption rates from complex I and complex IV expressed as picomoles of oxygen/minute/microgram of quadriceps protein using NADH or succinate + rotenone as substrates. (q) Expression of proteins/phosphoproteins in muscle from PolG+/mut relative to Control. Values are expressed as means ± SEM. Mean differences were detected by Student's t test. *p < .05, significantly different from Control. N = 8–15/group
Figure 6
Figure 6
Increased mtDNA point mutations alter the mitochondrial proteome of muscle from aged mice. (a) Representative immunoblot verifying cytosolic (Cyto), nuclear (Nuc), and mitochondrial (Mito) fractions of control muscle. (b) Selected mitochondrial protein, fission factor MFF, to corroborate findings from a mitochondrial proteomic screen compared with immunoblotting. (c) Unbiased hierarchical clustering of mice indicating genotype and sample #. (d) Volcano plot of proteins identified in the muscle mitochondrial proteomic screen expressed as fold change for 12‐month‐old PolG+/mut relative to Control (dotted line indicates significance threshold, and blue dots indicate proteins significantly altered in PolG+/mut relative to control). (e) Pathway analysis of significantly altered proteins in muscle from aged PolG+/mut relative to Control (dotted line indicates significance threshold). (f) Functional annotation clustering of significantly altered proteins identified in mitochondrial proteomic screen expressed as an enrichment score. (g) Transcription factor association of significantly altered proteins expressed as significance of association from TRRUST analysis (dotted line indicates significance threshold). * p < .05 significantly different from Control. N = 5/group

References

    1. Ahlqvist, K. J. , Leoncini, S. , Pecorelli, A. , Wortmann, S. B. , Ahola, S. , Forsström, S. , … Suomalainen, A. (2015). MtDNA mutagenesis impairs elimination of mitochondria during erythroid maturation leading to enhanced erythrocyte destruction. Nature Communications, 6, 6494 10.1038/ncomms7494 - DOI - PubMed
    1. Avital, G. , Buchshtav, M. , Zhidkov, I. , Tuval (Feder), J. , Dadon, S. , Rubin, E. , … Mishmar, D. (2012). Mitochondrial DNA heteroplasmy in diabetes and normal adults: Role of acquired and inherited mutational patterns in twins. Human Molecular Genetics, 21(19), 4214–4224. 10.1093/hmg/dds245 - DOI - PMC - PubMed
    1. Bogacka, I. , Xie, H. , Bray, G. A. , & Smith, S. R. (2005). Pioglitazone induces mitochondrial biogenesis in human subcutaneous adipose tissue in vivo. Diabetes, 54(5), 1392–1399. 10.2337/diabetes.54.5.1392 - DOI - PubMed
    1. Center, M.A.M.D. Specializing in Mitochondrial Disease Treatment and Research. University of California, San Diego.
    1. Chella Krishnan, K. , Kurt, Z. , Barrere‐Cain, R. , Sabir, S. , Das, A. , Floyd, R. , … Yang, X. (2018). Integration of multi‐omics data from mouse diversity panel highlights mitochondrial dysfunction in non‐alcoholic fatty liver disease. Cell Systems, 6(1), 103–115 e107 10.1016/j.cels.2017.12.006 - DOI - PMC - PubMed

Publication types

Substances