. 2021 Feb 15;22(4):686-693.
doi: 10.1002/cbic.202000571. Epub 2020 Nov 11.

Challenges of Using Expansion Microscopy for Super-resolved Imaging of Cellular Organelles

Affiliations

Challenges of Using Expansion Microscopy for Super-resolved Imaging of Cellular Organelles

Maximilian Büttner et al. Chembiochem. .

Abstract

Expansion microscopy (ExM) has been successfully used to improve the spatial resolution when imaging tissues by optical microscopy. In ExM, proteins of a fixed sample are crosslinked to a swellable acrylamide gel, which expands when incubated in water. Therefore, ExM allows enlarged subcellular structures to be resolved that would otherwise be hidden to standard confocal microscopy. Herein, we aim to validate ExM for the study of peroxisomes, mitochondria, nuclei and the plasma membrane. Upon comparison of the expansion factors of these cellular compartments in HEK293 cells within the same gel, we found significant differences, of a factor of above 2, in expansion factors. For peroxisomes, the expansion factor differed even between peroxisomal membrane and matrix marker; this underlines the need for a thorough validation of expansion factors of this powerful technique. We further give an overview of possible quantification methods for the determination of expansion factors of intracellular organelles, and we highlight some potentials and challenges.

Keywords: STED microscopy; bioorganic chemistry; cell organelles; expansion microscopy; peptides.


Conflict of interest statement

The authors declare no conflict of interest.

Figures

Figure 1
Figure 1
Expansion microscopy of intracellular organelles. HEK293 cells were grown on glass coverslips and transfected to achieve fluorescent protein (FP)‐expression (optional). Cells were then fixed, immunostained, treated with the crosslinking reagent AcX and embedded into the gel. Subsequently, the sample was treated with proteinase K, which digests all cellular proteins to peptides, that are crosslinked to the gel. This allows them to expand together with the gel when incubated in water. The expanded cells were imaged by conventional confocal or STED microscopy. Unexpanded controls were imaged after immunostaining. The area or volume of the structure of interest was then measured and used to calculate the expansion factor.
Figure 2
Figure 2
Expansion of the nucleus. a) HEK293 cell immunolabelled with an antibody against the nuclear pore complex protein NUP153 in an expanded gel. For imaging, the confocal plane with the maximal extent of the nucleus was chosen. The size of the nucleus was measured by manually tracing the NUP153 signal, and the resulting area was recorded for analysis. b) For unexpanded cells treated in the same manner, the analysis was performed analogously. c) Box‐whisker plot comparing the measured areas for maximal extent of the nucleus between expanded and unexpanded cells. The median value is denoted by the bar; the box shows the quartile ranges. Whiskers extend from the 5th to the 95th percentile. d) Expansion factor calculated from pooled median areas of unexpanded (n=80) and expanded (n=54) nuclei across two independent replicates. The EF was calculated using median values.
Figure 3
Figure 3
Expansion of the cell area and mitochondria within the same cells. To stain the plasma membrane, HEK293 cells expressing GPI‐GFP were additionally immunolabelled with antibodies against the mitochondrial outer‐membrane protein TOM20. The cells were expanded and imaged as z‐stacks on a spinning disc microscope setup. a) Example images of 1) expanded and 2) unexpanded cells expressing GPI‐GFP on the cell membrane. The z‐slice with the maximum extent of the cell was chosen, and the cell area was measured manually. b) Example surface renderings of immunostained mitochondria derived from the z‐stacks of 1) expanded and 2) unexpanded cells are shown. The red‐to‐yellow shading of the surface renderings illustrates the depth, where yellow objects are further away from the viewer. The z‐stacks were thresholded, and the volume of all voxels was summed to obtain the volume of the whole mitochondrial network. c) Box‐whisker plot showing measured volumes for TOM20 and areas for GPI‐GFP. The median value is denoted by the bar; the box shows the quartile ranges. Whiskers extend from the 5th to the 95th percentile. d) Expansion factors calculated from median volumes of the mitochondrial network of unexpanded (n=76) and expanded (n=80) cells. The expansion factor for cell areas was calculated from median areas of unexpanded (n=206) and expanded (n=72) cells. The pooled data shown were obtained from three independent replicates.
Figure 4
Figure 4
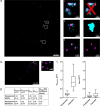
Expansion of peroxisomes. HEK293 cells expressing GFP‐PTS1 were immunolabelled with an antibody against PEX14 (cyan), expanded and imaged in two‐colour STED. The GFP signal was boosted with an ATTO488‐labelled nanobody against GFP (magenta). a) One expanded HEK cell; insets are highlighted on the right with a visualization of the data analysis (right). a1) As clear assignment of the PEX14 signal in clustered peroxisomes was not possible, these were excluded from the analysis. a2) In more isolated peroxisomes, the peroxisomal membrane was manually traced according to the PEX14 signal, and the area was determined for analysis. a3) For the peroxisomal matrix, the GFP‐PTS1 signal was thresholded, and its area was determined automatically. b) An unexpanded cell treated and stained by the same method was used for the gels. Areas were measured analogously to the analysis of expanded cells. c) Box‐whisker plots showing areas of peroxisomal matrix and membrane before and after expansion. The median value is denoted by the bar; the box shows the quartile ranges. Whiskers extend from the 5th to the 95th percentile. d) Median areas of unexpanded (n=744) and expanded (n=654) peroxisomal membranes were used to calculate the expansion factor. Similarly, for the peroxisomal matrix, median areas of unexpanded (n=3657) and expanded (n=3322) matrices were compared. The pooled data shown were obtained from three independent replicates.

References

    1. Chen F., Tillberg P. W., Boyden E. S., Science 2015, 347, 543–548. - PMC - PubMed
    1. Tillberg P. W., et al., Nat. Biotechnol. 2016, 34, 987–992. - PMC - PubMed
    1. Xu H., et al., Proc. Natl. Acad. Sci. India 2019, 116, 18423–18428. - PMC - PubMed
    1. Gao M., et al., ACS Nano 2018, 12, 4178–4185. - PubMed
    1. Zwettler F. U., et al., Nat. Commun. 2020, 11, 3388. - PMC - PubMed

Publication types

MeSH terms

LinkOut - more resources