. 2020 Oct 8;12(10):1142.
doi: 10.3390/v12101142.

A Diverse Virome of Leafroll-Infected Grapevine Unveiled by dsRNA Sequencing

Affiliations

A Diverse Virome of Leafroll-Infected Grapevine Unveiled by dsRNA Sequencing

Mamadou L Fall et al. Viruses. .

Abstract

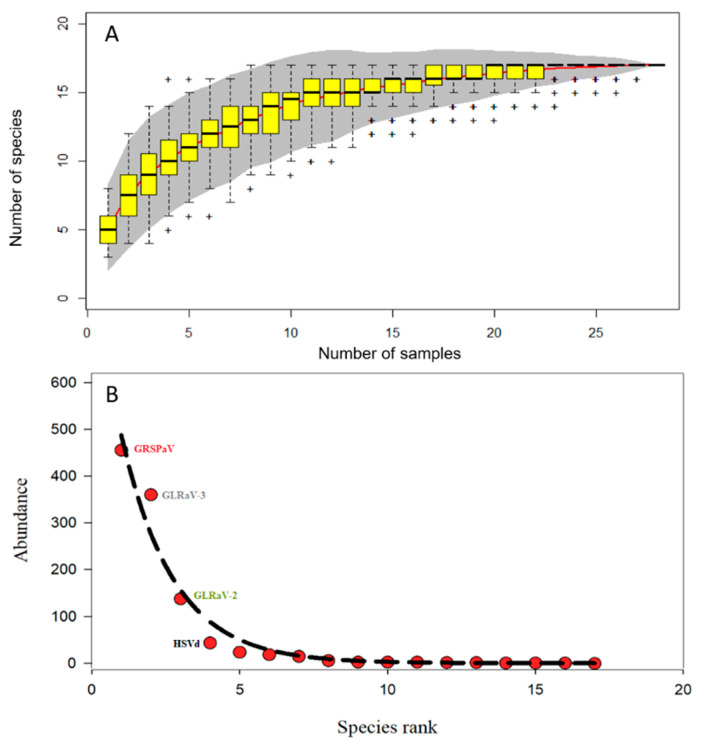
Quebec is the third-largest wine grape producing province in Canada, and the industry is constantly expanding. Traditionally, 90% of the grapevine cultivars grown in Quebec were winter hardy and largely dominated by interspecific hybrid Vitis sp. cultivars. Over the years, the winter protection techniques adopted by growers and climate changes have offered an opportunity to establish V. vinifera L. cultivars (e.g., Pinot noir). We characterized the virome of leafroll-infected interspecific hybrid cultivar and compared it to the virome of V. vinifera cultivar to support and facilitate the transition of the industry. A dsRNA sequencing method was used to sequence symptomatic and asymptomatic grapevine leaves of different cultivars. The results suggested a complex virome in terms of composition, abundance, richness, and phylogenetic diversity. Three viruses, grapevine Rupestris stem pitting-associated virus, grapevine leafroll-associated virus (GLRaV) 3 and 2 and hop stunt viroid (HSVd) largely dominated the virome. However, their presence and abundance varied among grapevine cultivars. The symptomless grapevine cultivar Vidal was frequently infected by multiple virus and viroid species and different strains of the same virus, including GLRaV-3 and 2. Our data show that viruses and viroids associated with the highest number of grapevines expressing symptoms included HSVd, GLRaV-3 and GLRaV-2, in gradient order. However, co-occurrence analysis revealed that the presence of GLRaV species was randomly associated with the development of virus-like symptoms. These findings and their implications for grapevine leafroll disease management are discussed.

Keywords: Vitis vinifera; dsRNA extraction; grapevine leafroll disease; interspecific hybrid; viromics; virus co-occurrence; virus epidemiology.


Conflict of interest statement

The authors declare that we have no known competing financial interest or personal relationships that could have appeared to influence the work reported in this paper.

Figures

Figure 1
Figure 1
Asymptomatic and symptomatic leaves observed in different cultivars that were positive for grapevine leafroll-associated virus (GLRaV) (GLRaV-2 or 3 or both) in Quebec, Canada. Cultivar Vidal positive to GLRaV without symptom expression (A,D), cultivar DM85 positive to GLRaV with leafroll symptom expression (B,E) and cultivar Pinot noir positive to GLRaV with leafroll symptom expression (C,F).
Figure 2
Figure 2
An accumulation curve of the viral population in grapevine plant samples (A). The red line represents the number of virus species as a function of number of samples collected. The gray area displays the standard deviation, and the yellow box plots show the species richness based on linear interpolation of random permutation. The virus rank abundance curve (B) displays the virus abundance as a function of virus species rank. The four virus and viroid species (grapevine Rupestris stem pitting-associated virus (GRSPaV) GLRaV-3, GLRaV-2, hop stunt viroid (HSVd)) in terms of abundance are shown. R packages vegan, gridExtra, ggplot2 and ade4 were used (see materials and methods section for more details).
Figure 3
Figure 3
Virus richness (A), virus relative abundance (B), virus richness Z score (C) and virus richness relative to the richness of the positive control (Phaseolus vulgaris endorvirus1 (PvEV1)) (D), sorted by the three major grapevine cultivars that constituted 93% of the total plants sampled (Marechal Foch, Pinot noir and Vidal). R package ggplot2 was used (see materials and methods section for details on how richness and richness Z score were calculated).
Figure 4
Figure 4
Heatmap displaying the characteristics and association between detected viruses and the mean proportion of viral reads that mapped for a given virus (MPVR), total number of symptomatic leaves (TNSL) associated with a given virus, mean depth (MD), mean depth relative to the depth of the positive control virus (MDRC), mean relative abundance (MRA), mean weight and genome size (GS). The pam function of the cluster package was used for partitioning the data into k cluster around Medoids (k-Medoids, (k = 3)) because it is less sensitive to outliers compared to k-means [33]. R packages ComplexHeatmap, circlize, colorspace, dendextend, cluster and GetoptLong were used (see materials and methods section for more details). For virus names and abbreviations, please see Table 1.
Figure 5
Figure 5
Heatmap of hierarchical clustering of grapevine virome composition profiles represented by the normalized relative abundance per grapevine sample. Heatmap color (white to dark red) displays the row-scaled relative abundance of each virus across all samples. The Bray–Curtis dissimilarity matrix and average linkage distance were used. R packages Vegan, Heatplus, gplots, RcolorBrewer and readxl were used (see materials and methods section for more details).
Figure 6
Figure 6
The percent of total pairings for virus species, leafroll-like symptoms and grapevine cultivars that are positive, negative and random (boxplot top graph). The bar outline in white shows the assemblage-wide percentages. A heatmap of the positive, negative and random associations (bottom-left graph) displays the probabilistic co-occurrence that observed frequency of co-occurrence between two events (e.g., virus, viroids or symptoms presence in a given sample) is significantly greater (large) than expected (meaning a positive association), significantly less (small) than expected (meaning negative association), or not significantly different and approximately equal to expectation (meaning random association)). Events are positioned to indicate the columns and the rows that represent their pairwise relationships. Graphic displaying the scatter plot of observed versus expected co-occurrence (bottom-right graph). Each event pair in the analysis is represented by a circle colored based on whether it was classified as positive (orange), negative (dark green) or random (gray). Any event pairs that were expected to share less than one sampling unit were removed from the analysis. R package co-occur was used (see materials and methods section for more details). See Table 1 for virus names and abbreviations.
Figure 7
Figure 7
Maximum likelihood phylogenetic tree constructed from recovered consensus partial sequences of (A) grapevine leafroll-associated virus 2 (GLRaV-2) and full genome of (C) hop stunt viroid (HSVd). Neighbor-joining construction method with 1000 bootstrap replicates was used. Branch length represents phylogenetic distances determined with distance matrices of nucleotide sequences. Purple dots above critical branches are significant bootstrap values (>70%). GenBank accession number of fully sequenced genomes from different countries are highlighted for reference. Isolates from this study are represented and are not highlighted. The percent of identity (purple-red scale) and Jukes–Cantor distance (yellow-red scale) are presented for each pair of sequences of (B) GLRaV-2 and (D) HSVd. The percent of identity is the proportion of identical residues in the alignment positions to overlapping alignment positions between the two sequences. The distance was calculated using the Jukes–Cantor distance between the two sequences and is the proportion between identical and overlapping alignment position between two sequences. R package phylogram and the interactive tree of life platform were used to generate the tree (see the materials and methods section for more details).
Figure 8
Figure 8
Maximum likelihood phylogenetic tree constructed from recovered consensus partial sequences of grapevine Ruspestris stem pitting-associated virus (GRSPaV). Neighbor-joining construction method with 1000 bootstrap replicates was used. Branch length represents phylogenetic distances determined with distances matrices of nucleotide sequences. Purple dots above critical branches are significant bootstrap values (>70%). GenBank accession numbers of fully sequenced genomes from different countries are highlighted for reference. Isolates from this study are represented and are not highlighted. The percent of identity (purple-red scale) and Jukes–Cantor distance (yellow-red scale) are represented for each pair of sequences of GRSPaV. The percent of identity is the proportion of identical residues in the alignment positions to overlapping alignment positions between the two sequences. The distance was calculated using the Jukes–Cantor distance between the two sequences and is the proportion between identical and overlapping alignment position between two sequences. R package phylogram and the interactive tree of life platform was used to generate the tree (see the materials and methods section for more details).

References

    1. Statistic Canada Table 32-10-0364-01 Area, Production and Farm Gate Value of Marketed Fruits. [(accessed on 17 June 2020)]; doi: 10.25318/3210036401-eng. Available online: - DOI
    1. Martelli G.P. Directory of virus and virus-like diseases of the grapevine and their agents. J. Plant Pathol. 2014;96:1–136.
    1. Fuchs M. Grapevine viruses: A multitude of diverse species with simple but overall poorly adopted management solutions in the vineyard. J. Plant Pathol. 2020;102:643–653. doi: 10.1007/s42161-020-00579-2. - DOI
    1. Alabi O.J., Casassa L.F., Gutha L.R., Larsen R.C., Henick-Kling T., Harbertson J.F., Naidu R.A. Impacts of Grapevine Leafroll Disease on Fruit Yield and Grape and Wine Chemistry in a Wine Grape (Vitis vinifera L.) Cultivar. PLoS ONE. 2016;11:e0149666. doi: 10.1371/journal.pone.0149666. - DOI - PMC - PubMed
    1. Atallah S.S., Gomez M.I., Fuchs M.F., Martinson T.E. Economic Impact of Grapevine Leafroll Disease on Vitis vinifera cv. Cabernet franc in Finger Lakes Vineyards of New York. Am. J. Enol. Vitic. 2012;63:73–79. doi: 10.5344/ajev.2011.11055. - DOI

Publication types

Supplementary concepts

LinkOut - more resources