. 2020 Oct 9;12(10):2899.
doi: 10.3390/cancers12102899.

Senescence-Associated Secretory Phenotype Determines Survival and Therapeutic Response in Cervical Cancer

Affiliations

Senescence-Associated Secretory Phenotype Determines Survival and Therapeutic Response in Cervical Cancer

Sharad Purohit et al. Cancers (Basel). .

Abstract

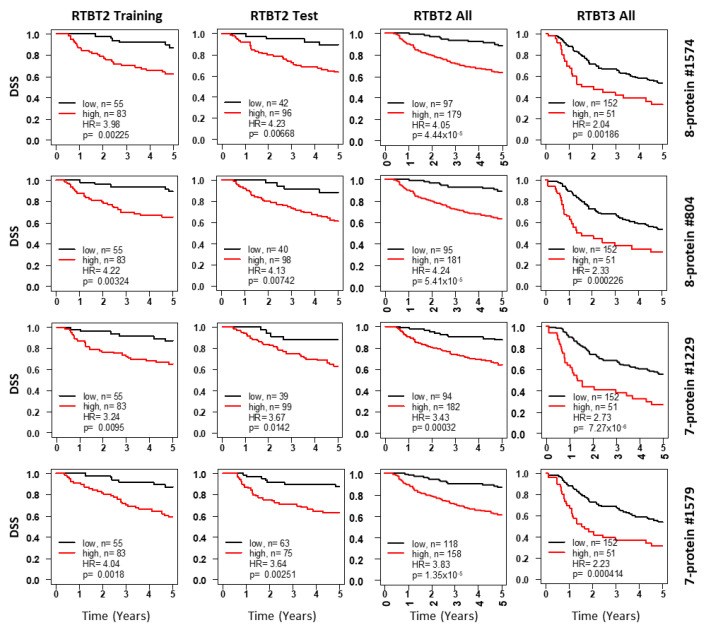
Molecular biomarkers that can predict survival and therapeutic outcome are still lacking for cervical cancer. Here we measured a panel of 19 serum proteins in sera from 565 patients with stage II or III cervical cancer and identified 10 proteins that have an impact on disease specific survival (DSS) (Hazzard's ratio; HR = 1.51-2.1). Surprisingly, all ten proteins are implicated in senescence-associated secreted phenotype (SASP), a hallmark of cellular senescence. Machine learning using Ridge regression of these SASP proteins can robustly stratify patients with high SASP, which is associated with poor survival, and patients with low SASP associated with good survival (HR = 3.09-4.52). Furthermore, brachytherapy, an effective therapy for cervical cancer, greatly improves survival in SASP-high patients (HR = 3.3, p < 5 × 10⁻⁵) but has little impact on survival of SASP-low patients (HR = 1.5, p = 0.31). These results demonstrate that cellular senescence is a major determining factor for survival and therapeutic response in cervical cancer and suggest that senescence reduction therapy may be an efficacious strategy to improve the therapeutic outcome of cervical cancer.

Keywords: biomarkers; cervical neoplasia; gynecologic cancers; prognosis; proteomics; radiation therapy; serum proteins.


Conflict of interest statement

The authors declare no conflict of interest. BDS is employed by Jinfiniti Precision Medicine LLC.

Figures

Figure 1
Figure 1
Kaplan-Meir curves curves for CPR (ac), showing differences in survival in three groups identified based on stage (II and III) and treatment type (EBRT and EBRT+BT). Group 1: Stage II treated with EBRT+BT (a,d,g,j), Group 2: Stage III treated with EBRT+BT (b,e,h,k) and Group 3: Stage III treated with EBRT alone (c,f,i,l). serum level for each protein was divided into quartiles containing 25% of patients, Q1: Quartile 1 (0–25%), Q2: Quartile 2 (25–50%), Q3: Quartile 3 (50–75%) and Q4: Quartile 4 (75–100%). Quartile 1 was compared to Q2–Q3.
Figure 2
Figure 2
Kaplan-Meir curves for Ridge models developed with the RTBT2 dataset. Shown for each representative model are survival curves for the training subset (column 1), testing subset (column2), all RTBT2 dataset (column3) and validation in the RTBT3 dataset (column4). Patients in each training subset were divided into high (60%) versus low (40%) for survival comparison and the cutoff threshold was applied to the testing and the independent RTBT3 dataset.
Figure 3
Figure 3
Kaplan-Meir curves for Ridge models developed with the RT3 dataset. Shown for each representative model are survival curves for the training subset (column 1), testing subset (column 2), validation in the RTBT2 (column 3) and RTBT3 datasets (column 4). Patients in each training subset were divided into high (40%) versus low (60%) for survival comparison and the cutoff threshold was applied to the testing and the independent RTBT2 and RTBT3 datasets. Results for selected protein models are presented here.
Figure 4
Figure 4
Model consistency and plurality voting for patient classification. (a,b) Heatmaps showing the voting by each model (row) on each patient (column). Red: SASP_H; Blue: SASP_L. Voting results are shown for all RTBT2 patients by RTBT2 models (a) and RT# patients by RT3 models (b). (c) Kaplan-Meir survival curves for SASP_H and SASP_L subsets in each of the three datasets (RTBT2, RTBT3 and RT3). SASP groups were defined by plurality voting of all 31 RTBT3 Ridge models. A patient is considered as SASP_H if >50% of the models voted the patient as SASP_H. (d) Kaplan-Meir survival curves for SASP_H and SASP_L subsets in each of the three datasets (RTBT2, RTBT3 and RT3). SASP groups were defined by plurality voting of all 25 RT3 Ridge models. A patient is considered as SASP_H if >50% of the models voted the patient as SASP_H.
Figure 5
Figure 5
Impact of SASP on response to brachytherapy. (a) All stage 3 patients (RTBT3+RT3) were classified into four subsets based on brachytherapy status (+BT and -BT) and SASP status (H vs. L) using cutoffs for each of the 25 RT3 models. Survival curves are shown for all four subsets for two representative models. HR and p values are shown between +BT and -BT subsets within SASP_H or SASP_L subsets. Data for all 25 models are shown in Table 3. (b) All stage 3 patients are classified into four subsets based on brachytherapy status and SASP status using plurality voting of all 25 RT3 models. SASP_H: >75% models voted the patient as SASP_H; SASP_L: >75% models voted the patient as SASP_L; SASP_M: <75% of models voted the patient as SASP_H or SASP_L. Data is summarized on the right.

References

    1. Bray F., Ferlay J., Soerjomataram I., Siegel R.L., Torre L.A., Jemal A. Global cancer statistics 2018: GLOBOCAN estimates of incidence and mortality worldwide for 36 cancers in 185 countries. CA Cancer J. Clin. 2018;68:394–424. doi: 10.3322/caac.21492. - DOI - PubMed
    1. Walboomers J.M., Jacobs M.V., Manos M.M., Bosch F.X., Kummer J.A., Shah K.V., Snijders P.J., Peto J., Meijer C.J., Munoz N. Human papillomavirus is a necessary cause of invasive cervical cancer worldwide. J. Pathol. 1999;189:12–19. doi: 10.1002/(SICI)1096-9896(199909)189:1<12::AID-PATH431>3.0.CO;2-F. - DOI - PubMed
    1. Stanley M.A., Pett M.R., Coleman N. HPV: From infection to cancer. Biochem. Soc. Trans. 2007;35:1456–1460. doi: 10.1042/BST0351456. - DOI - PubMed
    1. Koromilas A.E., Li S., Matlashewski G. Control of interferon signaling in human papillomavirus infection. Cytokine Growth Factor Rev. 2001;12:157–170. doi: 10.1016/S1359-6101(00)00023-X. - DOI - PubMed
    1. Sales K.J., Katz A.A. Inflammatory pathways in cervical cancer—The UCT contribution. S. Afr. Med. J. 2012;102:493–496. doi: 10.7196/SAMJ.5532. - DOI - PubMed

LinkOut - more resources