. 2020 Oct 11;12(10):1151.
doi: 10.3390/v12101151.

House Dust Mite Exposure Causes Increased Susceptibility of Nasal Epithelial Cells to Adenovirus Infection

Affiliations

House Dust Mite Exposure Causes Increased Susceptibility of Nasal Epithelial Cells to Adenovirus Infection

Malik Aydin et al. Viruses. .

Abstract

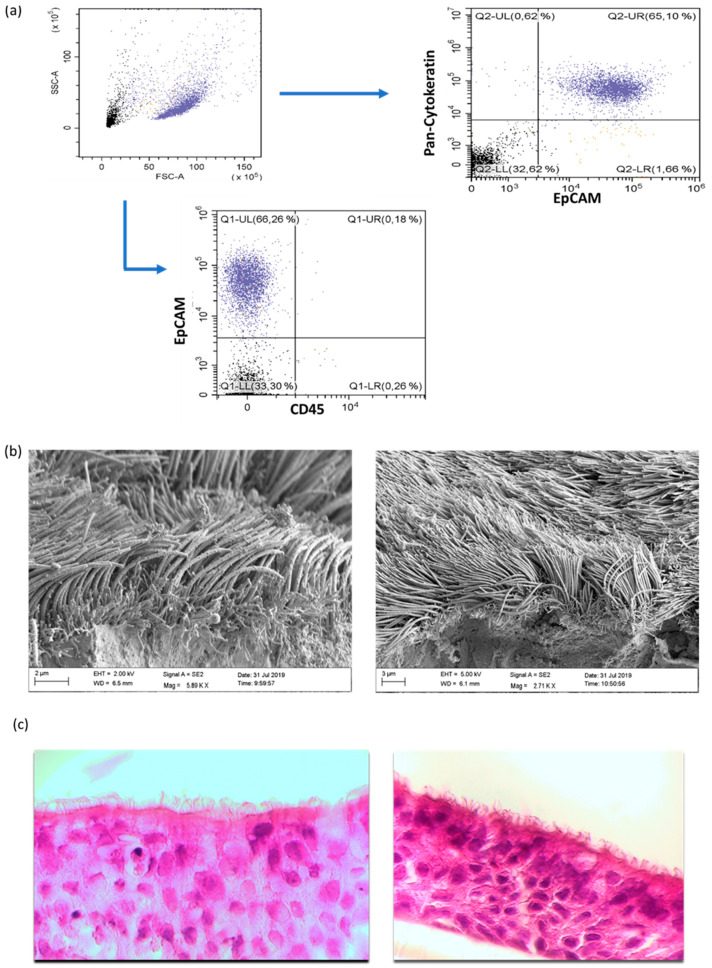
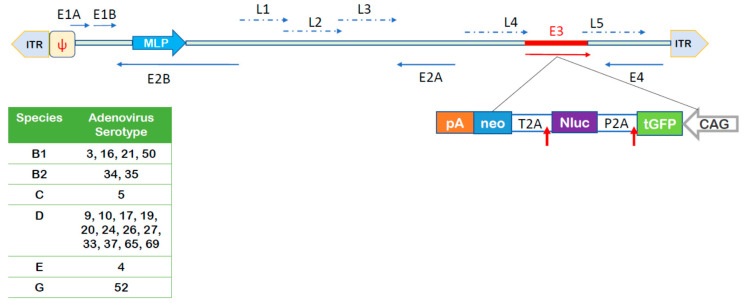
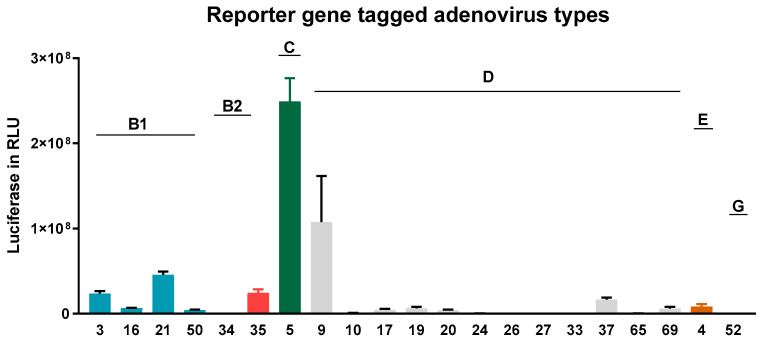
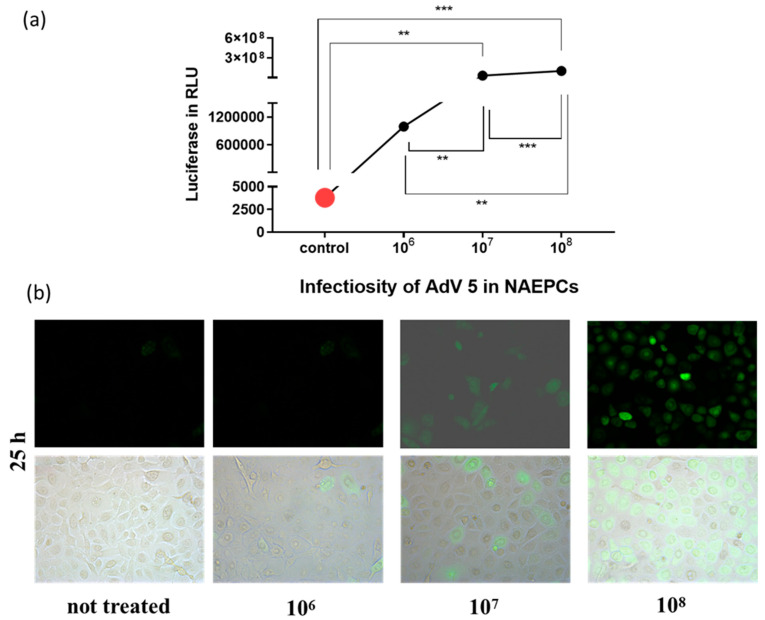
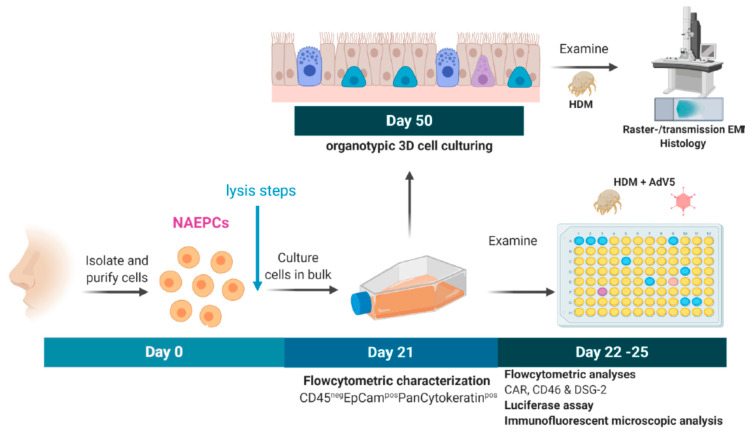
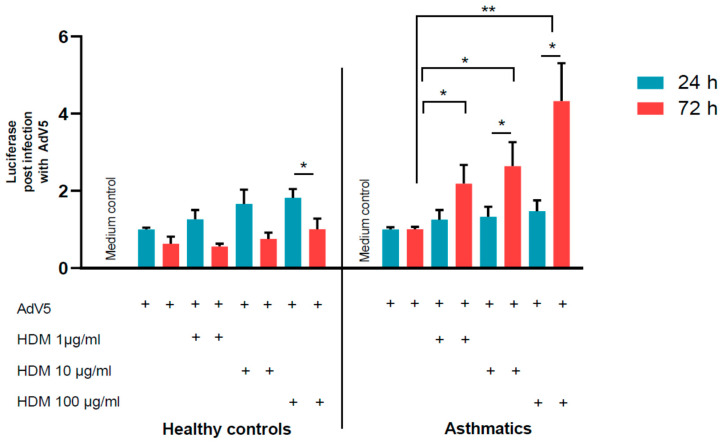
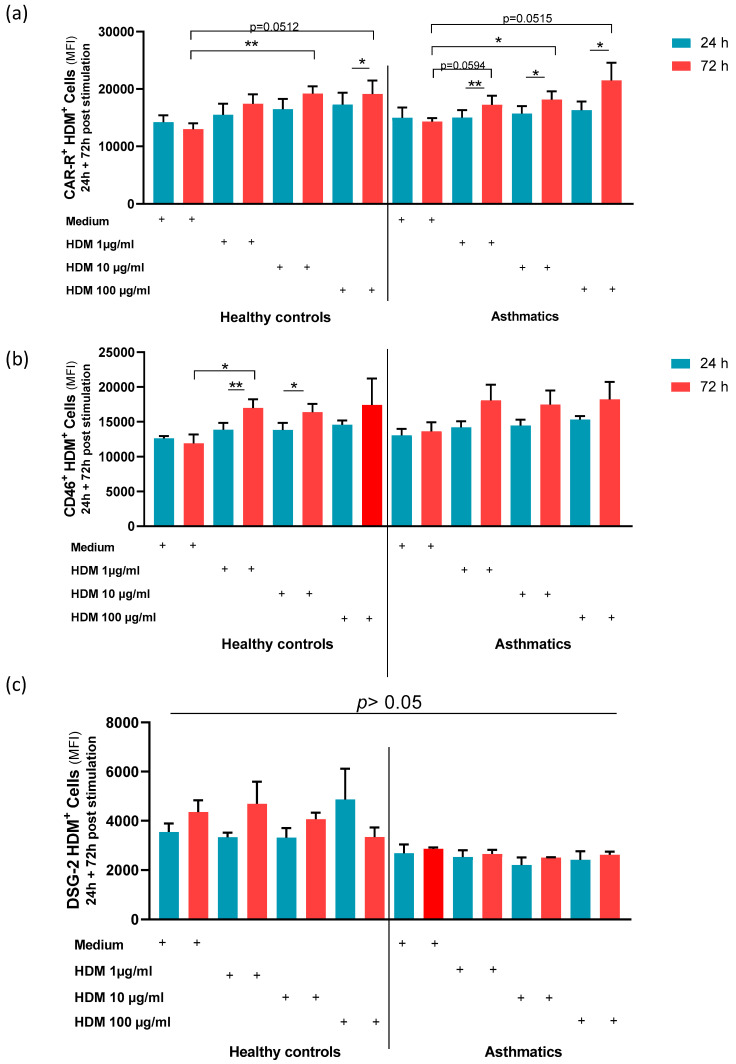
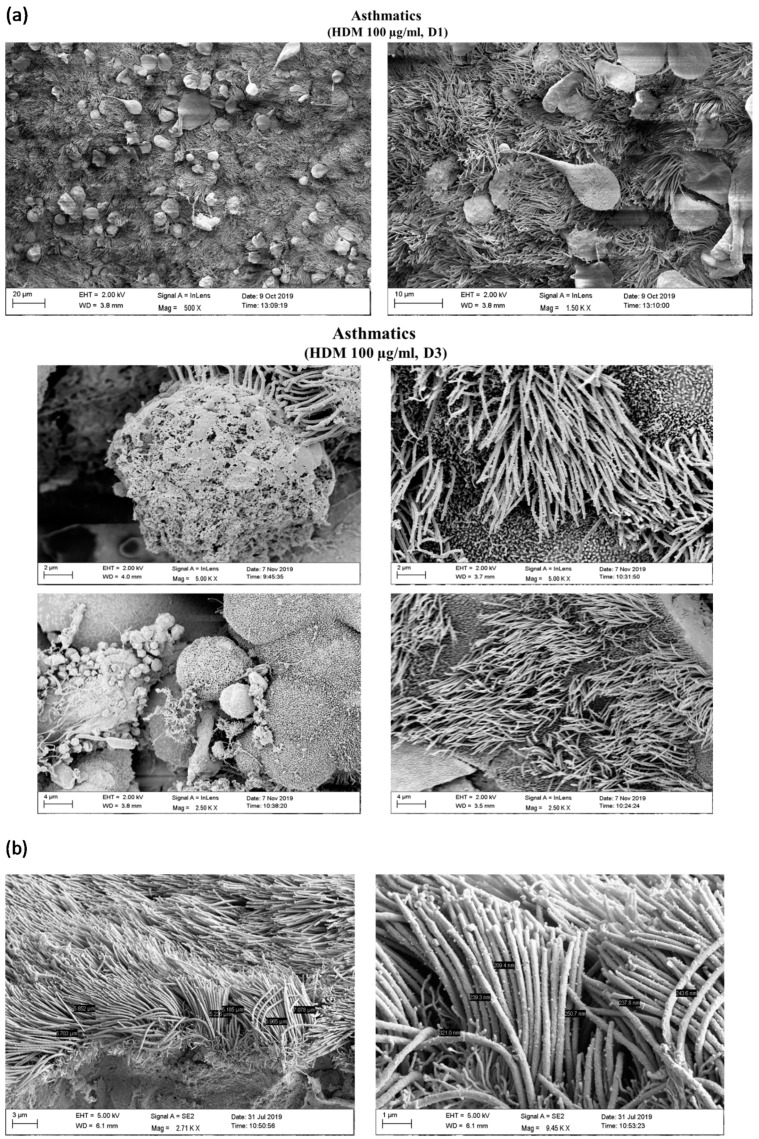
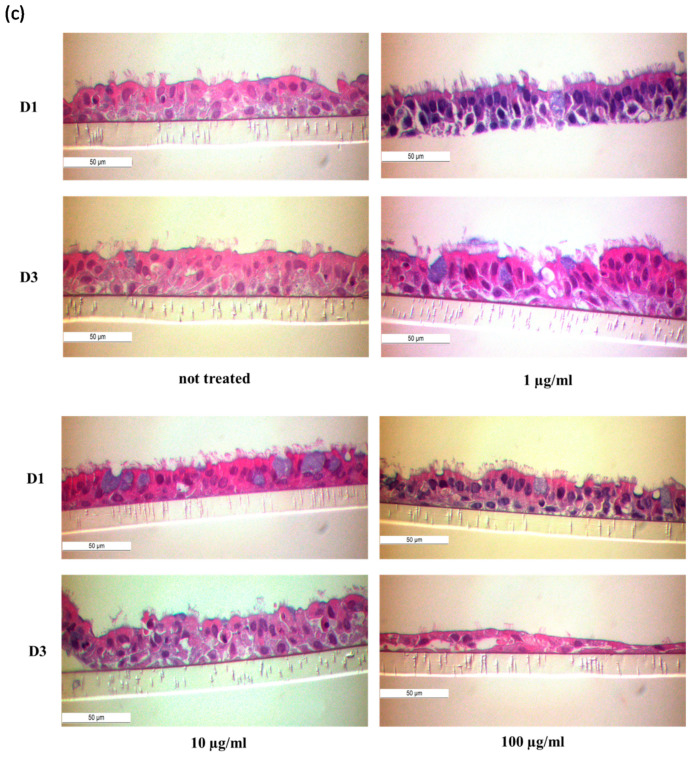
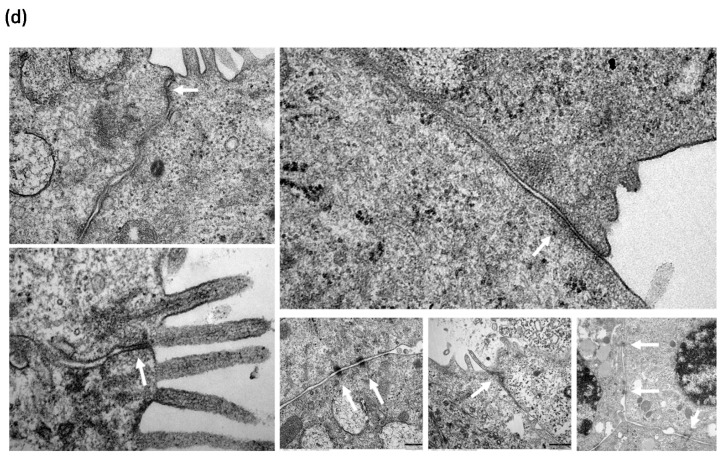
Adenovirus (AdV) infections in the respiratory tract may cause asthma exacerbation and allergic predisposition, and the house dust mite (HDM) may aggravate virus-induced asthma exacerbations. However, the underlying mechanisms of whether and how AdV affects asthmatic patients remains unclear. To address this question, we investigated nasal epithelial cells (NAEPCs) derived from a pediatric exacerbation study cohort for experimental analyses. We analyzed twenty-one different green-fluorescent protein- and luciferase-tagged AdV types in submerged 2D and organotypic 3D cell culture models. Transduction experiments revealed robust transduction of AdV type 5 (AdV5) in NAEPCs, which was associated with an increased uptake of AdV5 in the presence of HDM. In healthy and asthmatic NAEPCs exposed to HDM before infection, we observed a time- and dose-dependent increase of AdV5 uptake associated with upregulation of entry receptors for AdV5. Furthermore, electron microscopic and histologic analyses of 3D cell cultures revealed an impairment of the respiratory cilia after HDM exposition. This ex vivo pilot study shows the impact of AdV infection and HDM exposition in a primary cell culture model for asthma.

Keywords: CAR; CD46; adenovirus; allergy; asthma; house dust mite; pathogenesis.


Conflict of interest statement

The authors declare that the research was conducted in the absence of any commercial or financial relationships that could be constructed as a potential conflict of interest. The authors have declared that they have no competing interests. This work has not been published before, and it is not under consideration for publication elsewhere. The manuscript has been approved for publication by all co-authors.

Figures

Figure 1
Figure 1
Characterization of primary human nasal epithelial cells (NAEPCs) derived from the pediatric exacerbation study cohort. (a) NAEPCs were obtained through nasal brushing procedure. After different washing and lysing steps, NAEPCs were seeded in collagen I pre-coated T75 flasks and cultured for up to 2 weeks until 80–90% confluency was reached. During the splitting process from passage 0 (P0) to passage 1 (P1), NAEPCs were harvested for flow cytometric analyses. Cells were stained with CD45-APC, CD326(EpCAM)-PE as surface antibodies. After fixation and permeabilization, anti-cytokeratin-FITC was used for intracellular staining. (b) After passage 2 (P2), the cells were seeded for organotypic 3D air–liquid interface cultures. Nasal mucus secretion and ciliary beats were observed through light microscopy after 6 to 8 weeks of culturing. Final specimens were then processed for raster electron microscopic imaging. (c) Histologic analyses confirmed the morphology of the nasal epithelial cell population (10× magnification).
Figure 2
Figure 2
Summary of utilized adenoviruses (AdV) and schematic outline of DNA sequences contained in the AdV genomes. The upper panel provides a schematic overview of contained DNA sequences in the AdV genomes and the lower panel summarizes AdV types used for this study and respective species. The GFP, luciferase, neomycin (GLN)-reporter cassette encoding turboGFP (tGFP), nanoLuciferase (nLuc), and neomycin (neo) was inserted into the E3 region in the opposite orientation of major later promoter (MLP) of the adenovirus genome. ITR: inverted terminal repeat; Ψ: packaging signal; E1A, E1B, E2A, E2B, E3, E4: early adenovirus transcription units; L1-L4: late adenovirus genes, T2A and P2A: self-cleaving peptides; CAG: promoter with cytomegalovirus early enhancer element, part of the chicken beta-actin promoter and splice acceptor of the rabbit beta-globin gene; pA: polyadenylation signal. Blue horizontal arrows: early gene transcription units, blue dotted arrows: late gene transcription units, vertical red arrow: schematically presenting cleavage peptides. The figure was adapted from Zhang et al. [19].
Figure 3
Figure 3
Adenovirus transduction efficiency in NAEPCs. The NAEPCs derived from healthy controls were infected with reporter gene tagged AdV types (n = 21) using 50 virus particles per cell (vpc). Twenty-five hours post-transduction, luciferase assays were performed. Several AdV types efficiently transduced NAEPCs. Infection with respiratory AdV types such as 3, 9, 16, 21, 50, and 5 revealed high transduction rates. Values were given as absolute numbers and presented as mean and standard error of mean (SEM) (n = 3).
Figure 4
Figure 4
Evaluation of AdV5 infection in NAEPCs. The cells obtained from healthy controls were infected using different virus concentrations (1 × 10⁶, 1 × 10⁷, and 1 × 10⁸ vpc). Twenty-five hours post-transduction, NAEPCs were analyzed through luciferase assay and immunofluorescence microscopy. As presented in (a), the higher the AdV5 concentration, the higher the transduction efficiency in NAEPCs. (b) These results were confirmed by immunofluorescence microscopic analyses (10× magnification) (n = 3).
Figure 5
Figure 5
Experimental setup to analyze the effect of AdV and the house dust mite (HDM) on NAEPCs. During the nasal brushing procedure, we collected the cells in cell culture medium, centrifuged at 350× g for 8 min, and washed with PBS. The cell pellet was resuspended in cell culture medium, and the cells were seeded in collagen I pre-coated T75 flasks. After passage 2 (P2) was reached, NAEPCs were collected and seeded in collagen I pre-coated 96 well plates. Different HDM concentrations were used (1 µL/mL, 10 µg/mL, 100 µg/mL). The transduction concentration of AdV5 was set at 10 virus particle per cell (vpc). This figure was generated using BioRender.com
Figure 6
Figure 6
The effect of HDM stimulation and AdV5 infection on NAEPCs. NAEPCs were stimulated at different time points (day 1 and day 3) with different HDM concentrations (1 µg/mL, 10 µg/mL, and 100 µg/mL), and the cells were subsequently transduced with AdV5 at 10 virus particle numbers per cell (vpc). Twenty-four hours post-transduction, luciferase assays were performed. We observed an increased AdV5 transduction efficiency in pre-stimulated NAEPCs with HDM, particularly at day 3 in asthmatic specimens. This was in contrast to samples of healthy controls. Values were normalized and presented as fold change given as mean and standard error of mean (SEM).
Figure 7
Figure 7
The effect of HDM on AdV receptors in NAEPCs. NAEPCs were stimulated with different HDM concentrations (1 µg /mL, 10 µg/mL, and 100 µg/mL) at different time points (days 1 and 3), and the coxsackie and adenovirus receptor (CAR), CD46, and Desmoglein-2 receptors expression levels were characterized by flow cytometry. (a) The mean-PE values for CAR were set as absolute numbers. As shown, the asthmatic group had significant differences at CAR expression levels after HDM stimulation, particularly at day 3 compared to day 1. (b) The mean-APC values for CD46 were set as absolute numbers. As shown, the healthy control group showed significant differences between time points and concentration levels, compared to the asthmatic group (c) Desmoglein-2-PE was not significantly different in terms of time points and concentration levels in healthy controls and asthmatics.
Figure 8
Figure 8
Characterization of NAEPCs in organotypic 3D air–liquid interface (ALI) cell cultures by electron microscopic imaging. (a) NAEPCs were used for 3D ALI cell cultures, were treated with HDM using different concentrations indicating time points, and were imaged with raster-electron microscopy. An irritated epithelium after HDM stimulation with 100 µg/mL was observed. Some cells were also detached from the cell population in the specimens of the asthmatic group. After day 3, we observed an irritation of the epithelium and an affected barrier integrity in some regions of the cultures (scale bars were added to the respective figures, different magnifications were used (500-fold to 2500-fold)). (b) Measuring the thickness of the cilia, there was a lack of significant correlations between treated and untreated, healthy, or asthmatic samples (scale bars were added to the respective figures, different magnifications were used (500× to 2500×)). (c) Histologically, the epithelium was affected and numerous mucus cells were observed when treated with high dose HDM (10× magnification). (d,e) Transmission electron microscopic analyses of untreated healthy (d) and asthmatic (e) 3D cultures revealed a different tight junction conformation, especially for asthmatic 3D cultures. The tight junctions in untreated asthmatic samples (e) were tightly packed and were present in a higher numbers compared to untreated control samples (d). The white arrows mark the respective tight junctions. Different magnifications were applied (20,000-fold to 50,000-fold).
Figure 8
Figure 8
Characterization of NAEPCs in organotypic 3D air–liquid interface (ALI) cell cultures by electron microscopic imaging. (a) NAEPCs were used for 3D ALI cell cultures, were treated with HDM using different concentrations indicating time points, and were imaged with raster-electron microscopy. An irritated epithelium after HDM stimulation with 100 µg/mL was observed. Some cells were also detached from the cell population in the specimens of the asthmatic group. After day 3, we observed an irritation of the epithelium and an affected barrier integrity in some regions of the cultures (scale bars were added to the respective figures, different magnifications were used (500-fold to 2500-fold)). (b) Measuring the thickness of the cilia, there was a lack of significant correlations between treated and untreated, healthy, or asthmatic samples (scale bars were added to the respective figures, different magnifications were used (500× to 2500×)). (c) Histologically, the epithelium was affected and numerous mucus cells were observed when treated with high dose HDM (10× magnification). (d,e) Transmission electron microscopic analyses of untreated healthy (d) and asthmatic (e) 3D cultures revealed a different tight junction conformation, especially for asthmatic 3D cultures. The tight junctions in untreated asthmatic samples (e) were tightly packed and were present in a higher numbers compared to untreated control samples (d). The white arrows mark the respective tight junctions. Different magnifications were applied (20,000-fold to 50,000-fold).

References

    1. Robinson C.M., Singh G., Lee J.Y., Dehghan S., Rajaiya J., Liu E.B., Yousuf M.A., Betensky R.A., Jones M.S., Dyer D.W., et al. Molecular evolution of human adenoviruses. Sci. Rep. 2013;3:1812. doi: 10.1038/srep01812. - DOI - PMC - PubMed
    1. Nemerow G., Flint J. Lessons learned from adenovirus (1970–2019) FEBS Lett. 2019;593:3395–3418. doi: 10.1002/1873-3468.13700. - DOI - PubMed
    1. Davison A.J., Benko M., Harrach B. Genetic content and evolution of adenoviruses. J. Gen. Virol. 2003;84:2895–2908. doi: 10.1099/vir.0.19497-0. - DOI - PubMed
    1. Ghebremedhin B. Human adenovirus: Viral pathogen with increasing importance. Eur. J. Microbiol. Immunol. 2014;4:26–33. doi: 10.1556/EuJMI.4.2014.1.2. - DOI - PMC - PubMed
    1. Li L., Woo Y.Y., de Bruyne J.A., Nathan A.M., Kee S.Y., Chan Y.F., Chiam C.W., Eg K.P., Thavagnanam S., Sam I.C. Epidemiology, clinical presentation and respiratory sequelae of adenovirus pneumonia in children in Kuala Lumpur, Malaysia. PLoS ONE. 2018;13:e0205795. doi: 10.1371/journal.pone.0209720. - DOI - PMC - PubMed

Publication types