

Response strategies for COVID-19 epidemics in African settings: a mathematical modelling study
- PMID: 33050951
- PMCID: PMC7553800
- DOI: 10.1186/s12916-020-01789-2
Response strategies for COVID-19 epidemics in African settings: a mathematical modelling study
Abstract
Background: The health impact of COVID-19 may differ in African settings as compared to countries in Europe or China due to demographic, epidemiological, environmental and socio-economic factors. We evaluated strategies to reduce SARS-CoV-2 burden in African countries, so as to support decisions that balance minimising mortality, protecting health services and safeguarding livelihoods.
Methods: We used a Susceptible-Exposed-Infectious-Recovered mathematical model, stratified by age, to predict the evolution of COVID-19 epidemics in three countries representing a range of age distributions in Africa (from oldest to youngest average age: Mauritius, Nigeria and Niger), under various effectiveness assumptions for combinations of different non-pharmaceutical interventions: self-isolation of symptomatic people, physical distancing and 'shielding' (physical isolation) of the high-risk population. We adapted model parameters to better represent uncertainty about what might be expected in African populations, in particular by shifting the distribution of severity risk towards younger ages and increasing the case-fatality ratio. We also present sensitivity analyses for key model parameters subject to uncertainty.
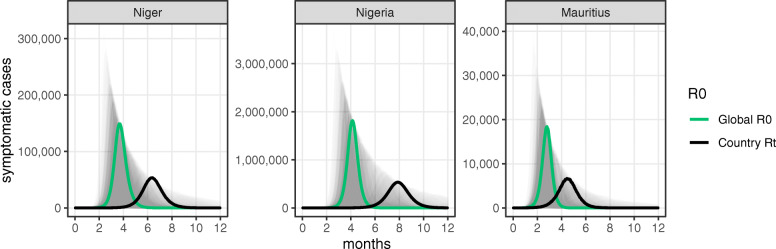
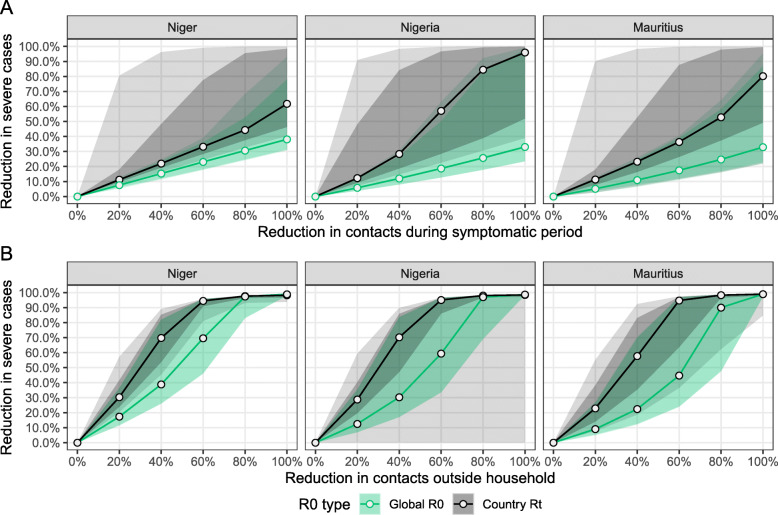
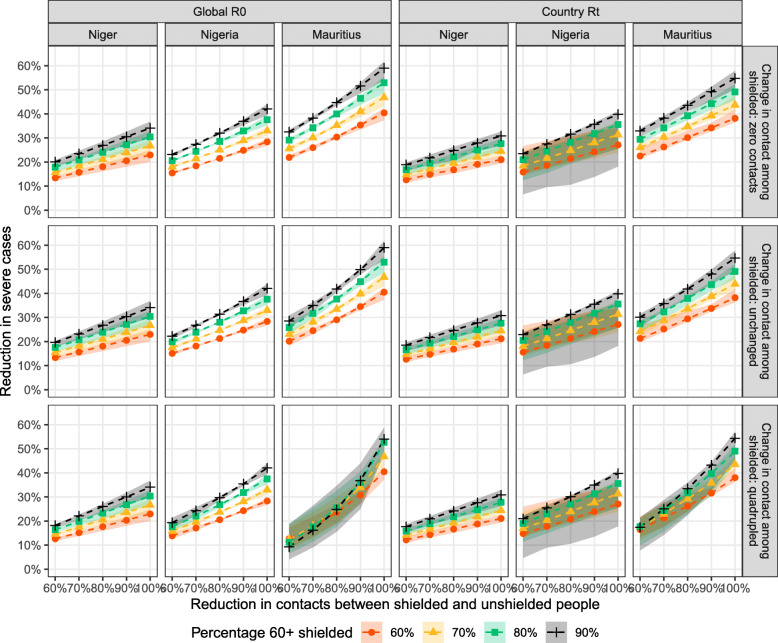
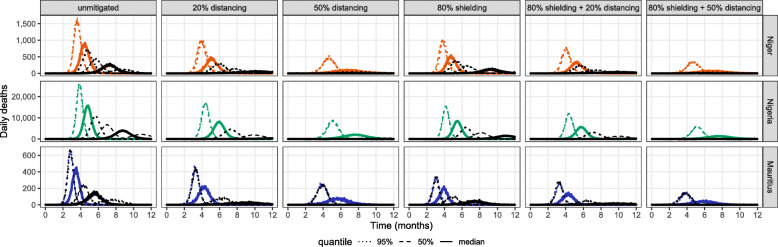
Results: We predicted median symptomatic attack rates over the first 12 months of 23% (Niger) to 42% (Mauritius), peaking at 2-4 months, if epidemics were unmitigated. Self-isolation while symptomatic had a maximum impact of about 30% on reducing severe cases, while the impact of physical distancing varied widely depending on percent contact reduction and R0. The effect of shielding high-risk people, e.g. by rehousing them in physical isolation, was sensitive mainly to residual contact with low-risk people, and to a lesser extent to contact among shielded individuals. Mitigation strategies incorporating self-isolation of symptomatic individuals, moderate physical distancing and high uptake of shielding reduced predicted peak bed demand and mortality by around 50%. Lockdowns delayed epidemics by about 3 months. Estimates were sensitive to differences in age-specific social mixing patterns, as published in the literature, and assumptions on transmissibility, infectiousness of asymptomatic cases and risk of severe disease or death by age.
Conclusions: In African settings, as elsewhere, current evidence suggests large COVID-19 epidemics are expected. However, African countries have fewer means to suppress transmission and manage cases. We found that self-isolation of symptomatic persons and general physical distancing are unlikely to avert very large epidemics, unless distancing takes the form of stringent lockdown measures. However, both interventions help to mitigate the epidemic. Shielding of high-risk individuals can reduce health service demand and, even more markedly, mortality if it features high uptake and low contact of shielded and unshielded people, with no increase in contact among shielded people. Strategies combining self-isolation, moderate physical distancing and shielding could achieve substantial reductions in mortality in African countries. Temporary lockdowns, where socioeconomically acceptable, can help gain crucial time for planning and expanding health service capacity.
Keywords: Africa; COVID-19; Control; Coronavirus; Low-income; Mathematical model; Response; SARS-CoV-2.
Conflict of interest statement
The authors declare that they have no competing interests.
Figures
References
-
- Organization WH. Coronavirus disease 2019 (COVID-19) Situation Report – 164. https://www.who.int/emergencies/diseases/novel-coronavirus-2019/situatio.... Accessed 3 Jul 2020.
-
- ACAPS. COVID-19: Government Measures. https://www.acaps.org/special-report/covid-19-government-measures. Accessed 3 Jul 2020.
-
- Chiyomaru K, Takemoto K. Global COVID-19 transmission rate is influenced by precipitation seasonality and the speed of climate temperature warming. medRxiv. 2020. 10.1101/2020.04.10.20060459.
-
- World Bank . Hospital beds (per 1,000 people) | data. 2020.
Publication types
MeSH terms
Grants and funding
LinkOut - more resources
Full Text Sources
Miscellaneous
