. 2020 Oct 14:9:e60354.
doi: 10.7554/eLife.60354.

3D visualization of macromolecule synthesis

Affiliations

3D visualization of macromolecule synthesis

Timothy J Duerr et al. Elife. .

Abstract

Measuring nascent macromolecular synthesis in vivo is key to understanding how cells and tissues progress through development and respond to external cues. Here we perform in vivo injection of alkyne- or azide-modified analogs of thymidine, uridine, methionine, and glucosamine to label nascent synthesis of DNA, RNA, protein, and glycosylation. Three-dimensional volumetric imaging of nascent macromolecule synthesis was performed in axolotl salamander tissue using whole-mount click chemistry-based fluorescent staining followed by light sheet fluorescent microscopy. We also developed an image processing pipeline for segmentation and classification of morphological regions of interest and individual cells, and we apply this pipeline to the regenerating humerus. We demonstrate our approach is sensitive to biological perturbations by measuring changes in DNA synthesis after limb denervation. This method provides a powerful means to quantitatively interrogate macromolecule synthesis in heterogenous tissues at the organ, cellular, and molecular levels of organization.

Keywords: Axolotl; click-chemistry; developmental biology; light sheet fluorescence microscopy; macromolecules; regenerative medicine; stem cells; whole mount.

Plain language summary

Cells often respond to changes in their environment by producing new molecules and building new cell components, such as proteins, which perform most tasks in the cell, or DNA and RNA, which carry genetic information. Complex tissues – such as limbs, which are made up of muscles, tendons, bones and cartilage – are difficult to see through, so studying when and where cells in these tissues produce different types of molecules is challenging. New approaches combining advanced three-dimensional microscopy and fluorescent labelling of molecules could provide a way to study these processes within whole animal tissues. One application for this is studying how salamanders regrow lost limbs. When salamanders such as axolotls regrow a limb, some cells in the limb stump form a group called the blastema. The blastema contains cells that are specialized to different purposes. Each cell in the blastema produces many new proteins as well as new DNA and RNA molecules. Fluorescently labeling particular molecules and taking images of the regenerating limb at different times can help to reveal how these new molecules control and coordinate limb regrowth. Duerr et al. developed a three-dimensional microscopy technique to study the production of new molecules in regenerating axolotl limbs. The method labeled molecules of different types with fluorescent markers. As a result, new proteins, RNA and DNA glowed under different colored lights. Duerr et al. used their method to show that nerve damage, which hinders limb regrowth in salamanders, reduces DNA production in the blastema. There are many possible applications of this microscopy method. Since the technique allows the spatial arrangement of the cells and molecules studied to be preserved, it makes it possible to investigate which molecules each cell is making and how they interact across a tissue. Not only does the technique have the potential to reveal much more about limb regrowth at all stages, but the fluorescent markers used can also be easily adapted to many other applications.


Conflict of interest statement

TD, EC, EJ, JF, MJ, JG, SS, JM No competing interests declared

Figures

Figure 1.
Figure 1.. Outline of staining/analysis pipeline and exemplary images.
(A) Overview of entire sample preparation, imaging, and data analysis pipeline. (B–D) Once macromolecules are labeled in vivo, synthesis can be visualized throughout the injected animal. Here we show DNA synthesis (EdU) in the torso of a stage 52 larvae (B) and both DNA synthesis and protein glycosylation (GlcNAz) in the hand (C) and finger (D). For panels B-D, animals were pulsed with the corresponding macromolecule analog(s) for 3 hr. Images from panels B and C were uncleared and imaged at 5× magnification. Image from panel D was also uncleared and imaged at 10× magnification. Scale bars for panels B and C = 600 µm for each axis. Scale bars for panel D = 200 µm for each axis.
Figure 2.
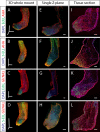
Figure 2.. Dual staining of macromolecule synthesis in whole-mount imaging.
(A–D) Stitched and fused 3D reconstruction of 13 dpa blastemas stained for multiple macromolecules obtained by LSFM. (E–H) Single Z-plane from A-D that represents the entirety of the blastema. (I–L) Tissue section from identically treated limbs as A-H showing similar macromolecule staining patterns, indicating that the whole-mount staining method does not alter macromolecule synthesis staining patterns. Scale bars for panels A-D = 600 µm for each axis. Scale bars for panels E-L = 200 µm.
Figure 2—figure supplement 1.
Figure 2—figure supplement 1.. Color blind friendly images from Figure 2.
(A–I) Color blind friendly images of DAPI, EdU, and AHA stained limbs. (J–R) Color blind friendly images of DAPI, 5-EU, and AHA stained limbs. (S–Aa) Color blind friendly images of DAPI, EdU, and GlcNAz stained limbs. (Ab-Aj) Color blind friendly images of DAPI, 5-EU, and GlcNAz stained limbs. A-C = 800 µm for each axis. Scale bars for panels J-L, S-U, Ab-Ad = 400 µm for each axis. Scale bars for panels D-I, M-R, V-Aa, Ae-Aj = 200 µm.
Figure 2—figure supplement 2.
Figure 2—figure supplement 2.. Single staining of macromolecule synthesis in whole-mount imaging.
(A–C) Stitched and fused 3D reconstruction of 13 dpa blastemas stained for one macromolecule obtained by LSFM. (D–F) Single Z-plane from A-C that represents the entirety of the blastema. (G–I) Tissue section from identically treated limbs as A-F. (J–Aa) Grayscale images of A-I. Scale bars for panels A-C = 600 µm in each axis. Scale bars for panels D-I = 200 µm. Scale bars for grayscale images are identical to those in panels A-I.
Figure 2—figure supplement 3.
Figure 2—figure supplement 3.. Subcellular resolution obtained with LSFM.
(A) Cropped panel from Figure 2E. (B) Zoom in on panel A magnified 12.7×. (C) Zoom in on panel B magnified 6×. Scale bars = 100 µm.
Figure 2—figure supplement 4.
Figure 2—figure supplement 4.. Specificity of GlcNAz staining.
(A–D) Tissue section of a regenerating axolotl limb where the click-it cocktail for GlcNAz was applied before staining with GlcNAc antibodies (Ab). (E–H) Tissue section of a regenerating axolotl limb where GlcNAc antibodies were applied before treatment with the click-it cocktail for GlcNAz, demonstrating the specificity of the in vivo GlcNAz labeling. Scale bars = 100 µm.
Figure 2—figure supplement 5.
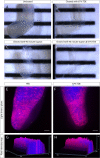
Figure 2—figure supplement 5.. Comparison of imaging in PBS and 67%TDE.
(A–B) Regenerating axolotl limb before (A) and after (B) clearing with 67% TDE. (C–D) Regenerating axolotl limb treated with 0.5% trypsin (C) and cleared in 67% TDE (D). (E–F) Single Z-plane of 13 dpa blastema imaged in PBS (E) or cleared and imaged in 67% TDE (F). Red indicates EdU staining whereas blue represents DAPI staining. Scale bars for panels E-F = 100 µm (G–H) Pixel intensity map of PBS imaged blastema (G) and 67% TDE imaged blastema (H). Scale bars are in units of microns.
Figure 3.
Figure 3.. Workflow for 3D, multiscale analysis of the regenerating axolotl humerus.
Multiscale analysis of a 35 dpa regenerating axolotl humerus, stained for AHA (red) and EdU (green). The humerus in the image stack was (A) aligned along the proximodistal (P–D) axis and (B) its morphology was segmented. The resulting mask was used to analyze the organ volume and shape by (D) reslicing it along the P-D axis and studying the cross-sections obtained. (C) The segmented morphology in B was used to mask the green channel for cellular- and molecular-level analyses. (E) Cells in the humerus were segmented and their spatial distribution was analyzed to obtain cellular number and density. (F) The masked image stack in C was resliced along the P-D axis and the pixel maps of the cross-sections were used to characterize the molecular intensity and distribution within the humerus. The vertical yellow line in A and C indicates the plane of amputation.
Figure 4.
Figure 4.. 3D quantification across scales of a regenerating axolotl humerus.
(A) The cross-sections of the humerus in Figure 3D were analyzed with the Fiji plugin BoneJ to quantify humerus shape and volume. (A’) The cross-sectional area along the proximodistal (P–D) axis provides a measure of volume distribution along the humerus. (A”) The ratio of the maximum chord length from the minor axis (2 R1) with respect to the maximum chord length from the major axis (2 R2) provides a measure of cross-sectional circularity in the humerus. Values closer to 1.0 in the proximal side indicate a more circular cross-section in this zone. (B) The Fiji plugin Trainable Weka Segmentation 3D and 3D Objects Counter were used in the cellular analysis of proliferating chondrocytes illustrated in Figure 3E. (B’) The number of EdU+ cells within a 50 µm slice along the P-D axis was divided by the slice volume to obtain a density-like measure. (B”) The center of mass of each cell was plotted in 3D, with point size and color proportional to the segmented cell volume. (C) The molecular intensity and distribution were analyzed based on the resliced pixel intensity maps of the masked green channel in Figure 3F. (C’) Mean intensity of each slice perpendicular to the P-D axis. (C”) The histogram of the EdU staining in the humerus can provide a measure of the DNA synthesis rate. The vertical yellow line in the top row images indicates the plane of amputation.
Figure 5.
Figure 5.. 3D visualization of DNA synthesis in innervated/denervated regenerating limbs.
(A) Schematic of experimental design used to obtain samples from B-O. (B–O) Time course of regeneration in innervated and 24 hr denervated limbs at 0, 6, 9, 12, 15, 18, and 25 dpa. Scale bars for panels B-O = 600 µm for each axis.
Figure 6.
Figure 6.. 3D quantification of DNA synthesis in innervated/denervated regenerating limbs.
(A) A cube with sides of 175 µm was cropped along the proximodistal axis 250 µm from the distal tip of each blastema. P = proximal, D = distal. (B) Violin plots illustrate the pixel intensity of the innervated vs denervated blastema cubes. Comparison of mean intensity values (marked with a cross) of the same animal confirms that innervated blastemas have faster DNA synthesis rates than their denervated counterparts.
Figure 6—figure supplement 1.
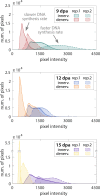
Figure 6—figure supplement 1.. Pixel intensity histograms from innervated and denervated limbs.
Histograms depicting EdU pixel intensity from innervated and denervated limbs. Data are the same as in Figure 6B.

References

    1. Arganda-Carreras I, Kaynig V, Rueden C, Eliceiri KW, Schindelin J, Cardona A, Sebastian Seung H. Trainable weka segmentation: a machine learning tool for microscopy pixel classification. Bioinformatics. 2017;33:2424–2426. doi: 10.1093/bioinformatics/btx180. - DOI - PubMed
    1. Best MD. Click chemistry and bioorthogonal reactions: unprecedented selectivity in the labeling of biological molecules. Biochemistry. 2009;48:6571–6584. doi: 10.1021/bi9007726. - DOI - PubMed
    1. Chung K, Wallace J, Kim SY, Kalyanasundaram S, Andalman AS, Davidson TJ, Mirzabekov JJ, Zalocusky KA, Mattis J, Denisin AK, Pak S, Bernstein H, Ramakrishnan C, Grosenick L, Gradinaru V, Deisseroth K. Structural and molecular interrogation of intact biological systems. Nature. 2013;497:332–337. doi: 10.1038/nature12107. - DOI - PMC - PubMed
    1. Dodt H-U, Leischner U, Schierloh A, Jährling N, Mauch CP, Deininger K, Deussing JM, Eder M, Zieglgänsberger W, Becker K. Ultramicroscopy: three-dimensional visualization of neuronal networks in the whole mouse brain. Nature Methods. 2007;4:331–336. doi: 10.1038/nmeth1036. - DOI - PubMed
    1. Doube M, Kłosowski MM, Arganda-Carreras I, Cordelières FP, Dougherty RP, Jackson JS, Schmid B, Hutchinson JR, Shefelbine SJ. BoneJ: free and extensible bone image analysis in ImageJ. Bone. 2010;47:1076–1079. doi: 10.1016/j.bone.2010.08.023. - DOI - PMC - PubMed

Publication types

MeSH terms