. 2020 Oct 13;11(1):5145.
doi: 10.1038/s41467-020-18885-9.

Leptin alters energy intake and fat mass but not energy expenditure in lean subjects

Affiliations

Leptin alters energy intake and fat mass but not energy expenditure in lean subjects

Pavlina Chrysafi et al. Nat Commun. .

Abstract

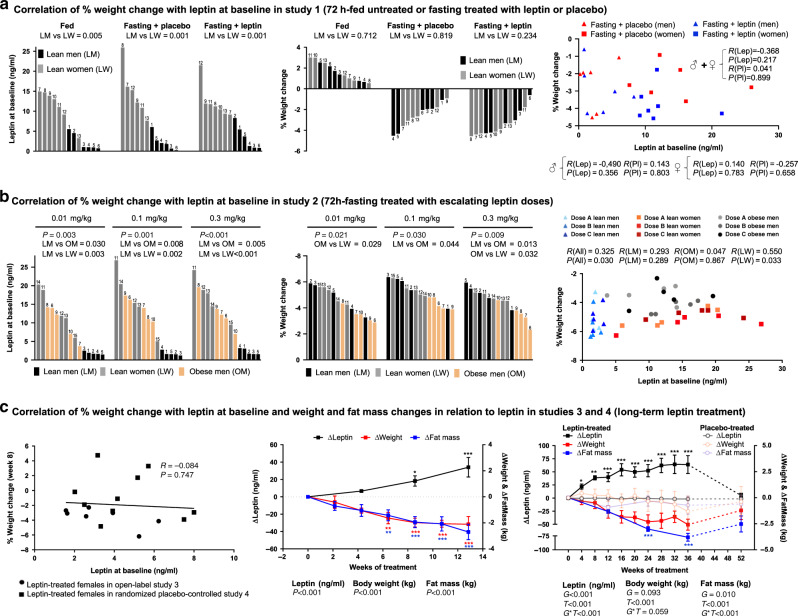
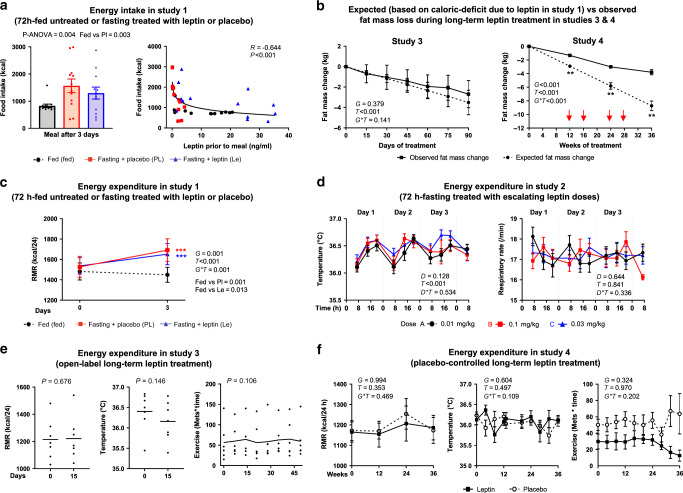
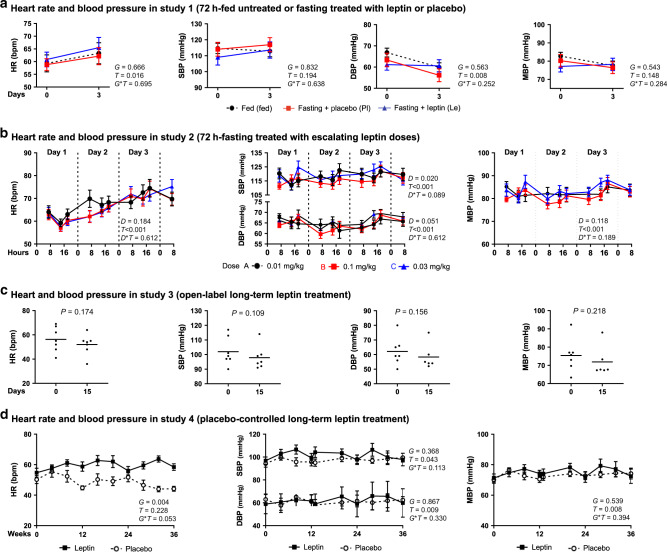
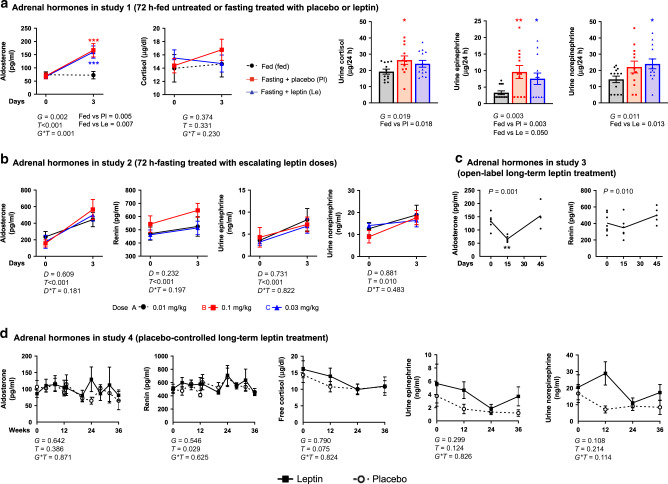
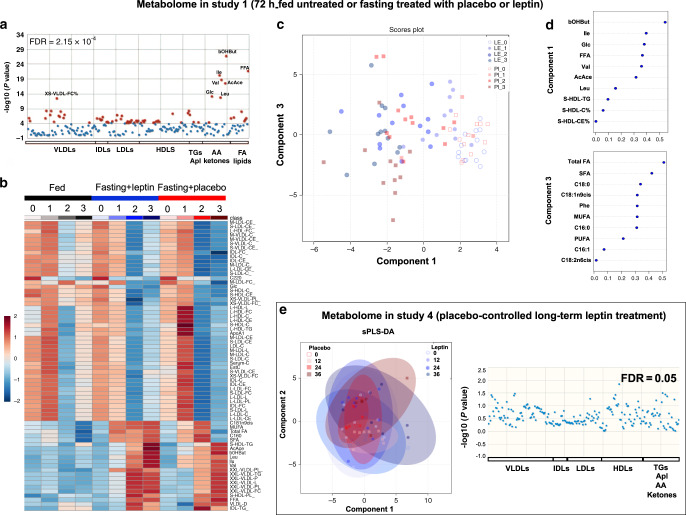
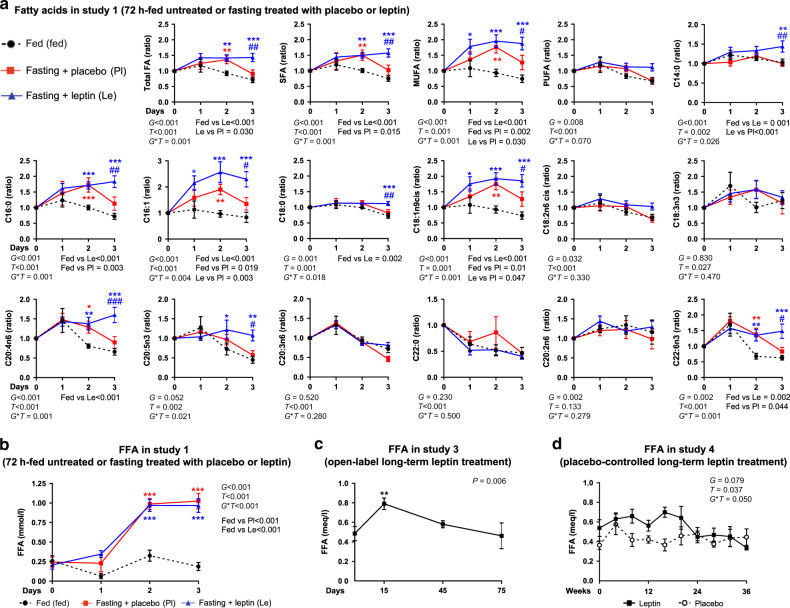
Based on studies in mice, leptin was expected to decrease body weight in obese individuals. However, the majority of the obese are hyperleptinemic and do not respond to leptin treatment, suggesting the presence of leptin tolerance and questioning the role of leptin as regulator of energy balance in humans. We thus performed detailed novel measurements and analyses of samples and data from our clinical trials biobank to investigate leptin effects on mechanisms of weight regulation in lean normo- and mildly hypo-leptinemic individuals without genetic disorders. We demonstrate that short-term leptin administration alters food intake during refeeding after fasting, whereas long-term leptin treatment reduces fat mass and body weight, and transiently alters circulating free fatty acids in lean mildly hypoleptinemic individuals. Leptin levels before treatment initiation and leptin dose do not predict the observed weight loss in lean individuals suggesting a saturable effect of leptin. In contrast to data from animal studies, leptin treatment does not affect energy expenditure, lipid utilization, SNS activity, heart rate, blood pressure or lean body mass.

Trial registration: ClinicalTrials.gov NCT00140231 NCT00140205 NCT00130117.


Conflict of interest statement

C.S.M. is advisor of Ansh Labs LLC, and consultant to Novo Nordisk and grant recipient through BIDMC and has served as an advisor to Aegerion and Visiting Professor to Regeneron. The remaining authors declare no competing interests.

Figures

Fig. 1
Fig. 1. Schematic representation of the study designs of the four clinical studies.
Study 1: Eight healthy lean men and seven healthy lean women were studied under three separate Clinical Research Center (CRC)-based conditions for 72 h: one under isocaloric fed state conditions (normoleptinemia) and two during complete fasting state conditions (induced hypoleptinemia) scheduled in a random order and in a double-blind fashion with administration of physiologic replacement leptin doses (fasting + leptin) or placebo (fasting + placebo). Study 2: Five lean men, five men with obesity, and five lean women participated in three fed-normoleptinemic and three fasting-induced hypoleptinemic studies, which were conducted in the CRC, with leptin administration at three different doses (Dose A = 0.01 mg/kg, Dose B = 0.1 mg/kg, Dose C = 0.3 mg/kg). Study 3: Open-label long-term leptin treatment in mildly hypoleptinemic women. Study 4: Placebo-controlled long-term leptin treatment in mildly hypoleptinemic women.
Fig. 2
Fig. 2. Leptin effects on weight and fat mass.
a Cross-over study of lean subjects during 72-h fed state, fasting+placebo and fasting+leptin (study 1; n = 13). Left: baseline leptin levels in each admission. Center: % weight change at the end of each admission. Right: correlation of baseline leptin with % weight change at the end of each admission. Numbers above bars correspond to subject ID. P values of unpaired t test between lean men (LM) vs lean women (LW) and of correlations are reported; R, correlation coefficient. b Cross-over study of LM, LW, and obese men (OM) in 72-h fasting treated with escalating leptin doses (study 2; n = 15). Left: baseline leptin levels in each admission, Center: % weight change at the end of each admission. Right: correlation of baseline leptin with % weight change at the end of each admission. Numbers above bars correspond to subject ID. P values from one-way ANOVA, from post hoc Bonferroni test between LM vs LW vs OW and from correlations are reported. c Open-label (study 3; n = 7) and placebo-controlled long-term leptin treatment study (study 4; n = 19 (leptin = 10; placebo = 9)) in women with mild hypoleptinemia. Left: correlation of baseline leptin with % weight change after 8 weeks of leptin treatment. Subjects of study 3 were combined with leptin-treated subjects of study 4 in one analysis. Center and right: changes of leptin, body weight, and fat mass from baseline (Δ = change from baseline at each timepoint). In study 4, dashed lines correspond to the washout period after 36 weeks of study. In study 3, P values (P) for time effect (i.e., days of treatment) and in study 4, P values of G (group: leptin or placebo), T (time: weeks of treatment), and G*T interaction of mixed models adjusted for baseline are reported. By P < 0.05 (study 3) and G*T < 0.05 (study 4), post hoc Bonferroni test was performed (only significant results are reported). One, two, or three asterisks indicate P < 0.05, <0.01, or <0.001 for the specific timepoint vs baseline in study 3 and for leptin vs placebo in the specific timepoint in study 4. Correlations were performed with Pearson’s or Spearman’s correlation test. Data are presented as means ± SEMs. Exact P values: b, left: leptin at baseline dose 0.3 mg/kg = 0.003 × 10−1; leptin at baseline dose 0.3 mg/kg LM vs LW = 0.003 × 10−1. c Center: leptin = 0.003 × 10−1; weight = 0.001 × 10−3; fat mass = 0.002 × 10−5; leptin post hoc test at 81/2 weeks = 0.031 and at 13 weeks = 0.003 × 10−1. Weight post hoc test at 61/2 weeks = 0.002, at 81/2 weeks = 0.001 × 10−1, at 11 weeks = 0.001 × 10−1, and at 13 weeks = 0.001 × 10−1. Fat mass post hoc test at 61/2 weeks = 0.002, at 81/2 weeks = 0.002 × 10−2, at 11 weeks = 0.005 × 10−3, and at 13 weeks = 0.004 × 10−4. c, Right: leptin G = 0.005 × 10−2; T = 0.007 × 10−5; G*T = 0.002 × 10−5; body weight T = 0.007 × 10−5; fat mass T = 0.009 × 10−5; G*T = 0.001 × 10−2; leptin post hoc test at 4 weeks = 0.039; at 8 weeks = 0.001; at 12 weeks = 0.004 × 10−1; at 16 weeks = 0.005 × 10−3; at 20 weeks = 0.003 × 10−2; at 24 weeks = 0.001 × 10−2; at 28 weeks = 0.002 × 10−3; at 32 weeks = 0.004 × 10−3; at 36 weeks = 0.002 × 10−3. Fat mass post hoc test at 24 weeks = 0.002 × 10−1; at 36 weeks = 0.001 × 10−1.
Fig. 3
Fig. 3. Short- and long-term leptin effects on energy intake and expenditure.
a Energy intake after 72-h in fed state, fasting+placebo, or fasting + leptin (study 1, n = 13). P values from repeated measure ANOVA and post hoc Bonferroni test are reported. R, correlation coefficient. b Expected (based on leptin-induced caloric deficit in study 1) vs observed fat mass loss during long-term leptin treatment in studies 3 and 4. As per the protocol, in study 4, if a subject lost >5% of baseline weight, the dose was reduced by 0.04 mg/kg (red arrows). P values of G (group: observed or expected fat mass change), T (days/weeks of treatment), and G*T interaction of mixed models are reported. By G*T < 0.05, post hoc Bonferroni test was performed: two asterisks indicate P < 0.01 for observed vs expected fat mass change at the specific timepoint. c Energy expenditure during 72-h fed state, fasting+ placebo, and fasting + leptin (study 1, n = 13). P values of G (group: fed, fasting + placebo, fasting + leptin), T (days of treatment), and G*T interaction of mixed models adjusted for baseline are reported. Post hoc Bonferroni test was performed between the estimated means of the three groups and between the three groups at each timepoint. Three asterisks indicate P < 0.001 for fed vs fasting + placebo (red) and fed vs fasting + leptin (blue). d Energy expenditure during 72-h fasting treated with escalating leptin doses (study 2, n = 15). P values of D (dose: 0.01, 0.1, and 0.3 mg/kg/d), T (hours of fasting), and D*T interaction of mixed models adjusted for baseline are reported. e Energy expenditure during open-label long-term leptin treatment in mildly hypoleptinemic women (study 3, n = 7). P values of paired t test (RMR and body temperature) and of time effect of mixed models adjusted for baseline (exercise score) are reported. No post hoc test was performed since P > 0.05. f Energy expenditure during placebo-controlled long-term leptin treatment in mildly hypoleptinemic women (study 4, n = 19 (leptin = 10; placebo = 9)). P values of G (group: placebo or leptin), T (weeks of study), and G*T interaction of mixed models adjusted for baseline are reported. No post hoc test was performed since G*T > 0.05. All P values are two-sided. For post hoc Bonferroni test, only significant results are reported. Data are demonstrated as means ± SEMs. Exact P values: a Correlation of food intake with leptin prior to meal = 0.002 × 10−2. b Study 4: post hoc test at 12 weeks = 0.002; at 24 weeks = 0.001; at 36 weeks = 0.003. c Day 3 fed vs Pl = 0.004 × 10−3; fed vs Le = 0.003 × 10−1. d Temperature T = 0.002 × 10−12.
Fig. 4
Fig. 4. Leptin effects on heart rate and blood pressure.
a Seventy-two hours fed state or fasting + leptin or fasting + placebo (study 1, n = 13). P values of G (group: fed or fasting + placebo or fasting + leptin), T (time: days of study), and G*T interaction of mixed models adjusted for baseline are reported. b Seventy-two hours fasting treated with escalating leptin doses (study 2, n = 15). P values of D (dose: 0.01 or 0.1 or 0.3 mg/kg/d), T (time: hours of fasting), and D*T interaction of mixed models adjusted for baseline are reported. c Open-label long-term leptin treatment in mildly hypoleptinemic women (study 3, n = 7). P value (P) of paired t test is reported. d Placebo-controlled long-term leptin treatment in mildly hypoleptinemic women (study 4, n = 19 (leptin = 10; placebo = 9)). P values of G (group: placebo or leptin), T (time: weeks of study), and G*T interaction of mixed models adjusted for baseline are reported. No post hoc Bonnferroni test was performed since G*T > 0.05 (studies 1 and 4) and D*T > 0.05 (study 2). All P values are two-sided. Data are demonstrated as means ± SEMs. Exact P values: b HR T = 0.001 × 10−17; SBP T = 0.003 × 10−1; DBP T = 0.002 × 10−2; MBP T = 0.002 × 10−2.
Fig. 5
Fig. 5. Leptin effects on adrenal hormones.
a Seventy-two hours fed state or fasting+leptin or fasting + placebo (study 1, n = 13). Left: blood aldosterone and cortisol at the start and completion of the study. Right: 24-h urine cortisol, epinephrine, and norepinephrine collected at the last day of the study. P values of G (group: fed or fasting + placebo or fasting + leptin), T (time: days of study), and G*T interaction of mixed models, adjusted for baseline are reported. For urine catecholamines, P values were calculated with repeated measure ANOVA, since only the group factor existed. By G*T < 0.05 (blood aldosterone and cortisol) and by G < 0.05 (urine catecholamines), post hoc Bonferroni test was performed between the estimated means of the three groups and between the three groups at each timepoint. Three asterisks indicate P < 0.001 for fed vs fasting + placebo (red) and for fed vs fasting + leptin (blue) at the particular timepoint. b Seventy-two hours of fasting treated with escalating leptin doses (study 2, n = 15). P values of D (dose: 0.01 or 0.1 or 0.3 mg/kg/d), T (time: days of fasting), and D*T interaction of mixed models adjusted for baseline are reported. No post hoc Bonnferroni test was performed since D*T > 0.05. c Open-label long-term leptin treatment in mildly hypoleptinemic women (study 3, n = 7). P value (P) of time effect (i.e., days of study) of mixed models adjusted for baseline is reported. By P < 0.05 post hoc Bonferroni’s test for each timepoint compared to baseline was additionally performed and two asterisks indicate P < 0.01 for the specific timepoint vs 0 (baseline). d Placebo-controlled long-term leptin treatment in mildly hypoleptinemic women (study 4, n = 19 (leptin = 10; placebo = 9)). P values of G (group: placebo or leptin), T (time: weeks of study), and G*T interaction of mixed models adjusted for baseline are reported. No post hoc Bonnferroni test was performed since G*T > 0.05. For Bonferroni post hoc tests, only significant results are reported. All P values are two-sided. Data are demonstrated as means ± SEMs. Exact P values: a aldosterone T = 0.001 × 10−3; day 3 post hoc test for fed vs Pl = 0.004 × 10−2; fed vs Le = 0.006 × 10−2. b Aldosterone T = 0.001 × 10−15; renin T = 0.005 × 10−17; urine epinephrine T = 0.004 × 10−1. c Aldosterone post hoc test at 15 days = 0.005.
Fig. 6
Fig. 6. Metabolome changes with short- and long-term leptin treatment.
ad Effects on metabolite and lipid metabolism of 72-h fed state or fasting treated with leptin or placebo (study 1, n = 13). a Evaluation of metabolites, lipids, and lipoproteins with one-way ANOVA between the three admissions. Red dots indicate parameters significantly different and blue dots parameters not significantly different between groups (fed vs fasting + placebo vs fasting + leptin) with a preset false discovery rate of P < 2.15 × 10−4 (total 68 parameters significant). b Heatmap of the 68 significant parameters according to one-way ANOVA for the three admissions. c sPLS-DA analysis of fasting+leptin vs fasting + placebo: symbols indicate the measurement of component 1 in relation to measurement of component 3 for one subject/on one treatment/on one day of fasting: Blue circles correspond to leptin and red squares to placebo. Increasing color intensity indicates more time (days) of fasting. d The ten parameters that compose components 1 and 3 and their level of contribution (loading) to the component. e Effects on metabolite and lipid metabolism of long-term leptin treatment in mildly hypoleptinemic women (placebo-controlled study 4, n = 19 (leptin = 10; placebo = 9)). Left: sPLS-DA analysis of metabolites and lipoproteins in placebo vs leptin. Symbols indicate the measurement of component 1 in relation to component 2 for one subject/on one treatment/on one day of study: blue circles correspond to leptin and red squares to placebo. Increasing color intensity of symbol indicates more time (weeks) of study. Large oval-colored shapes indicate 95% confidence interval for each group. The observed major overlap between groups suggests no significant differences between placebo and leptin. Right: Evaluation of metabolites and lipoproteins with one-way ANOVA in placebo and leptin-treated subjects for up to 36 weeks. Each dot represents a parameter (blue dot = nonsignificant parameter, red = preset color for significant parameters but no such parameter was detected). NMR-based metabolomics were used to quantify amino acids, metabolites, and lipids bound to lipoproteins. GC/MS-EI was used to quantify fatty acid methyl esters. Le_0, Le_1 etc. indicate day 0 (baseline), 1 etc. of fasting + leptin. Pl_0, Pl_1 etc. indicate day 0 (baseline), 1 etc. of fasting + placebo. For metabolite nomenclature, see Supplementary Data 2.
Fig. 7
Fig. 7. Fatty acid changes with short- and long-term leptin treatment.
a, b Seventy-two hours fed state or fasting+leptin or fasting+placebo (study 1, n = 13). a Blood concentrations of fatty acid profile from start and till completion of the study as ratios of the baseline (0 day). GC/MS-EI was used to quantify fatty acid methyl esters in whole plasma. b Blood-free fatty acids (FFA) from start and till completion of the study; mixed model was performed (for FFA adjusted for baseline). P values of G (group: fed or fasting + placebo or fasting + leptin), T (time: days of study), and G*T interaction of mixed models are reported. In panels a and b by G*T < 0.05, post hoc Bonferroni test was performed between the estimated means of the three groups and between the three groups at each timepoint. One, two, or three asterisks indicate P < 0.05, <0.01, or <0.001 for fed vs fasting + placebo (red) and for fed vs fasting + leptin (blue). One, two, or three hash signs indicate P < 0.05, <0.01, or <0.001 for fasting + leptin vs fasting + placebo in the Bonferroni post hoc t test. c Open-label long-term leptin treatment in mildly hypoleptinemic women (study 3, n = 7). Blood FFA concentrations. P value of time effect (i.e., days of study) of mixed models adjusted for baseline is reported. Two asterisks indicate P < 0.01 for the specific timepoint vs 0 (baseline) in the Bonferroni post hoc t test (performed by P < 0.05). d Placebo-controlled long-term leptin treatment in mildly hypoleptinemic women (study 4, n = 19 (leptin = 10; placebo = 9)). P values of G (group: placebo or leptin), T (time: weeks of study), and G*T interaction of mixed models adjusted for baseline are reported. By G*T < 0.05, post hoc Bonferroni test was additionally performed between the two groups at each timepoint. One or two asterisks indicate P < 0.05, or <0.01 for leptin vs placebo for the specific timepoint. For Bonferroni post hoc tests, only significant results are reported. All P values are two-sided. Data are demonstrated as means ± SEMs. Exact P values. a Total FA (ratio) G = 0.008 × 10−4; T = 0.002 × 10−1; fed vs Le = 0.004 × 10−1; day 2 fed vs Pl = 0.008 & fed vs Le = 0.002; day 3 fed vs Le = 0.001 × 10−1 & Le vs Pl = 0.002. SFA (ratio) G = 0.002 × 10−4; T = 0.003 × 10−2; fed vs Le = 0.008 × 10−5; day 2 fed vs Pl = 0.003 & fed vs Le = 0.002; day 3 fed vs Le = 0.001 × 10−1 & Le vs Pl = 0.001. MUFA (ratio) G = 0.002 × 10−6; fed vs Le = 0.008 × 10−7; day 1 fed vs Le = 0.021; day 2 fed vs Pl = 0.001 & fed vs Le = 0.001 × 10−1; day 3 fed vs Le = 0.001 × 10−1 & Le vs Pl = 0.036. PUFA (ratio) T = 0.005 × 10−3. C14:0 (ratio) G = 0.009 × 10−2; Le vs Pl = 0.004 × 10−1; day 3 fed vs Le = 0.002 & Le vs Pl = 0.002. C16:0 (ratio) G = 0.004 × 10−5; T = 0.002 × 10−2; fed vs Le = 0.002 × 10−5; day 2 fed vs Pl = 0.008 × 10−1 & fed vs Le = 0.008 × 10−1; day 3 fed vs Le = 0.001 × 10−1 & Le vs Pl = 0.002. C16:1 (ratio) G = 0.002 × 10−6; T = 0.004 × 10−2; fed vs Le = 0.007 × 10−7; day 1 fed vs Pl = 0.012; day 2 fed vs Pl = 0.009 & fed vs Le = 0.001 × 10−1; day 3 fed vs Le = 0.001 × 10−1 & Le vs Pl = 0.014. C18:0 (ratio) day 3 fed vs Le = 0.001 × 10−1 & Le vs Pl = 0.008. C18:1n9cis (ratio) G = 0.001 × 10−6; fed vs Le = 0.006 × 10−7; day 1 fed vs Le = 0.022; day 2 fed vs Pl = 0.001 & fed vs Le = 0.001 × 10−1; day 3 fed vs Le = 0.001 × 10−1 & Le vs Pl = 0.039. C18:2n6cis (ratio) T = 0.001 × 10−1; C20:4n6 (ratio) G = 0.002 × 10−1; T = 0.002 × 10−1; fed vs Le = 0.001 × 10−1; day 2 fed vs Pl = 0.022 & fed vs Le = 0.004; day 3 fed vs Le = 0.001 × 10−1 & Le vs Pl = 0.008 × 10−1. C20:5n3 (ratio) day 2 fed vs Le = 0.025; day 3 fed vs Le = 0.004 & Le vs Pl = 0.038. C20:3n6 (ratio) T = 0.006 × 10−12; C22:0 (ratio) T = 0.005 × 10−6; C22:6n3 (ratio) T = 0.001 × 10−3; day 2 fed vs Pl = 0.004 & fed vs Le = 0.004; day 3 fed vs Le = 0.003 × 10−1 & Le vs Pl = 0.011. b G = 0.004 × 10−11; T = 0.005 × 10−13; G*T = 0.004 × 10−3; fed vs Le = 0.005 × 10−10; fed vs Pl = 0.003 × 10−6; day 2 fed vs Le 0.002 × 10−7 & fed vs Pl = 0.004 × 10−5; day 3 fed vs Le = 0.008 × 10−9 & fed vs Pl = 0.001 × 10−10. c Post hoc test at 15 days = 0.002. d Post hoc test at 8 weeks = 0.011 and at 16 weeks = 0.002.

References

    1. Frederich RC, et al. Leptin levels reflect body lipid content in mice: evidence for diet-induced resistance to leptin action. Nat. Med. 1995;1:1311–1314. doi: 10.1038/nm1295-1311. - DOI - PubMed
    1. Considine RV, et al. Serum immunoreactive-leptin concentrations in normal-weight and obese humans. N. Engl. J. Med. 1996;334:292–295. doi: 10.1056/NEJM199602013340503. - DOI - PubMed
    1. Boden G, Chen X, Mozzoli M, Ryan I. Effect of fasting on serum leptin in normal human subjects. J. Clin. Endocrinol. Metab. 1996;81:3419–3423. - PubMed
    1. Wu B, et al. Effect of repeated fasting/refeeding on body weight control and energy balance regulation in rats. Wei Sheng Yan Jiu. 2010;39:601–605. - PubMed
    1. Audi L, et al. Leptin in relation to resumption of menses in women with anorexia nervosa. Mol. Psychiatry. 1998;3:544–547. doi: 10.1038/sj.mp.4000418. - DOI - PubMed

Publication types

MeSH terms

Associated data