. 2020 Oct 13;11(1):5151.
doi: 10.1038/s41467-020-18984-7.

Myelination of parvalbumin interneurons shapes the function of cortical sensory inhibitory circuits

Affiliations

Myelination of parvalbumin interneurons shapes the function of cortical sensory inhibitory circuits

Najate Benamer et al. Nat Commun. .

Abstract

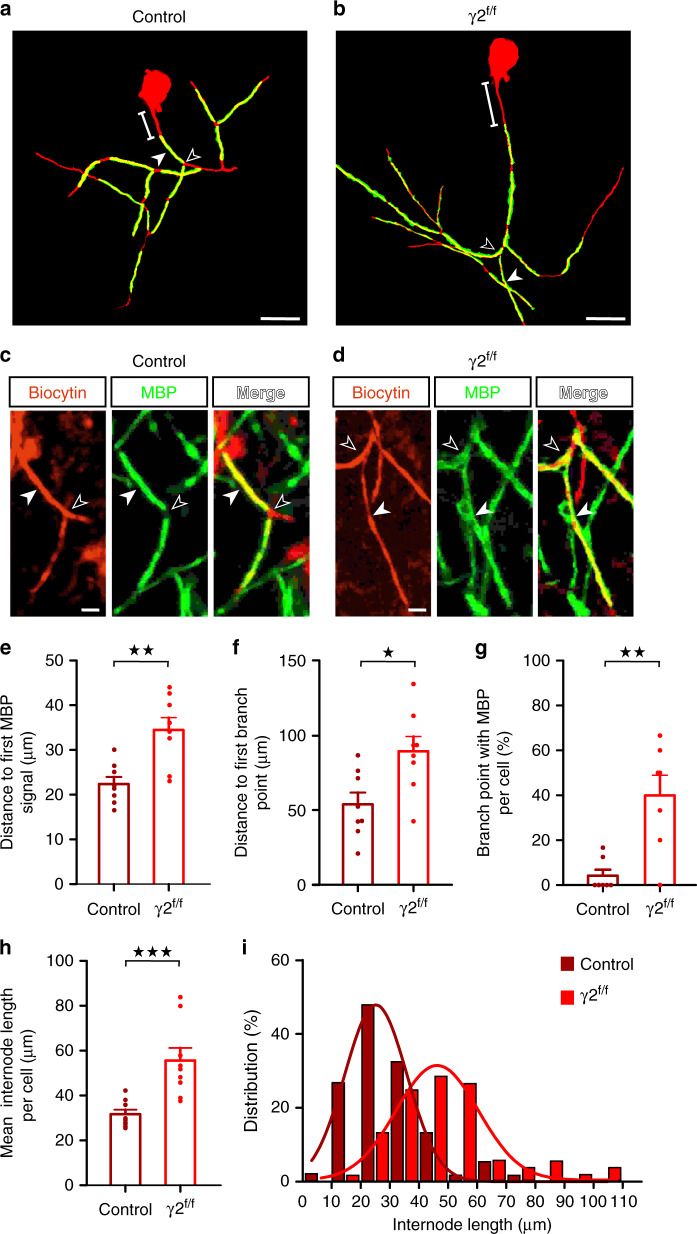
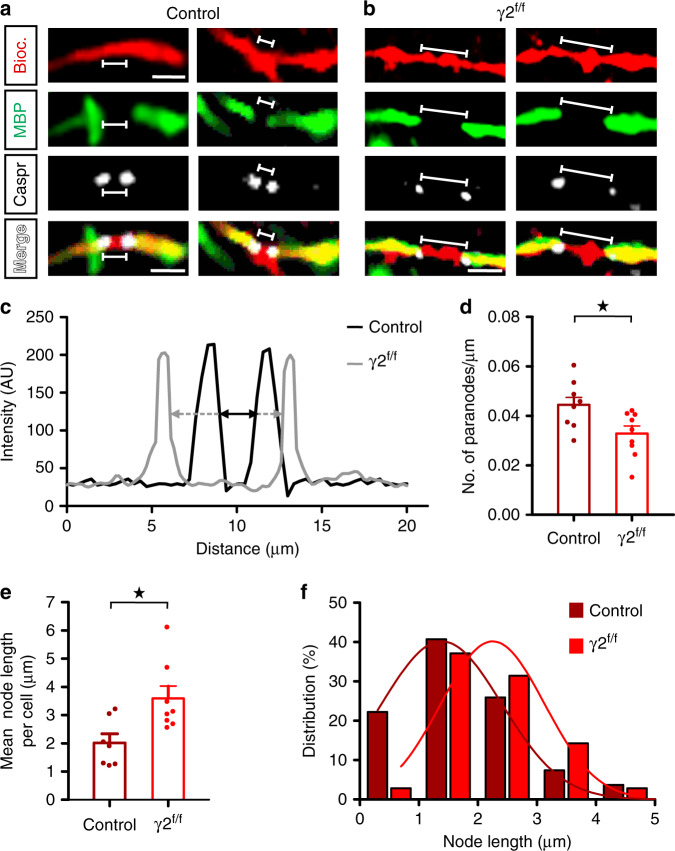
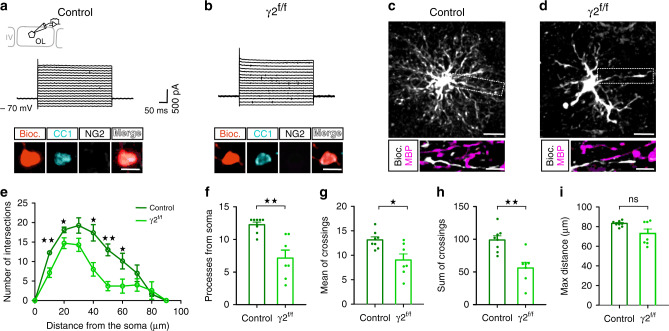
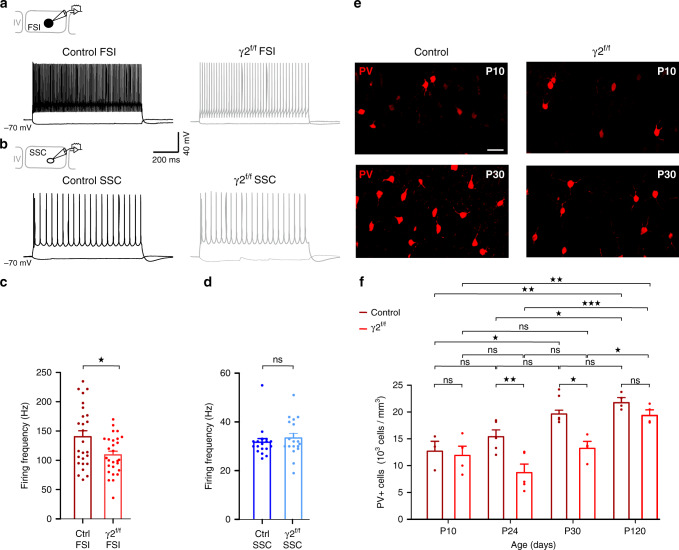
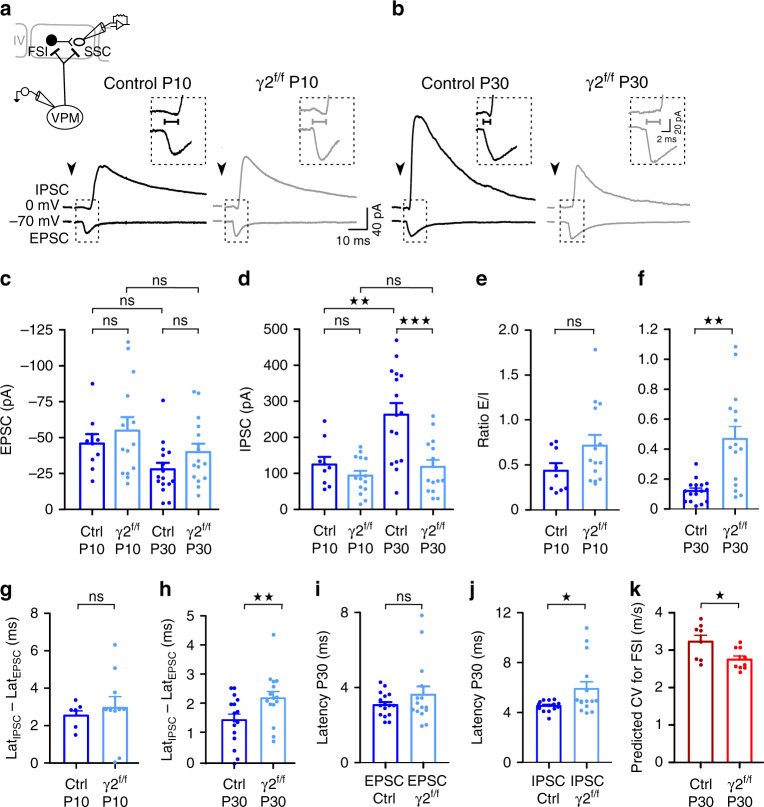
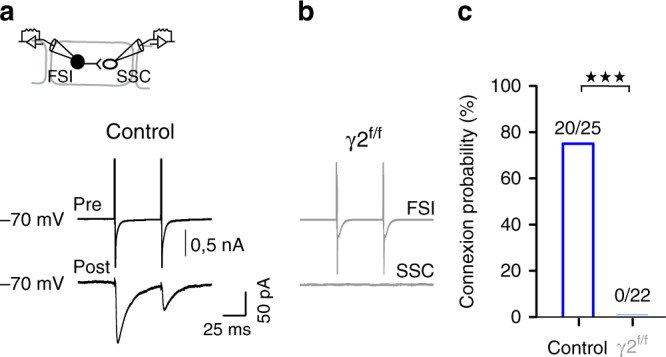
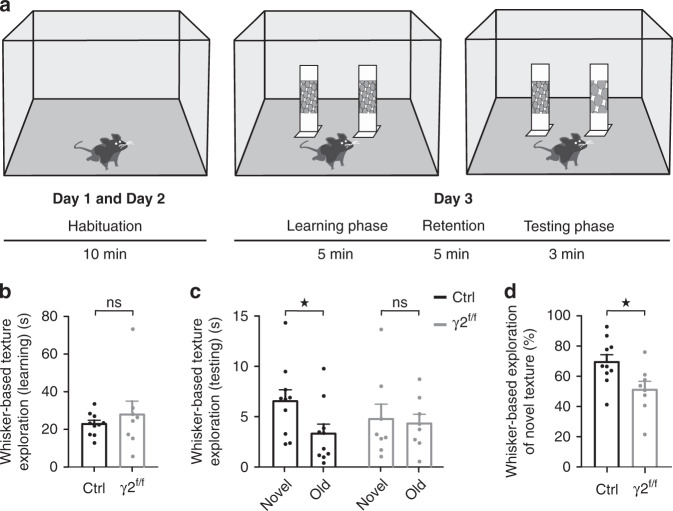
Myelination of projection neurons by oligodendrocytes is key to optimize action potential conduction over long distances. However, a large fraction of myelin enwraps the axons of parvalbumin-positive fast-spiking interneurons (FSI), exclusively involved in local cortical circuits. Whether FSI myelination contributes to the fine-tuning of intracortical networks is unknown. Here we demonstrate that FSI myelination is required for the establishment and maintenance of the powerful FSI-mediated feedforward inhibition of cortical sensory circuits. The disruption of GABAergic synaptic signaling of oligodendrocyte precursor cells prior to myelination onset resulted in severe FSI myelination defects characterized by longer internodes and nodes, aberrant myelination of branch points and proximal axon malformation. Consequently, high-frequency FSI discharges as well as FSI-dependent postsynaptic latencies and strengths of excitatory neurons were reduced. These dysfunctions generated a strong excitation-inhibition imbalance that correlated with whisker-dependent texture discrimination impairments. FSI myelination is therefore critical for the function of mature cortical inhibitory circuits.


Conflict of interest statement

The authors declare no competing interests.

Figures

Fig. 1
Fig. 1. Myelination defects of FSI in γ2f/f mice.
a, b Representative 3D reconstructions of myelinated FSI from control (a) and γ2f/f (b) mice showing biocytin (red) and MBP (green) labeling. Note that the distance from the soma to the onset of MBP signal is longer in the γ2f/f mouse compared to the control (lines). The first branch point (open arrowhead) and an internode (solid arrowhead) are indicated. Scale bar: 40 µm. c, d Confocal images from reconstructed FSI in (a) and (b) showing internodes (solid arrowheads) and axonal branch points (open arrowheads). Note the longer MBP+ internode co-labeled with biocytin and the myelinated branch point in the γ2f/f mouse. Scale bar: 10 µm. We reconstructed a total of n = 8 cells from N = 5 control mice and n = 9 cells from N = 3 γ2f/f mice. e, f Dot plots of the distances from the soma to the first MBP signal (e) and from the soma to the first branch point (f) in control (dark red) and γ2f/f (light red) mice (n = 8 cells from N = 5 control mice and n = 8 cells from N = 3 γ2f/f mice; p = 0.0047 for (e) and p = 0.02 for (f), two-tailed Mann–Whitney U test). g Dot plots of the percentage of branch points with MBP per cell in control (dark red) and γ2f/f (light red) mice for the same cells (n = 7 cells from N = 5 control mice and n = 7 cells from N = 3 γ2f/f mice; p = 0.0095, two-tailed Mann–Whitney U test). h Dot plots of the mean internode length per cell for control (dark red) and γ2f/f (light red) mice (n = 8 cells from N = 5 control mice and n = 9 cells from N = 3 γ2f/f mice; p = 0.0003, two-tailed Mann–Whitney U test). Dot plots in (eh) are presented as mean±s.e.m and dots represent data from individual FSI. i Distribution of internode lengths for the same cells in control and γ2f/f mice. Fitted lines show Gaussian distributions in control (dark red) and γ2f/f mice (light red) (Gaussian fit peak value: 21.68 ± 10.5 µm and 39.09 ± 13.71 µm for control and γ2f/f mice, respectively). Note the shift towards longer values in γ2f/f mice (D = 0.4747; p < 0.0001, two-sided Kolmogorov–Smirnov test).
Fig. 2
Fig. 2. Node of Ranvier length of FSI axons is increased in γ2f/f mice.
a, b Representative confocal images of single nodes of Ranvier flanked by Caspr-expressing paranodes (gray) of FSI axons labeled with biocytin (red), MBP (green) in control (a) and γ2f/f (b) mice. Note that nodes of Ranvier are longer in γ2f/f mice compared to controls (lines). Data of nodes of Ranvier were obtained from reconstructed FSI in Fig. 1 (n = 8 cells from N = 5 control mice and n = 9 cells from N = 3 γ2f/f mice). Scale bar: 5 µm. c Intensity profiles of Caspr staining for the first nodes of Ranvier in control (a) and γ2f/f (b) mice. Node length was measured at the half maximum intensity of each paranode (black and gray arrows). d, e Dot plots of mean number of paranodes per µm (d) and mean node length per cell (e) of the same FSI axons of Fig. 1 for control (dark red) and γ2f/f (light red) mice (n = 8 cells from N = 5 control mice and n = 9 cells from N = 3 γ2f/f mice, p = 0.021 for (d); n = 7 cells from N = 5 control mice and n = 8 cells from N = 3 γ2f/f mice, p = 0.028 for (e); two-tailed Mann–Whitney U test). Dot plots in (d) and (e) are presented as mean±s.e.m and dots represent data from individual FSI. f Distribution of node lengths for the same cells in control and γ2f/f mice. Fitted lines show Gaussian distributions in control (dark red) and γ2f/f mice (light red) (Gaussian fit peak value: 1.58 ± 1 µm µm and 2.05 ± 0.87 µm for control and γ2f/f mice, respectively). Note the shift towards longer values in γ2f/f mice (D = 0.3778; p = 0.014, two-sided Kolmogorov–Smirnov test).
Fig. 3
Fig. 3. Recombinant layer IV differentiating OLs exhibited an aberrant morphological complexity in γ2f/f mice.
a, b Currents induced by voltage steps from +60 mV to −100 mV for biocytin-loaded recombinant cells held at −70 mV, positive for the OL maker CC1 and negative for the OPC marker NG2 from control (a) and γ2f/f (b) mice. Note the linear I-V curve of these cells in both groups. Scale bar: 10 µm. c, d Representative confocal images of recorded recombinant layer IV differentiating OLs loaded with biocytin (gray) from control (c) and γ2f/f (d) mice (n = 8 cells from N = 3 control mice and n = 7 cells from N = 3 γ2f/f mice). Note the lack of MBP co-staining in branches (insets). Scale bar: 40 and 10 µm. e Sholl analysis of the arborization of recorded recombinant layer IV differentiating OLs showing a decreased cell complexity between 10 and 60 µm from the soma (n = 8 cells from N = 3 control mice and n = 7 cells from N = 3 γ2f/f mice; p = 0.0038, p = 0.0298, p = 0.0204, p = 0.0038, and p = 0.0362 at 10 µm, 20 µm, 40 µm, 50 µm, and 60 µm, respectively; multiple two-tailed Mann–Whitney U test). f Dot plots of the number of branches from soma per differentiating OL in control (dark green) and γ2f/f (light green) mice (n = 8 cells from N = 3 control mice and n = 7 cells from N = 3 γ2f/f mice; p = 0.028, two-tailed Mann–Whitney U test). g, h Dot plots of mean (g) and sum (h) of crossings per differentiating OLs in control (dark green) and γ2f/f (light green) mice (n = 8 cells from N = 3 control mice and n = 7 cells from N = 3 γ2f/f mice; p = 0.0289 and p = 0.0022 for (e, f), two-tailed Mann–Whitney U test). i Dot plots of maximum distance reached by branches per differentiating OL in control (dark green) and γ2f/f (light green) mice (n = 8 cells from N = 3 control mice and n = 7 cells from N = 3 γ2f/f mice; p = 0.3248, two-tailed Mann–Whitney U test). Dot plots in (fi) are presented as mean±s.e.m and dots represent data from individual OLs.
Fig. 4
Fig. 4. FSI firing frequency and PV expression maturation in control and γ2f/f mice.
a, b Current clamp recordings of FSI (a) and SSCs (b) held at −70 mV during injections of 200 pA and −50 pA in control and γ2f/f mice. Note the decreased firing frequency of FSI but not of SSC in the mutant. c, d Dot plots of the frequency of action potential discharges of FSI (c) and SSC (d) in control (dark red and dark blue) and γ2f/f (light red and light blue) mice (n = 26 and n = 28 for FSI from N = 8 control mice and N = 7 γ2f/f mice, respectively; n = 18 for SSCs from N = 3 control mice and N = 3 γ2f/f mice; p = 0.0108 for (c), two-tailed Student’s t test; p = 0.3987 for (d), two-tailed Mann–Whitney test). e Representative confocal images of PV+ interneurons (red) in control and γ2f/f mice at P10 and P30. Scale bar: 40 µm. f Quantification of PV+ cell densities in control (dark red) and γ2f/f mice (light red) at P10, P24, P30, and P120. Note that the increase in PV expression observed from P10 to P30 in controls is delayed and detected at P120 in γ2f/f mice. Indeed, the number of PV+ interneurons is different between control and γ2f/f mice at P24 and P30 (P10: N = 3; P24: N = 5; P30: N = 5; P120: N = 4 for controls and P10: N = 4; P24: N = 5; P30: N = 4; P120: N = 4 for γ2f/f mice; p = 0,8421, p = 0.0230, and p = 0.0019 in control mice and p = 0.6270, p = 0.9934, p = 0.0068 in γ2f/f mice for comparison of P10 with P24, P30, and P120, respectively; p = 0,2163 and p = 0.0176 in control mice and p = 0.1982 and p < 0.0001 in γ2f/f mice for comparison of P24 with P30 and P120, respectively; p = 0,8781 in control mice and p = 0.0419 in γ2f/f mice for comparison of P30 with P120; p > 0.9999, p = 0.0091, p = 0.0252, p = 0.8902 for comparisons between control and γ2f/f mice at P10, P24, P30, and P120, respectively; two-way ANOVA test followed by a Tukey’s multiple comparison post hoc test). Dot plots in (cf) are presented as mean±s.e.m, dots in (c) and (d) represent data from individual FSI and SSCs, respectively, and dots in (f) represent data from individual mice.
Fig. 5
Fig. 5. Impaired IPSC latency and strength of layer IV SSCs in γ2f/f mice.
a, b Evoked EPSCs (bottom trace) and IPSCs (top trace) in layer IV SSCs held at −70 mV and −0 mV, respectively, in young (a) and mature (b) circuits upon thalamic stimulation in control (black) and γ2f/f (gray) mice. Note that the delay between IPSC and EPSC latencies decreases at P30 in control but not in the mutant (lines in insets). Stimulation artifacts blanked, stimulation time indicated (arrowheads). c, d Dot plots of EPSCs (c) and IPSCs (d) of layer IV SSCs evoked by thalamocortical stimulation at P9-P11 (referred as P10) and P21-P30 (referred as P30) in control (dark blue) and γ2f/f mice (light blue) (n = 9 and n = 14 at P10, n = 16 and n = 15 at P30 from N = 3 mice per condition; for EPSCs: p = 0.8443 for P10, p = 0.4428 for P30 between controls and γ2f/f mice; p = 0.3707 for controls, p = 0.6511 for γ2f/f mice between P10 and P30; for IPSCs: p = 0.8399 for P10, p = 0.0025 for P30 between controls and γ2f/f mice; p = 0.0025 for controls, p = 0.8715 for γ2f/f mice between P10 and P30; one-way ANOVA test followed by a Tukey’s multiple comparison test). e, f Dot plots of E/I ratio calculated from EPSCs and IPSCs obtained at P10 and P30 for SSCs in control (dark blue) and γ2f/f mice (light blue) (n = 9 and n = 14 at P10, n = 16 and n = 15 at P30 from N = 3 mice per condition; p = 0.1139 for (e), p = 0.001 for (f); two-tailed Mann–Whitney U test). g, h Dot plots of the delay between IPSCs and EPSCs latencies (LatIPSCs-LatEPSCs) at P10 (g) and P30 (h) in control (dark blue) and γ2f/f mice (light blue) (n = 8 and n = 10 at P10, n = 16 and n = 15 at P30 from N = 3 mice per condition; p = 0.7396 for (g), p = 0.0076 for (h); two-tailed Mann–Whitney U test). i, j Latencies of EPSCs (i) and IPSCs (j) at P30 for the same cells in (b) in control (dark blue) and γ2f/f mice (light blue) (n = 16 and n = 15 at P30 from N = 3 mice per condition; p = 0.8587 for (I), two-tailed Mann–Withney U test; p = 0.0153 for (j); two-tailed Student’t test). k Predicted conduction velocity of FSI in control (dark red) and γ2f/f mice (light red) (n = 8 cells from N = 5 control mice, n = 9 cells from N = 3 γ2f/f mice reconstructed in Fig. 1; p = 0.026; two-tailed Mann–Whitney U test). Dot plots in (ck) are presented as mean±s.e.m, dots from (cj) represent data from individual SSCs, dots in (k) represent data from individual FSI.
Fig. 6
Fig. 6. Impaired synaptic connectivity between FSI and SSC in layer IV of γ2f/f mice.
a, b Paired recordings between a presynaptic FSI (top trace) and a postsynaptic SSC (bottom trace) in layer IV of the barrel cortex in control (a) and γ2f/f mice (b). c Connection probabilities for paired recordings between FSI and SSCs in control (dark blue) and γ2f/f mice (light blue) (n = 25 pairs from N = 6 control mice and N = 22 pairs from N = 5 γ2f/f mice; P < 0,0001, two-sided Chi-squared test). Note the lack of connectivity between FSI and SSC in γ2f/f mice.
Fig. 7
Fig. 7. Impaired whisker-based texture discrimination in γ2f/f mice.
a Schematic of the whisker-dependent discrimination task. b, c Dot plots of the whisker-based texture exploration time during the learning (b) and testing (c) phases in control (black) and γ2f/f mice (gray) (N = 10 and N = 8 for control and γ2f/f mice, respectively; p = 0.696 for (b), two-tailed Mann–Whitney U test; p = 0.033 and p = 0.742 for (c) for control and γ2f/f mice, respectively; two-tailed paired Student’s t test and two-tailed Mann–Whitney U test, respectively). Note that control mice preferentially explore the novel object while mutants do not discriminate between the two objects. d Dot plots of the percentage of whisker-based exploration of a novel texture in control (black) and γ2f/f mice (gray) (N = 10 and N = 8 for control and γ2f/f mice, respectively; p = 0.0235, two-tailed paired Student’s t test). Dot plots are presented as mean±s.e.m and dots represent data from individual mice.

References

    1. Hübner NS, et al. The connectomics of brain demyelination: functional and structural patterns in the cuprizone mouse model. NeuroImage. 2017;146:1–18. doi: 10.1016/j.neuroimage.2016.11.008. - DOI - PubMed
    1. McKenzie IA, et al. Motor skill learning requires active central myelination. Science. 2014;346:318–322. doi: 10.1126/science.1254960. - DOI - PMC - PubMed
    1. Pajevic S, Basser PJ, Fields RD. Role of myelin plasticity in oscillations and synchrony of neuronal activity. Neuroscience. 2014;276:135–147. doi: 10.1016/j.neuroscience.2013.11.007. - DOI - PMC - PubMed
    1. Saab AS, Nave K-A. Myelin dynamics: protecting and shaping neuronal functions. Curr. Opin. Neurobiol. 2017;47:104–112. doi: 10.1016/j.conb.2017.09.013. - DOI - PubMed
    1. Stedehouder J, Kushner SA. Myelination of parvalbumin interneurons: a parsimonious locus of pathophysiological convergence in schizophrenia. Mol. Psychiatry. 2017;22:4–12. doi: 10.1038/mp.2016.147. - DOI - PMC - PubMed

Publication types

LinkOut - more resources