. 2021 Jan;40(1):28-45.
doi: 10.1038/s41388-020-01498-3. Epub 2020 Oct 13.

Anti-oncogene PTPN13 inactivation by hepatitis B virus X protein counteracts IGF2BP1 to promote hepatocellular carcinoma progression

Affiliations

Anti-oncogene PTPN13 inactivation by hepatitis B virus X protein counteracts IGF2BP1 to promote hepatocellular carcinoma progression

Yongcong Yan et al. Oncogene. 2021 Jan.

Abstract

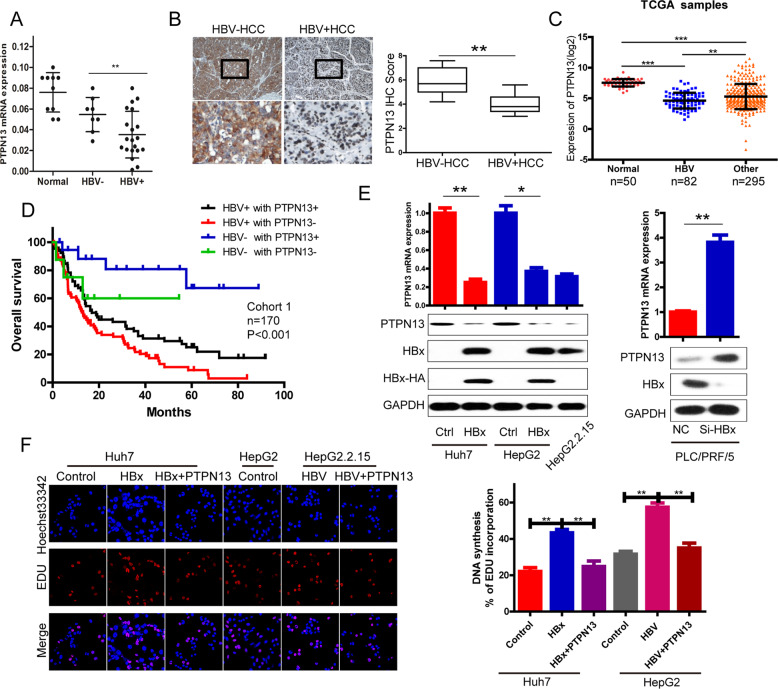
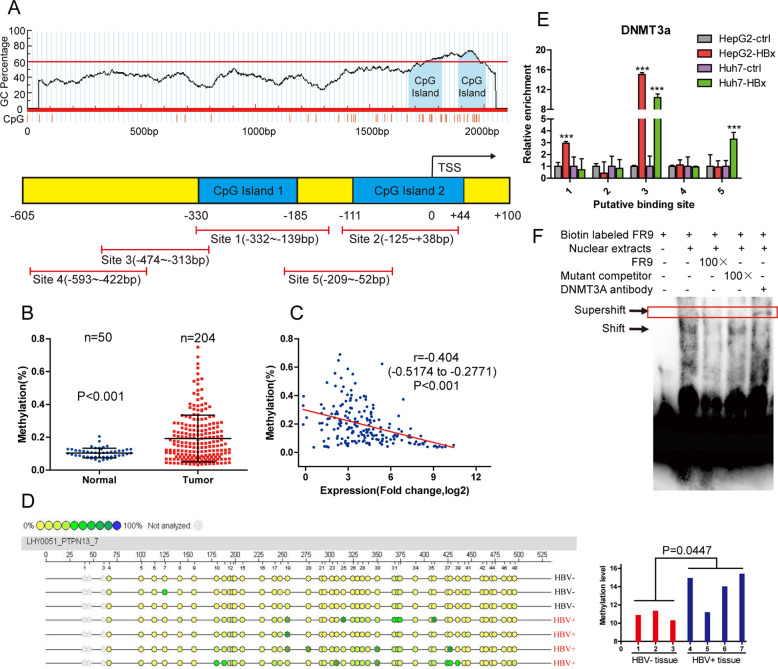
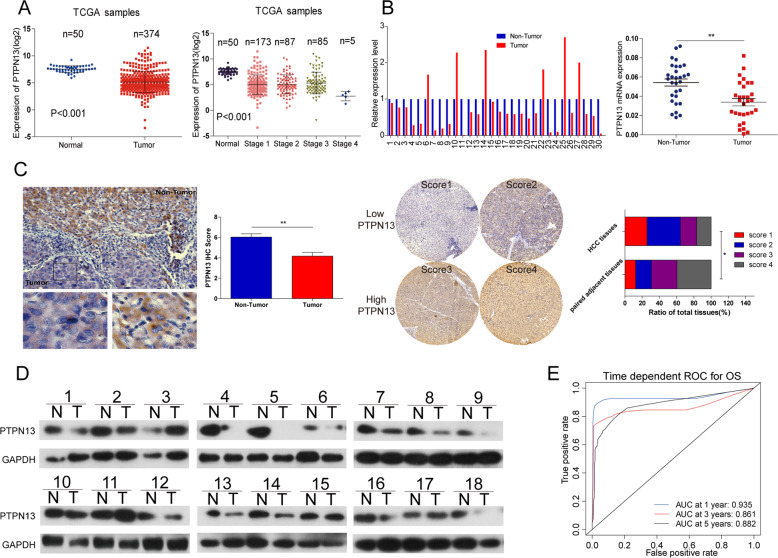
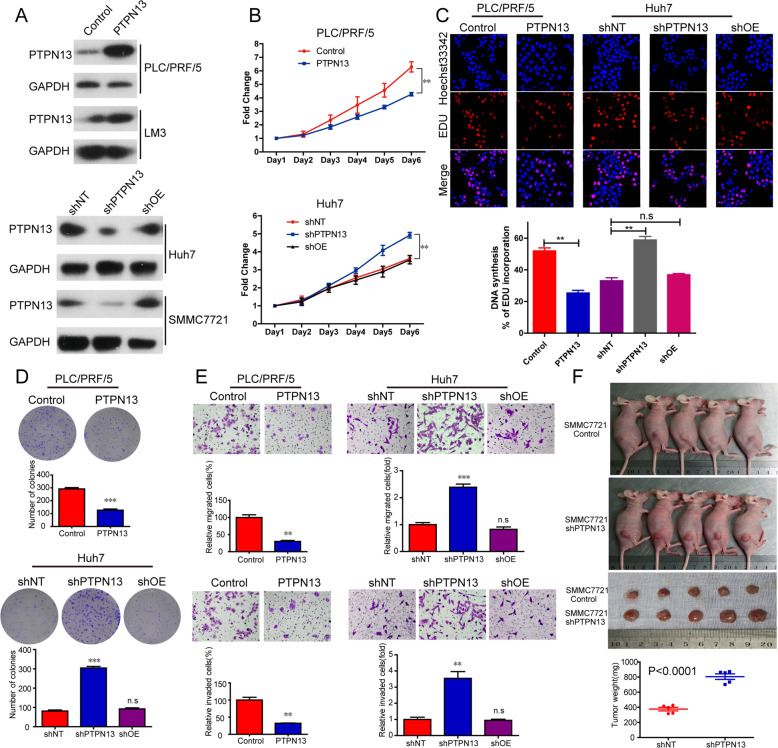
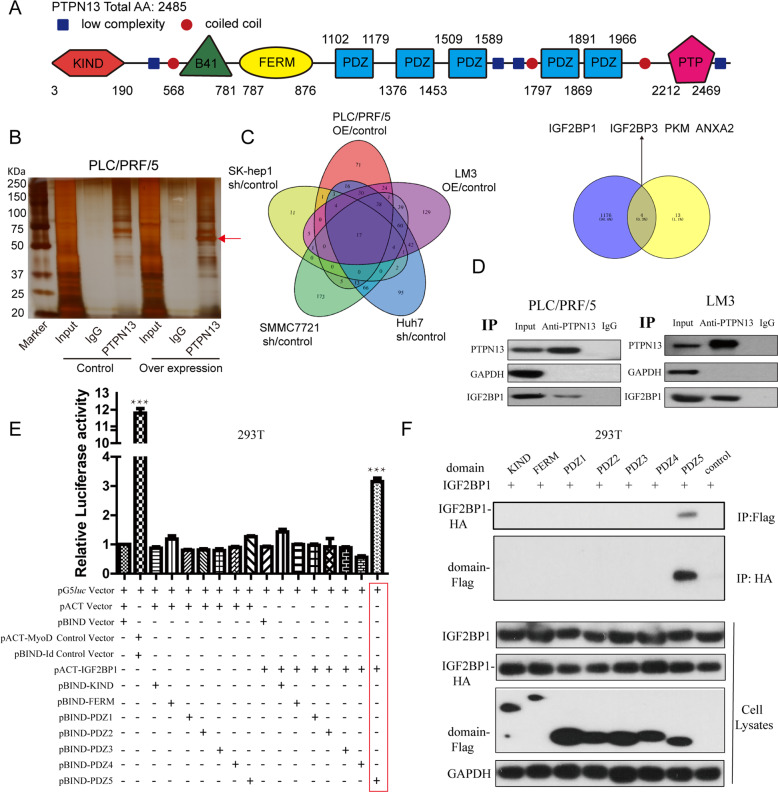
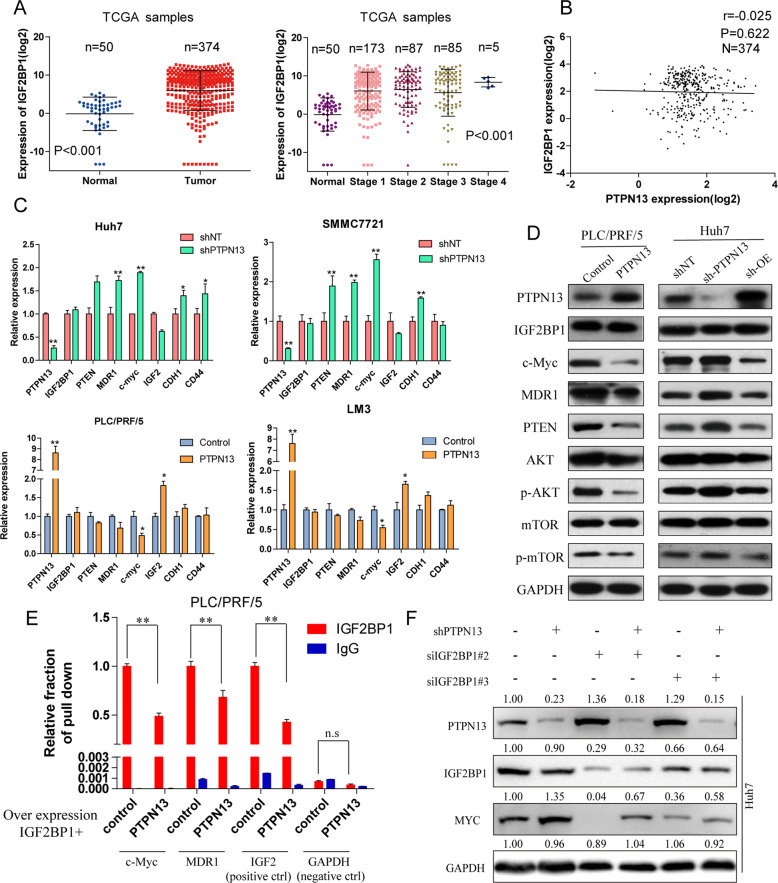
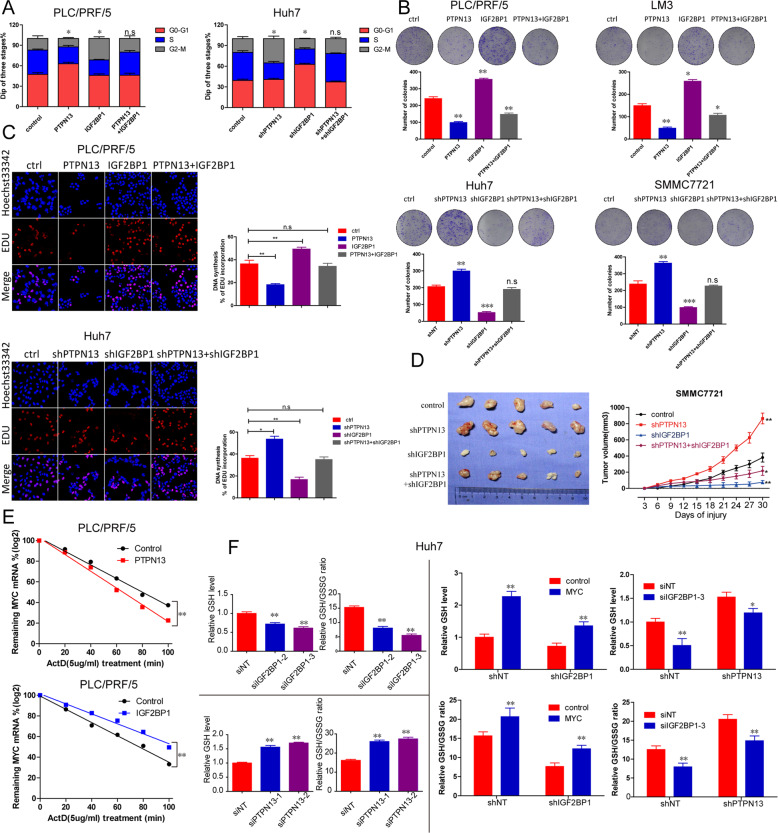
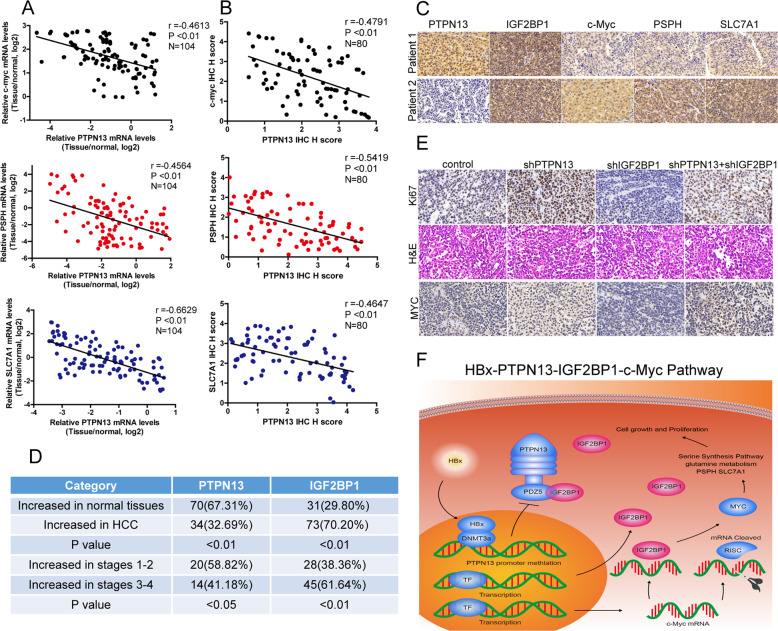
Hepatitis B x protein (HBx) affects cellular protein expression and participates in the tumorigenesis and progression of hepatitis B virus (HBV)-related hepatocellular carcinoma (HCC). Metabolic reprogramming contributed to the HCC development, but its role in HBV-related HCC remains largely unclear. Tyrosine-protein phosphatase nonreceptor type 13 (PTPN13) is a significant regulator in tumor development, however, its specific role in hepatocarcinogenesis remains to be explored. Here, we found that decreased PTPN13 expression was associated with HBV/HBx. Patients with low PTPN13 expression showed a poor prognosis. Functional assays revealed that PTPN13 inhibited proliferation and tumorigenesis in vitro and in vivo. Further mechanistic studies indicated that HBx inhibited PTPN13 expression by upregulating the expression of DNMT3A and interacting with DNMT3A. Furthermore, we found that DNMT3A bound to the PTPN13 promoter (-343 to -313 bp) in an epigenetically controlled manner associated with elevated DNA methylation and then inhibited PTPN13 transcription. In addition, we identified IGF2BP1 as a novel PTPN13-interacting gene and demonstrated that PTPN13 influences c-Myc expression by directly and competitively binding to IGF2BP1 to decrease the intracellular concentration of functional IGF2BP1. Overexpressing PTPN13 promoted c-Myc mRNA degradation independent of the protein tyrosine phosphatase (PTP) activity of PTPN13. Importantly, we discovered that the PTPN13-IGF2BP1-c-Myc axis was important for cancer cell growth through promoting metabolic reprogramming. We verified the significant negative correlations between PTPN13 expression and c-Myc, PSPH, and SLC7A1 expression in clinical HCC tissue samples. In summary, our findings demonstrate that PTPN13 is a novel regulator of HBV-related hepatocarcinogenesis and may play an important role in HCC. PTPN13 may serve as a prognostic marker and therapeutic target in HBV-related HCC patients.


Conflict of interest statement

The authors declare that they have no conflict of interest.

Figures

Fig. 1
Fig. 1. HBx promotes cell proliferation and downregulates PTPN13 expression.
A qRT-PCR analysis of PTPN13 mRNA levels in 10 normal liver tissue samples, 8 HBV-HCC tissue samples and 20 HBV + HCC tissue samples normalized to GAPDH expression. B Left: PTPN13 expression was determined by IHC staining. Representative images of a subset of the tumor specimens are shown. The lower panel shows magnified views (4×), shown in boxes in the upper panel. Right: IHC scores for PTPN13 in the two groups are summarized. C The expression levels of PTPN13 were analyzed according to patient HBV positivity. Data are shown after a log2 transformation. D Kaplan–Meier survival curve analysis in HCC patients stratified by the combination of the HBV status and PTPN13 expression is shown. E The effects of transient HBx overexpression in Huh7 and HepG2 cells, HepG2.2.15 cells (integration of the HBV genome) and HBx knockdown with siRNA in PLC/PRF/5 cells (derived from HBV-infected liver) on the mRNA and protein expression levels of PTPN13. F DNA synthesis in stable HBx-overexpressing cells with transient PTPN13 overexpression and stable HBV-overexpressing HepG2.2.15 cells with transient PTPN13 overexpression, as measured by an EdU assay. The data represent the mean ± standard deviation (SD) of three independent experiments (*P < 0.05, **P < 0.01, and ***P < 0.001 compared with the respective control).
Fig. 2
Fig. 2. HBx enhances PTPN13 promoter methylation to decrease PTPN13 expression.
A Upper: CpG sites and CpG islands were identified by promoter sequence analysis. Lower: Five pairs of ChIP-qPCR primers were designed around the two CpG islands. B The promoter methylation levels of PTPN13 in the TCGA cohort were analyzed. C Correlations between PTPN13 expression and promoter methylation levels in 204 HCC tissue samples in the TCGA cohort were determined and then analyzed by Pearson’s correlation analysis. D The PTPN13 promoter methylation levels in HBV-negative HCC tissue samples (n = 3) and HBV-positive HCC samples (n = 4) were measured by Sequenom MassARRAY quantitative methylation analysis. E ChIP assays were performed in HBx stable expression and control cell lines using antibodies against DNMT3A; immunoprecipitated DNA was analyzed by qRT-PCR using primers described in (A) for amplifying the DNMT3A-binding regions in the PTPN13 gene promoter. F Prepared nuclear extracts were incubated with a biotinylated oligonucleotide probe corresponding to the FR9 region in binding site 3 in the PTPN13 gene promoter to perform an EMSA. Different fold excesses of unlabeled oligonucleotide probes for binding site 3 were used to compete with the interaction between the labeled probe and DNMT3A. The data represent the mean ± SD of three independent experiments (***P < 0.001 compared with the respective control).
Fig. 3
Fig. 3. Downregulation of PTPN13 expression is inversely correlated with HCC malignancy.
A PTPN13 expression levels in 374 HCC tissues and 50 adjacent nontumor liver tissues in the TCGA cohort were analyzed by a t-test. Data are shown after a log2 transformation. B qRT-PCR was used to analyze PTPN13 mRNA levels in 30 paired samples of human HCC tissues and matched adjacent nontumor liver tissues. C Left: Representative images of IHC staining for PTPN13 in HCC tissue and normal liver tissue. Right: Scores indicate the PTPN13 protein levels in representative tumor tissue samples. Scores were calculated by measuring the staining intensity and percentage of stained cells. The PTPN13 protein levels in 170 paired samples were quantified according to the IHC scores. Data are shown as the percentage of total specimens. Values are expressed as the mean ± SD (*P < 0.05, **P < 0.01) for (AC). D PTPN13 protein levels were significantly lower in paired tumor tissue samples than adjacent noncancerous liver tissue samples based on western blotting. GAPDH served as a loading control (n = 18). E Time-dependent ROC curves showing the effect of the PTPN13 expression level on HCC patient OS; the area under the curves (AUCs) at 1, 3 and 5 years were calculated.
Fig. 4
Fig. 4. PTPN13 suppresses cell proliferation in vitro and tumor growth in vivo.
A The confirmation of PTPN13 overexpression (PTPN13), PTPN13 expression knockdown (shPTPN13), and PTPN13 re-expression (shOE) in the indicated HCC cell lines. BE The effects of transient PTPN13 overexpression, the control vector, PTPN13 knockdown with shRNA, control shRNA, and PTPN13 re-expression on in vitro proliferation, migration, and invasion, as measured by CCK-8 (B), EdU (C), colony formation (D) and transwell assays (E). Data represent the mean ± SD of three independent experiments. F The effects of PTPN13 knockdown on tumor growth in nude mice. Tumor images and weights are shown. Data represent the mean ± SD of five samples (**P < 0.01, ***P < 0.001; ns not significant).
Fig. 5
Fig. 5. PTPN13 interacts with IGF2BP1 through the fifth PDZ domain.
A Schematic diagram of the KIND, FERM, PTP, and five PDZ domains in the PTPN13 protein. B A CoIP assay was performed using an anti-PTPN13 antibody and IgG control antibody incubated with nuclear extracts of PLC/PRF/5 cells with a transient overexpression vector or a control vector, followed by silver staining. A red arrow indicates IGF2BP1. C Left: Interacting proteins based on mass spectrometry after silver staining in the CoIP experiments described in (B) in two pairs of transient overexpression cells (PLC/PRF/5-OE vs empty and LM3-OE vs empty) and three pairs of stable knockdown cells (Huh7-sh vs control, SK-hep1-sh vs control, and SMMC-7721-sh vs control). Right: A Venn diagram of protein spectra analysis results and overexpressed mRNAs in the TCGA cohort, which identified four key PTPN13-interacting genes. D Immunoblot analysis showed the specific association of IGF2BP1 with PTPN13. Twenty-four hours after transfection, whole-cell lysates were prepared and subjected to immunoprecipitation with an anti-PTPN13 antibody, followed by immunoblotting with an anti-IGF2BP1 antibody. GAPDH was used as a negative control for PTPN13-interacting proteins. E Mammalian two-hybrid assay. Plasmids encoding PTPN13 domains (pBIND-domain) and IGF2BP1 (pACT-IGF2BP1) and the pG5luc vector were cotransfected into HEK293T cells. The pBIND-domain plasmids were further used to examine which part of PTPN13 was involved in the physical interaction. pACT-MyoD and pBIND-Id were used as positive controls. Data were normalized to Renilla reniformis luciferase activity. F CoIP assay and immunoblot analysis of Flag-tagged PTPN13 (domain truncation fragments) immunoprecipitated by HA-tagged IGF2BP1. The data represent the mean ± SD of three independent experiments (***P < 0.001).
Fig. 6
Fig. 6. PTPN13 inhibits IGF2BP1 activity to protect target mRNA levels and especially attenuates c-Myc accumulation.
A The expression levels of IGF2BP1 in 374 HCC tissues and 50 adjacent nontumor liver tissues in the TCGA cohort were analyzed by a t-test. Data are shown after a log2 transformation. B The correlation between PTPN13 and IGF2BP1 expression in 374 HCC tissue samples. Correlations were then analyzed by Pearson’s correlation analysis. C The effects of transient PTPN13 overexpression and a control vector in PLC/PRF/5 and LM3 cells and PTPN13 knockdown with shRNA and a control shRNA in Huh7 and SMMC-7721 cells on the mRNA expression of IGF2BP1 downstream genes are shown. D Immunoblot analysis of genes downstream of IGF2BP1 and relevant pathways related to cancer proliferation and metastasis (c-Myc, MDR1, PTEN, p-AKT, and p-mTOR) in PLC/PRF/5 and LM3 cells with transient PTPN13 overexpression and a control vector and Huh7 and SMMC-7721 cells with knockdown and control shRNA. E A RIP assay was performed using anti-IGF2BP1 and control IgG antibodies after transient PTPN13 overexpression, followed by qRT-PCR to examine the enrichment of c-Myc, MDR1, IGF2, and GAPDH. IGF2 served as a positive control, while GAPDH served as a negative control. F Immunoblot analysis of c-Myc expression in HCC cells expressing PTPN13-specific shRNAs or control cells with or without the transient transfection of IGF2BP1-specific siRNAs. Data represent the mean ± SD of three independent experiments (*P < 0.05, **P < 0.01; ns not significant).
Fig. 7
Fig. 7. PTPN13 inhibits cell proliferation by inhibiting SSP activation mediated by the IGF2BP1-c-Myc axis.
A Proliferation profiles of PLC/PRF/5 PTPN13-overexpressing cells transiently transfected with pCDH-IGF2BP1 or the control and PTPN13 interference cells with stable IGF2BP1 knockdown by shRNA or the control were analyzed by cell cycle analysis. B Proliferation profiles of the indicated cells described in (A) were analyzed by colony formation analysis. C Proliferation profiles of the indicated cells described in (A) were analyzed by an EdU assay. D Proliferative capacity in vivo of PTPN13 interference cells with stable IGF2BP1 knockdown by shRNA or the control were analyzed by subcutaneous tumor formation in nude mice. E The remaining c-Myc mRNA expression was measured after treatment with actinomycin D (Act. D) and the knockdown or overexpression of PTPN13 or IGF2BP1 in PLC/PRF/5 cells. F The GSH level and GSH/GSSG ratio were determined in Huh7 cells expressing siRNAs targeting IGF2BP1 or PTPN13, stable IGF2BP1 knockdown cells with c-Myc overexpression, and stable PTPN13 knockdown cells with IGF2BP1 knockdown by shRNAs. The data represent the mean ± SD of three independent experiments (*P < 0.05, **P < 0.01, ***P < 0.001; ns not significant).
Fig. 8
Fig. 8. Downregulation of PTPN13 expression is correlated with a positive HBV status, increased c-Myc levels, and elevated glutamine metabolism-related enzyme expression in HCC tissue.
A Correlations between PTPN13 expression and c-Myc, PSPH, and SLC7A1 expression at the mRNA level in 104 HCC tissue samples were assessed and then analyzed by Pearson’s correlation analysis. B Correlations between PTPN13 expression and c-Myc, PSPH, and SLC7A1 expression at the protein level in 80 HCC tissue samples were assessed and then analyzed by Pearson’s correlation analysis. C Representative IHC images of PTPN13, IGF2BP1, c-Myc, PSPH, and SLC7A1 expression. D PTPN13 and IGF2BP1 protein levels were measured in a tissue microarray by IHC analysis and were analyzed according to tumor stage. E Representative IHC images of Ki-67 and c-Myc expression are shown for PTPN13 interference cells with stable IGF2BP1 knockdown by shRNA or control cells in subcutaneous tumors in nude mice. F A schematic model for the tumor suppressive function of PTPN13 in HCC is shown. PTPN13 expression was downregulated by high levels of HBx-induced promoter methylation, and PTPN13 decreased the stability of c-Myc mRNA by competitively binding to IGF2BP1, which inhibited c-Myc-associated oncogenic functions involved in HCC cell proliferation, especially the activation of the serine biosynthesis pathway and glutamine metabolism.

References

    1. Bray F, Ferlay J, Soerjomataram I, Siegel RL, Torre LA, Jemal A. Global cancer statistics 2018: GLOBOCAN estimates of incidence and mortality worldwide for 36 cancers in 185 countries. CA Cancer J Clin. 2018;68:394–424. doi: 10.3322/caac.21492. - DOI - PubMed
    1. Chen W, Zheng R, Baade PD, Zhang S, Zeng H, Bray F, et al. Cancer statistics in China, 2015. CA Cancer J Clin. 2016;66:115–32. - PubMed
    1. Villanueva A. Hepatocellular_inoma. N Engl J Med. 2019;380:1450–62. doi: 10.1056/NEJMra1713263. - DOI - PubMed
    1. Kulik L, El-Serag HB. Epidemiology and management of hepatocellular carcinoma. Gastroenterology. 2019;156:477–91. doi: 10.1053/j.gastro.2018.08.065. - DOI - PMC - PubMed
    1. Huang P, Zhuang B, Zhang H, Yan H, Xiao Z, Li W, et al. Hepatitis B virus X protein (HBx) is responsible for resistance to targeted therapies in hepatocellular carcinoma: ex vivo culture evidence. Clin Cancer Res. 2015;21:4420–30. doi: 10.1158/1078-0432.CCR-14-2067. - DOI - PubMed

Publication types

MeSH terms