

Syncytia formation by SARS-CoV-2-infected cells
- PMID: 33051876
- PMCID: PMC7646020
- DOI: 10.15252/embj.2020106267
Syncytia formation by SARS-CoV-2-infected cells
Erratum in
-
Syncytia formation by SARS-CoV-2-infected cells.EMBO J. 2021 Feb 1;40(3):e107405. doi: 10.15252/embj.2020107405. EMBO J. 2021. PMID: 33522642 Free PMC article.
Abstract
Severe cases of COVID-19 are associated with extensive lung damage and the presence of infected multinucleated syncytial pneumocytes. The viral and cellular mechanisms regulating the formation of these syncytia are not well understood. Here, we show that SARS-CoV-2-infected cells express the Spike protein (S) at their surface and fuse with ACE2-positive neighboring cells. Expression of S without any other viral proteins triggers syncytia formation. Interferon-induced transmembrane proteins (IFITMs), a family of restriction factors that block the entry of many viruses, inhibit S-mediated fusion, with IFITM1 being more active than IFITM2 and IFITM3. On the contrary, the TMPRSS2 serine protease, which is known to enhance infectivity of cell-free virions, processes both S and ACE2 and increases syncytia formation by accelerating the fusion process. TMPRSS2 thwarts the antiviral effect of IFITMs. Our results show that SARS-CoV-2 pathological effects are modulated by cellular proteins that either inhibit or facilitate syncytia formation.
Keywords: SARS-CoV-2; fusion; interferon; syncytia.
© 2020 The Authors.
Conflict of interest statement
The authors declare that they have no conflict of interest.
Figures
- A
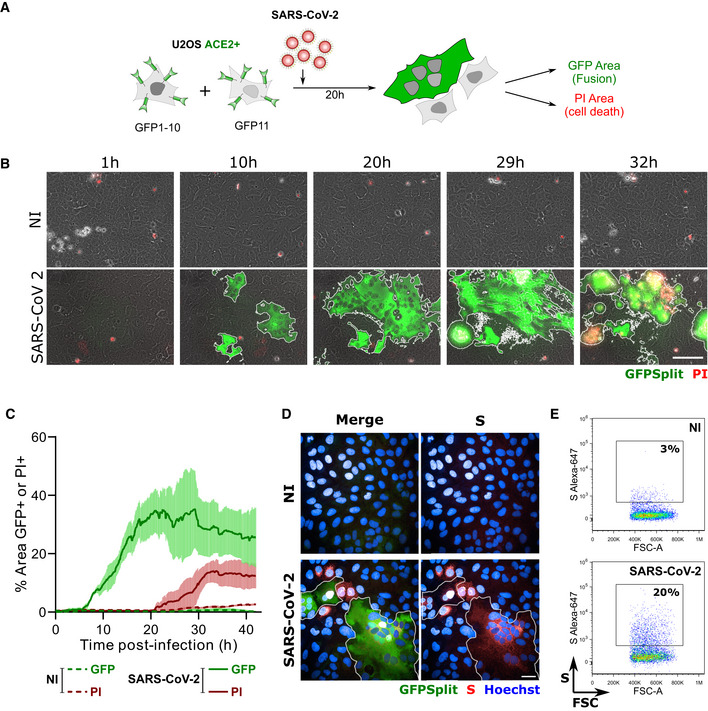
GFP‐Split U2OS‐ACE2 were co‐cultured at a 1:1 ratio and infected with SARS‐CoV‐2. Syncytia formation and cell death was monitored by video microscopy or at endpoint using confocal microscopy and high‐content imaging.
- B
Still images of GFP (syncytia) and propidium iodide (PI) (cell death) at different time points. Scale bar: 100 µm.
- C
Quantification of U2OS‐ACE2 fusion and death by time‐lapse microscopy. Results are mean ± SD from three fields per condition.
- D
S staining of infected U2OS‐ACE2 cells analyzed by immunofluorescence. The Hoechst dye stains the nuclei. Scale bar: 40 µm.
- E
Surface S staining of infected U2OS‐ACE2 cells analyzed by flow cytometry. Results are representative of at least three independent experiments.
- A
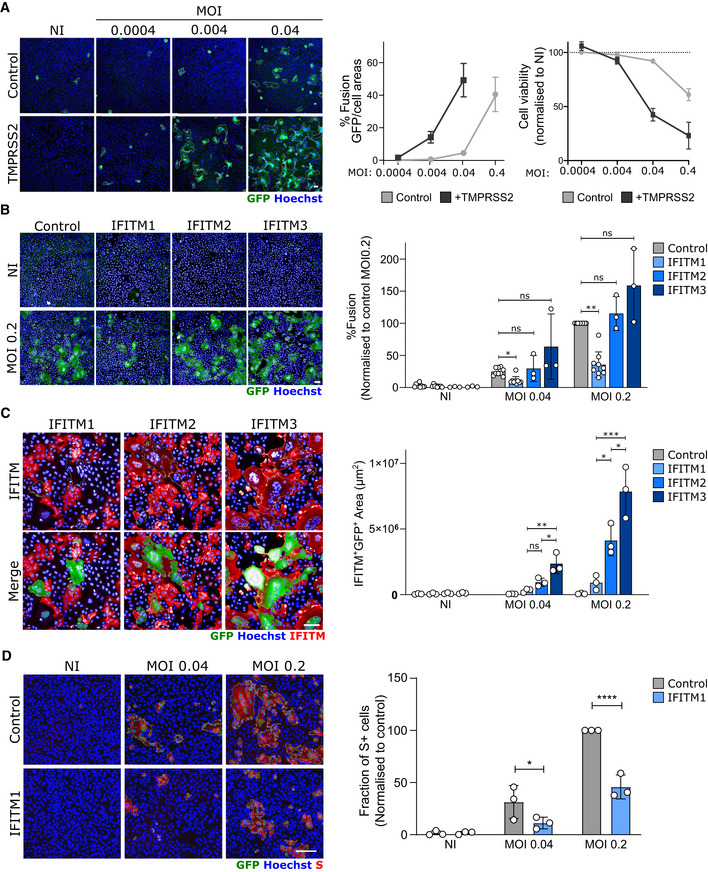
TMPRSS2 increases fusion and cell mortality. Right panel: Areas of GFP+ cells and nuclei count normalized to NI.
- B
IFITM1, but not IFITM2 and 3, inhibits SARS‐CoV‐2‐induced syncytia formation. Right panels: Area of GFP+ cells
- C
The fusion of IFITM1+ cells with U2OS‐ACE2 syncytia is drastically reduced. Right panel: Area of IFITM+ GFP+ cells
- D
IFITM1 decreases the number of infected cells. Right panel: Fraction of cells positive for S, normalized to control cells (transduced with pQCXIP‐empty vector).
- A
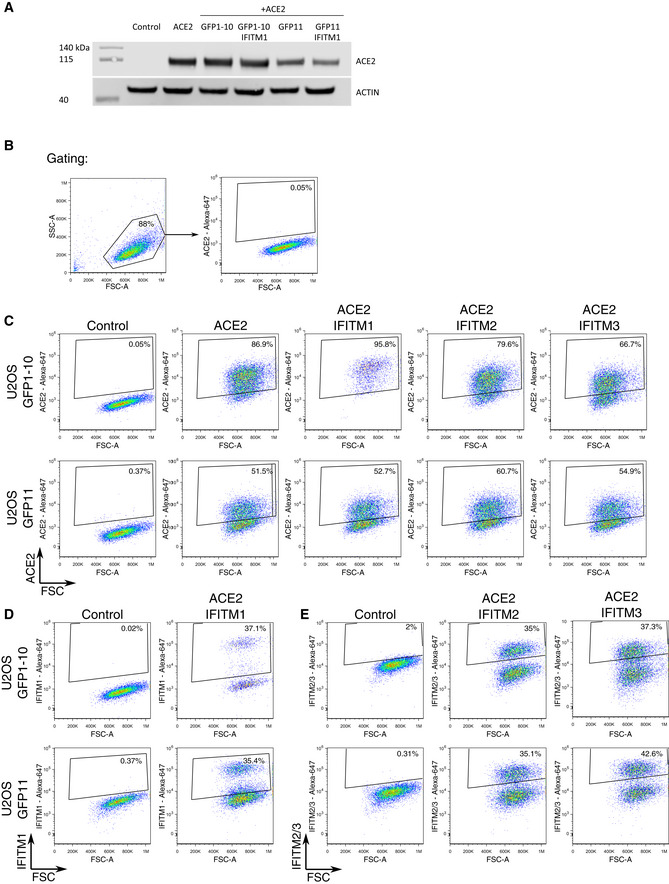
ACE2 expression assessed by Western blot in U2OS‐ACE2 GFP‐split cells expressing or not IFITM1. Cell lysates were analyzed by for ACE2 and actin as a loading control.
- B–E
Analysis of ACE2 and IFITMs levels by flow cytometry B. Gating strategy. Cells were gated by size and granularity. Positive and negative gates were then set on control U2OS cells lacking the protein of interest. C. ACE2 levels on parental U2OS (control) and various IFITM derivatives. D. IFITM1 levels on parental U2OS (control) and U2OS‐ACE2 IFITM1 cells. E. IFITM2 and IFITM3 levels on parental U2OS (control) and U2OS‐ACE2 IFITM2 and U2OS‐ACE2 IFITM3 cells.
- A
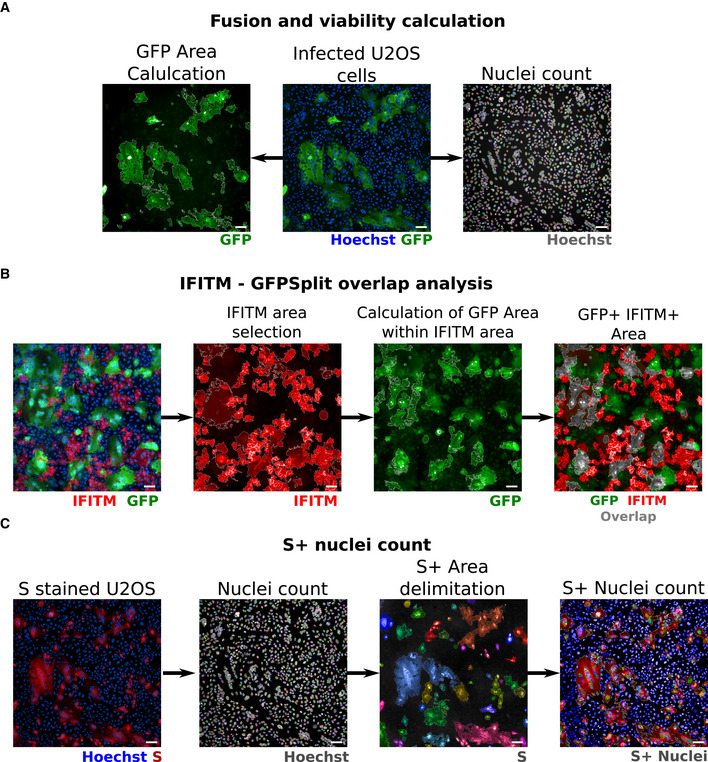
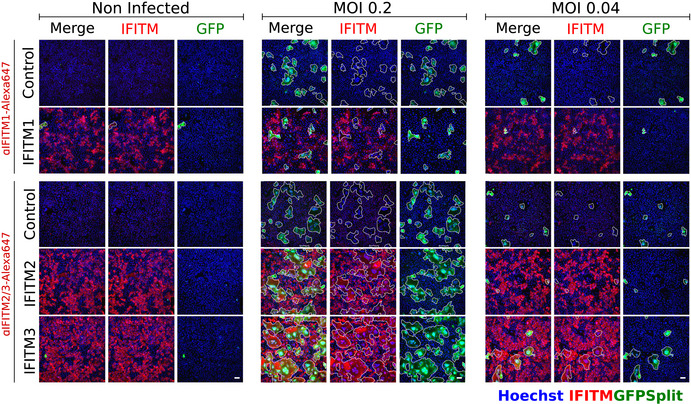
Quantification of fusion and viability. To measure the extent of cell–cell fusion, the GFP area was automatically delimited, measured, and then divided by the total cell area. For cell viability, nuclei were automatically counted, and the total number of nuclei per well was normalized to that of non‐infected control cells.
- B
Quantification of syncytia expressing IFITMs. For IFITM‐GFP overlap quantification, the IFITM+ area was first selected on the 647 nm channel (image 2) and the GFP‐positive area was quantified within the IFITM+ area (image 3). Image 4 shows the overlap area in gray for simpler visualization.
- C
Quantification of infected cells expressing the S protein. The cells were stained with anti‐S antibodies, and the nuclei were detected with Hoechst. The S+ area was delimited (each selected object is pseudo‐colored). Nuclei present within the S+ area were scored and divided by the total number of nuclei, to calculate the number of infected cells per well.
- A
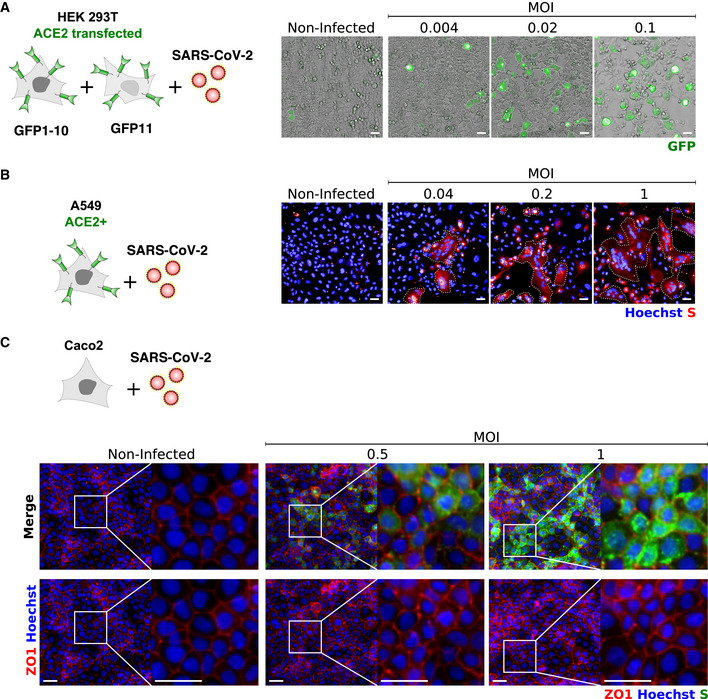
293T‐GFP1‐10 and ‐GFP11 (1:1 ratio) were transfected with ACE2 and infected with SARS‐CoV‐2 at the indicated MOIs. Cell fusion was visualized by the GFP+ area 18 h post‐infection. One representative image per condition is shown, and GFP area is delimited in white.
- B
A549‐ACE2 cells were infected with SARS‐CoV‐2 at the indicated MOIs for 24 h and stained with anti‐S antibodies and Hoechst. One representative image per condition is shown, and syncytia are manually delimited in white.
- C
Caco2 cells were infected with SARS‐CoV‐2 at the indicated MOIs for 24 h and stained for ZO1 tight junction marker, Hoechst and S. No clear syncytia formation was observed at any of the MOIs tested.
- A
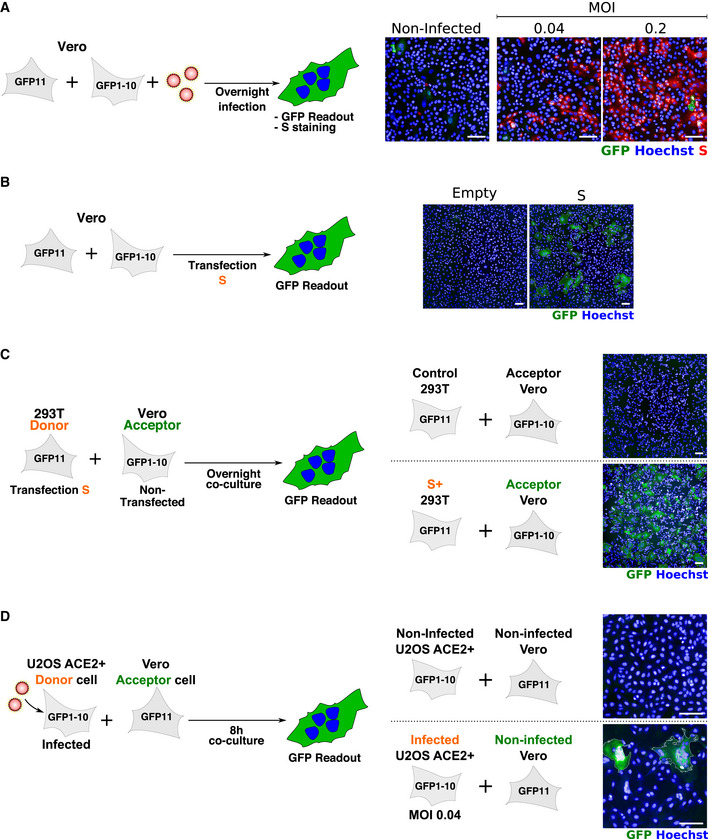
Vero‐GFP1‐10 and ‐GFP11 (1:1 ratio) were infected with SARS‐CoV‐2 for 24 h and stained with anti‐S antibodies and Hoechst. Cell fusion was visualized by the GFP+ area. No syncytia were observed in infected Vero cells.
- B
Vero‐GFP1‐10 and ‐GFP11 (1:1 ratio) were transfected with S expression plasmid and cell fusion was visualized by the GFP+ area at 18 h post‐transfection. S expression induced extensive syncytia formation.
- C
S‐expressing 293T GFP11 (Donor cells) were co‐cultured overnight with Vero GFP1‐10 (Acceptor cells). Cell fusion was quantified by measuring the GFP+ area. S‐expressing 293Ts readily fuse with Vero cells.
- D
SARS‐CoV‐2‐infected U2OS ACE2+ GFP1‐10 (Donor cells) were co‐cultured for 8 h with Vero GFP11 (Acceptor cells). Cell fusion was quantified by measuring the GFP+ area. Infected U2OS fuse with Vero cells.
- A
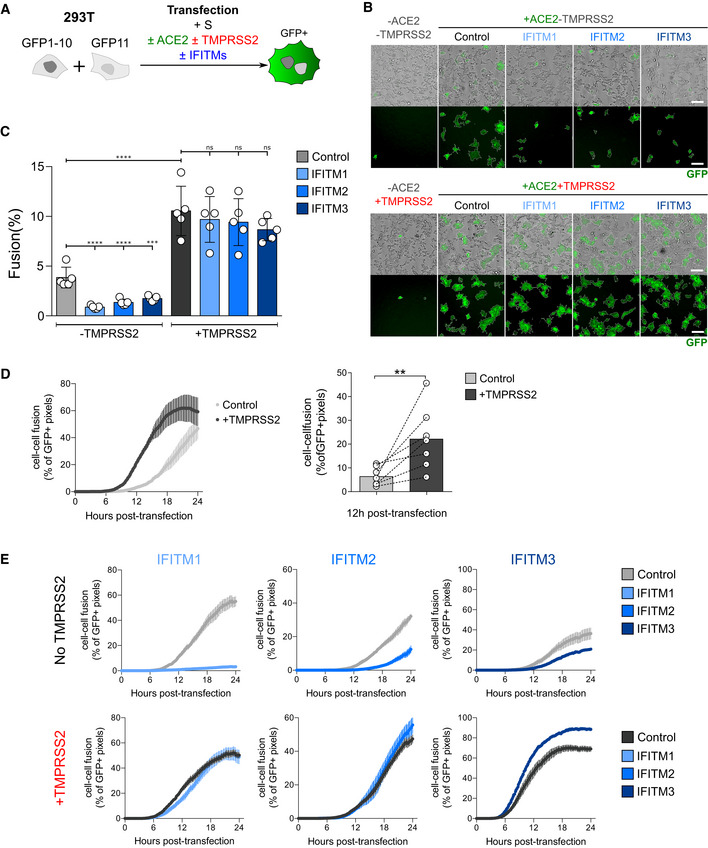
293T‐GFP1‐10 and ‐GFP11 cells (1:1 ratio) were co‐transfected with S, ACE2, TMPRSS2, IFITM, or control plasmids. Cell fusion was quantified by measuring the GFP+ area by high‐content imaging after 18 h. (B and C) or analyzed over time by video microscopy (D and E).
- B
Representative images of cell–cell fusion. Scale bar: 100 µm.
- C
Quantification of GFP+ areas. Results are mean ± SD from five independent experiments.
- D
TMPRSS2 accelerates fusion. Cells were monitored by video microscopy, and the GFP area was quantified over time. Left panel: one representative experiment. Results are mean ± SD from three fields per condition. Right panel: Mean ± SD from seven independent experiments (at 12 h post‐transfection).
- E
Impact of TMPRSS2 and IFITMs on the kinetics of fusion by S‐expressing 293T cells. One representative out of three independent experiment is shown.
- A
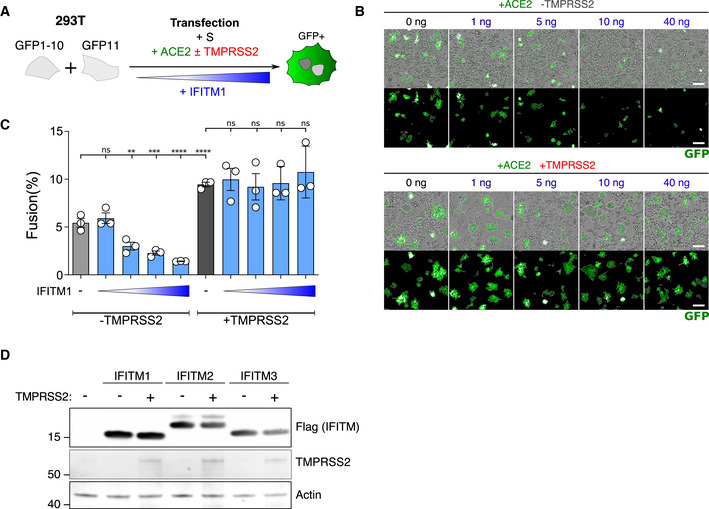
293T‐GFP1‐10 and ‐GFP11 (1:1 ratio) were co‐transfected with S, ACE2, TMPRSS2, and increasing amounts of IFITM1 plasmids. Cell fusion was quantified by measuring the GFP+ area by high‐content imaging at 18 h post‐transfection
- B
Representative images of cell–cell fusion, with the indicated amounts of transfected plasmids. Scale bar: 100 µm.
- C
Quantification of GFP+ area. Results are mean ± SD from three independent experiments. Statistical analysis: One‐way ANOVA, ns: non‐significant, **P < 0.01, ***P < 0.001, ****P < 0.0001.
- D
293T cells were co‐transfected with TMPRSS2 and IFITM1, IFITM2, IFITM3, or control plasmids, and analyzed 18 h post‐transfection by Western blot. TMPRSS2 does not cleave or reduce the levels of IFITMs.
- A
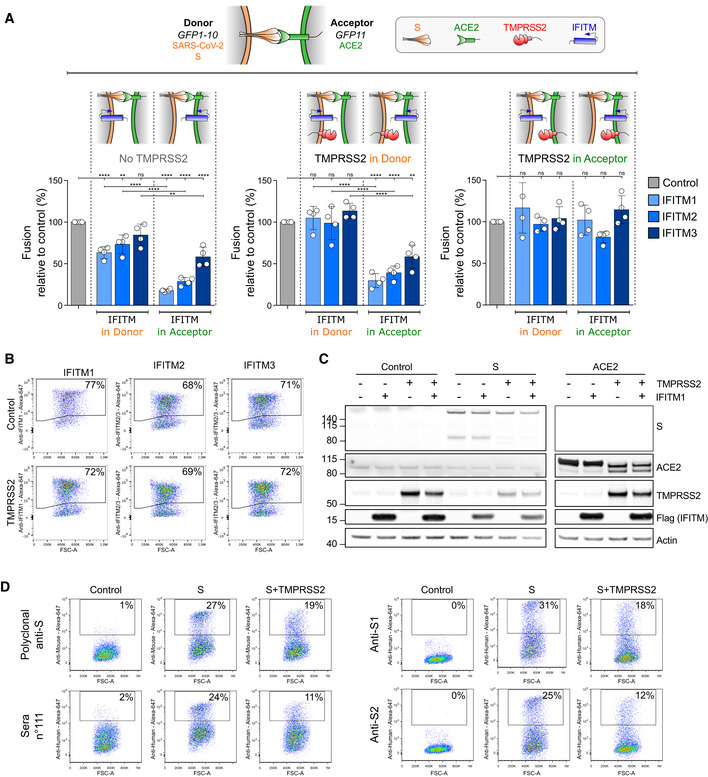
S‐expressing cells (Donor cells) and ACE2‐expressing cells (Acceptor cells) were co‐transfected with TMPRSS2, IFITM, or control plasmids. Cell fusion was quantified by measuring the GFP+ area after 18 h. The indicated combinations were tested. The impact of IFITMs was measured in absence of TMPRSS2 (left panel), in the presence of TMPRSS2 in donor (middle panel) or acceptor cells (right panel). Data are mean ± SD of four independent experiments. Statistical analysis: One‐way ANOVA, ns: non‐significant, **P < 0.01, ****P < 0.0001.
- B–D
Impact of TMPRSS2 on IFITMs, ACE2, and S levels. B. TMPRSS2 does not decrease IFITM amounts measured by flow cytometry. 293T cells were transfected with the indicated IFITM plasmids, with or without TMPRSS2, and analyzed 18 h later. C. Impact of TMPRSS2 on S and ACE2, measured by Western blot. 293T cells were transfected with or without IFITM1, TMPRSS2, S, or ACE2 plasmids, and analyzed 18 h later. D. TMPRSS2 decreases S surface levels, measured by flow cytometry. 293T cells were transfected with S plasmid, with or without TMPRSS2, and analyzed 18 h later. Murine polyclonal anti‐S antibodies, one serum from a convalescent COVID‐19‐infected patient (sera n°111), and two monoclonal antibodies (anti‐S1 and anti‐S2) were tested. Data are representative of three independent experiments.
References
-
- Abdel Motal UM, Zhou X, Joki A, Siddiqi AR, Srinivasa BR, Stenvall K, Dahmen J, Jondal M (1993) Major Histocompatibility Complex class I‐binding peptides are recycled to the cell surface after internalization. Eur J Immunol 23: 3224–3229 - PubMed
-
- Bertram S, Dijkman R, Habjan M, Heurich A, Gierer S, Glowacka I, Welsch K, Winkler M, Schneider H, Hofmann‐Winkler H et al (2013) TMPRSS2 activates the human coronavirus 229E for cathepsin‐independent host cell entry and is expressed in viral target cells in the respiratory epithelium. J Virol 87: 6150–6160 - PMC - PubMed
-
- Bozzo C, Nchioua R, Volcic M, Wettstein L, Weil T, Krüger J, Heller S, Conzelmann C, Müller J, Gross R et al (2020) IFITM proteins promote SARS‐CoV‐2 infection of human lung cells. bioRxiv 10.1101/2020.08.18.255935 [PREPRINT] - DOI
Publication types
MeSH terms
Substances
Grants and funding
- Institut Pasteur/International
- Agence Nationale de Recherches sur le Sida et les Hépatites Virales (ANRS)/International
- ANR-10-LABX-77/The Vaccine Research Institute/International
- ANR-10-LABX-62-IBEID/LABex IBEID/International
- ANR-14-CE14-0029/TIMTAMDEM/International
- ANR-14-CE14-0015-01/CHIKV-Viro-Immuno/International
- Gilead HIV cure Program/International
- ANR/FRM Flash COVID Proeto-SARS-COv-2/International
- IDISCOVR/International
- ANR-10-INSB-04-01/Agence Nationale de la Recherche (ANR)/International
- Region Ile-de-France program DIM1 Health/International
- ANR-10-LABX-69-01/Milieu Interier Program/International
- Reacting and EU recover grants/International
- Centre National de la Recherche Scientifique (CNRS)/International
- Sante Public France/International
- ANR-10-LABX-62-IBEID/Labex IBEID/International
- Universit&#x00E9; de paris/International
- Pasteur Paris Univeristy International Doctoral Program (PPU)/International
- Institut National de la Santé et de la Recherche Médicale (Inserm)/International
LinkOut - more resources
Full Text Sources
Other Literature Sources
Medical
Molecular Biology Databases
Miscellaneous
