. 2020 Oct;10(10):200200.
doi: 10.1098/rsob.200200. Epub 2020 Oct 14.

Release from cell cycle arrest with Cdk4/6 inhibitors generates highly synchronized cell cycle progression in human cell culture

Affiliations

Release from cell cycle arrest with Cdk4/6 inhibitors generates highly synchronized cell cycle progression in human cell culture

Eleanor Wendy Trotter et al. Open Biol. 2020 Oct.

Abstract

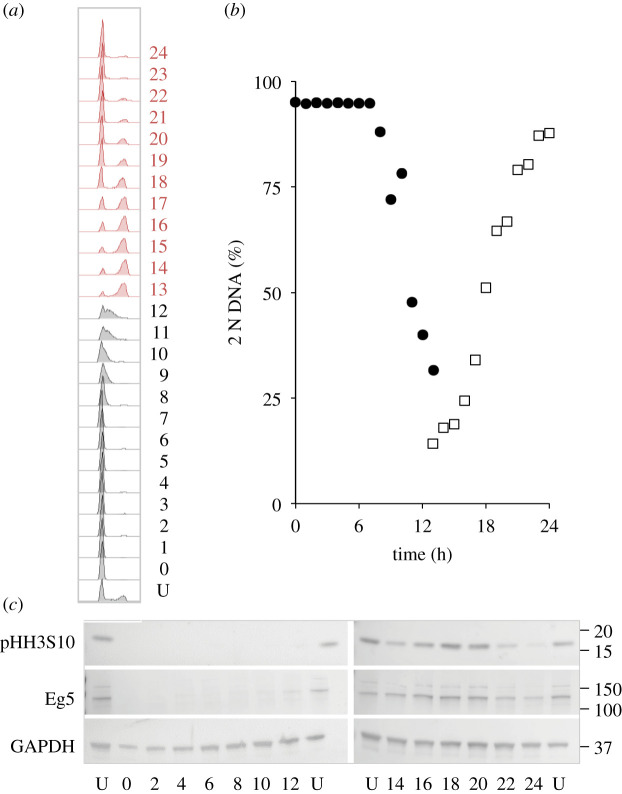
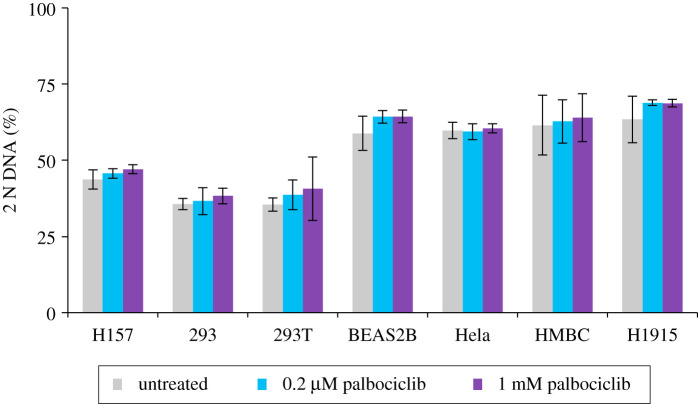
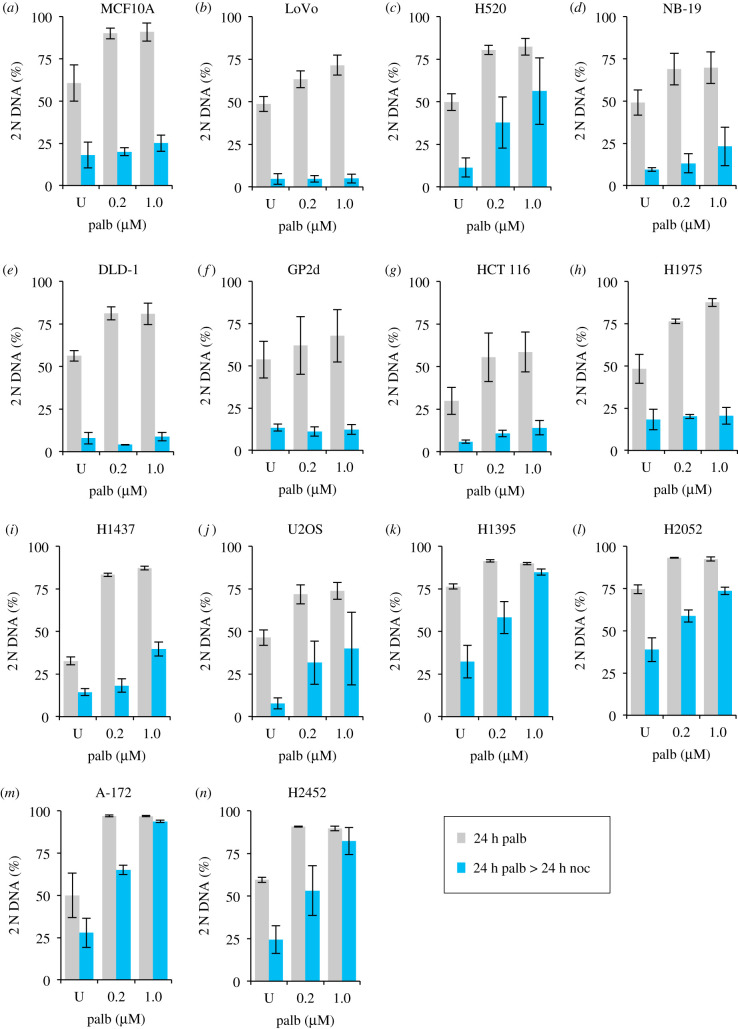
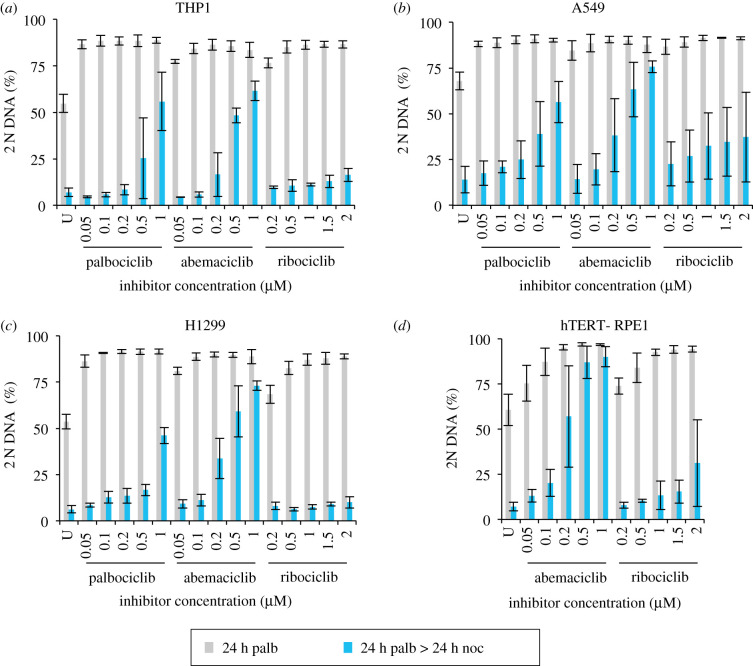
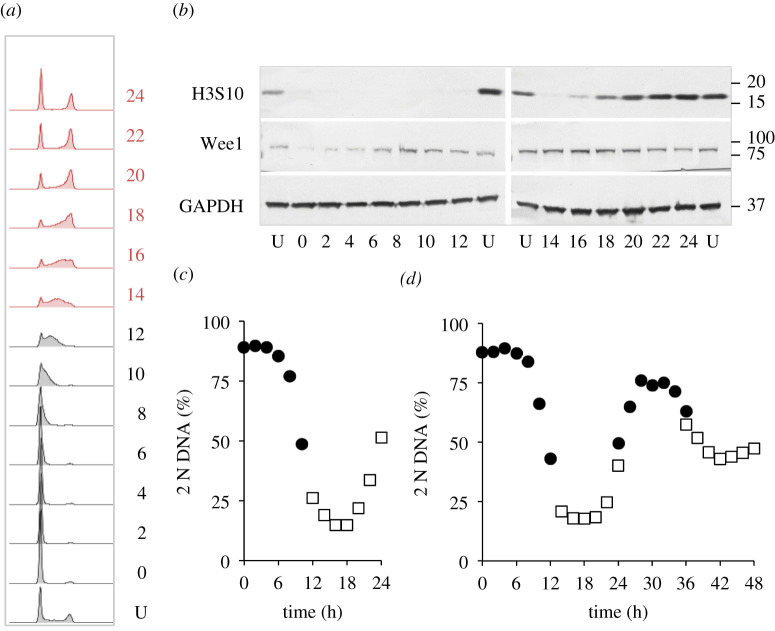
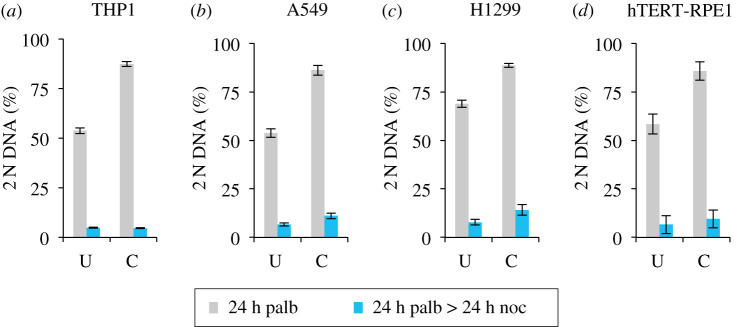
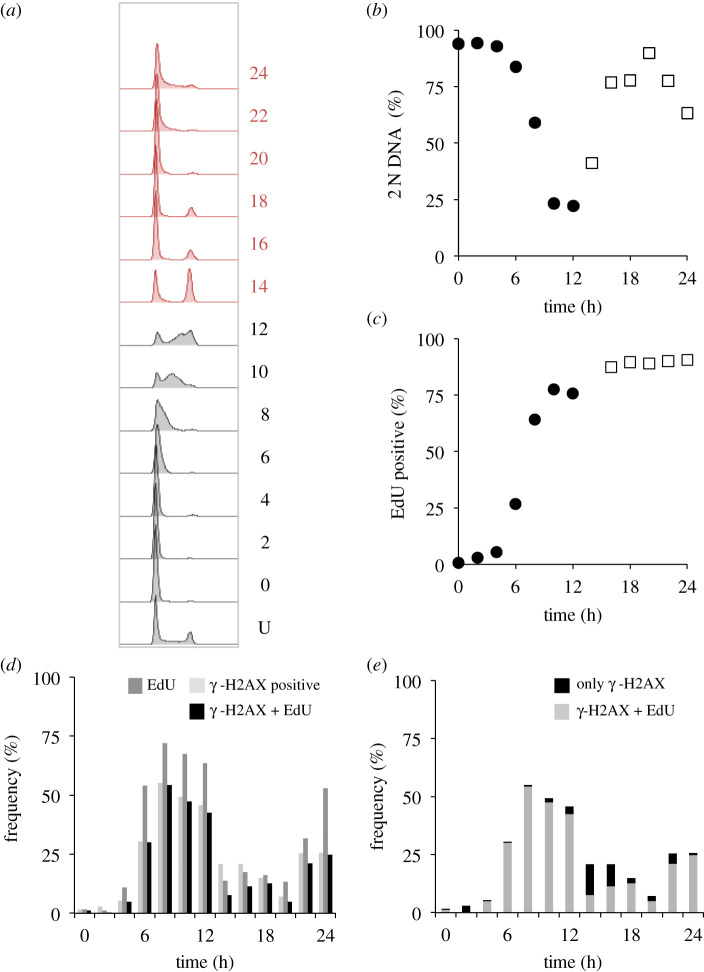
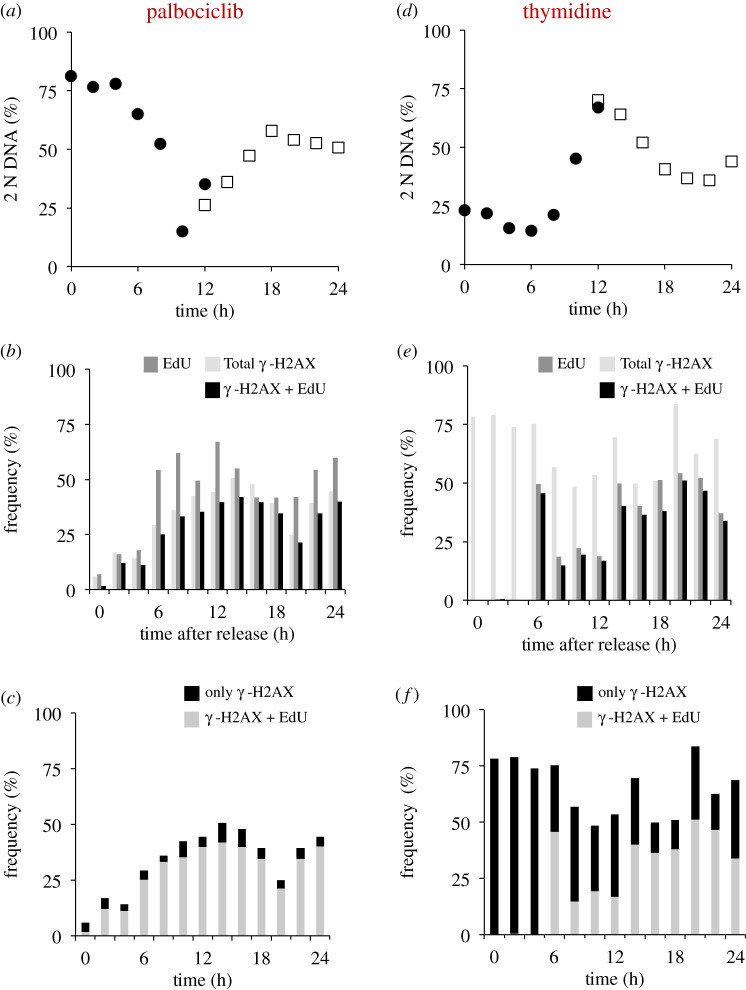
Each approach used to synchronize cell cycle progression of human cell lines presents a unique set of challenges. Induction synchrony with agents that transiently block progression through key cell cycle stages are popular, but change stoichiometries of cell cycle regulators, invoke compensatory changes in growth rate and, for DNA replication inhibitors, damage DNA. The production, replacement or manipulation of a target molecule must be exceptionally rapid if the interpretation of phenotypes in the cycle under study is to remain independent of impacts upon progression through the preceding cycle. We show how these challenges are avoided by exploiting the ability of the Cdk4/6 inhibitors, palbociclib, ribociclib and abemaciclib to arrest cell cycle progression at the natural control point for cell cycle commitment: the restriction point. After previous work found no change in the coupling of growth and division during recovery from CDK4/6 inhibition, we find high degrees of synchrony in cell cycle progression. Although we validate CDK4/6 induction synchronization with hTERT-RPE-1, A549, THP1 and H1299, it is effective in other lines and avoids the DNA damage that accompanies synchronization by thymidine block/release. Competence to return to cycle after 72 h arrest enables out of cycle target induction/manipulation, without impacting upon preceding cycles.

Keywords: CDK4; cell cycle; cell cycle synchronization; palbociclib; restriction point; thymidine block.


Conflict of interest statement

We have no competing interests to declare.

Figures

Figure 1.
Figure 1.
Palbociclib induction synchrony of hTERT-RPE1 cells. (a) hTERT-RPE1 cells were grown to 1.5 × 10⁴ cells cm2 in DMEM (+10% serum), trypsinized and plated into 10 cm dishes at 4.4 × 103 cm−2. Six hours later, 150 nM palbociclib was added to the culture. After 24 h, cells were washed twice with pre-warmed medium before the addition of pre-warmed medium that contained 330 nM nocodazole before incubation for a further 24 h. Samples (one 10 cm dish per data point) were stained for propidium iodide FACS analysis at the following time points: just before palbociclib addition (U, untreated), at the switch from palcociclib to nocodazole medium (P) and 24 h after this switch to nocodazole (P + N). The strength of the nocodazole-induced spindle checkpoint arrest was revealed by the addition of nocodazole to an asynchronous population (U + N) for 24 h. The bimodal peak in the upper panel (U) shows 2 N (G1, left) DNA and 4 N (G2/M, right) DNA content of an asynchronous, untreated population. This experiment was repeated six times. (b) Cell populations were treated in the same way as (a) with the palbociclib concentration changed to the indicated value and one sample being left untreated. The average frequency of 2 N cells from at least three biological repeats is plotted for the palbociclib (grey bars) and nocodazole (blue bars) arrest points. Error bars show the limits of 1 s.d.. (c,d) hTERT-RPE1 cells were grown to around 1.5 × 10⁴ cells cm−2 in DMEM (+10% serum), trypsinized and plated into 10 cm dishes at 4.4 × 103 cm−2. Twelve hours later, 150 nM palbociclib was added to the culture, before three washes in pre-warmed DMEM and sampling one dish every hour to generate the propidium iodide FACS profiles in (c) from which the plots of 2 N content shown in (d) were derived. The numbers next to the plots in c indicate time (hours) since release with U indicating an untreated control population. The 13–25 h plots (red (c): open squares (d)) were taken simultaneously alongside the 0–12 h population (grey (c): filled circles (d)). The synchronization shown in (c,d) has been performed six times and always reveals comparable results; however, variations in the precise synchronization profiles in each experiment (as can be seen in subsequent figures in the manuscript) mean that it is not appropriate to merge them into a single dataset.
Figure 2.
Figure 2.
Context and perdurance for palbociclib induction synchronization. For (a), hTERT-RPE1 cells were grown to around 1.5 × 10⁴ cells cm−2 in DMEM (+10% serum), trypsinized and plated in 10 cm dishes at 4.4 × 103 cm−2. Twelve hours later, 150 nM palbociclib was added. Twenty-four hours after palbociclib addition, cells were washed twice with medium that did not contain any palbociclib before incubation in pre-warmed DMEM (+10% serum) with sampling one dish every 2 h for propidium iodide FACS staining to generate the profiles in 12 h batches covering a 48 h release period of the same population of cells. Samples for the 0–12 (filled circles), 14–24 (open squares), 26–36 (filled circles) and 36–48 (open squares) were taken in parallel from subpopulations to which the palbociclib had been added at staggered intervals. This experiment was performed twice, with similar results in each iteration. (be) Plots derived from the same population of cells. For (b), hTERT-RPE1 cells were grown to 1.5 × 10⁴ cells cm−2 in DMEM (+10% serum), trypsinized and plated in 10 cm dishes at 4.4 × 103 cm−2. Twelve hours later, 150 nM palbociclib was added. Twenty-four hours after drug addition, the cells were washed twice with medium before incubation in pre-warmed DMEM (+10% serum) that lacked palbociclib and two batches of the same population of hTERT-RPE1 cells were followed, sampling one 10 cm dish for each data point. In one batch (open symbols), 150 nM palbociclib was re-added to the population 12 h after the initial release from palbociclib, while the other was left to transit the restriction point into the second cycle (red). For (c), the density at which cells from the same population used for the initial plating in (b and d) were plated at a fourfold higher density of 1.76 × 10⁴ cells cm−2 in 10 cm dishes. (d) The expansion of the same starting population used in (b) and (c) lacked one cycle of splitting so that the starting population that was synchronized in (d) had been grown to confluence (early contact inhibition) before plating 12 h before palbociclib addition. (e) Cells from the same vials used to seed the populations used in bd were grown in RPMI for two passages, alongside the cells used in bd, before the entire synchronization outlined in figure 1c was conducted in RPMI. For (be), samples were simultaneously taken from two batches of the same population: palbociclib was added to one at the start of a 12 h sampling period (circles), while it had been added to the other 12 h earlier (squares). For the FACS plots from which these 2 N DNA contents were derived, see electronic supplementary material, figures S1 and S2.
Figure 3.
Figure 3.
Cdk4/6 induction synchrony can reveal transient cell cycle events. hTERT-RPE1 cells were grown to around 1.5 × 10⁴ cells cm−2 in DMEM (+10% serum), trypsinized and plated at 4.4 × 103 cm−2 in 10 cm dishes. Twelve hours later, 150 nM palbociclib was added. Twenty-four hours after palbociclib addition, the cells were washed twice in growth medium before the medium was replaced with pre-warmed DMEM (+10% serum) that did not contain any palbociclib. One 10 cm dish was taken for each sample every hour to generate the propidium iodide FACS profiles in 13 h batches (a) to gauge the fluctuations in 2 N DNA content in the population (b), while sampling to monitor the indicated markers by western blot every 2 h (c). The numbers next to the plots in (a) indicate hours since release with U indicating an untreated control population. Both the mitotic kinesin 5 motor protein Eg5 and phosphorylation of the serine of histone H3 at position 10 peak as cells return from the 4 N state to the 2 N state (mitosis and cell division). This plot shows one of the three repeat experiments, which revealed similar fluctuations in the same cell cycle markers.
Figure 4.
Figure 4.
Palbociclib induction synchronization screening: refractory cell lines. The indicated cell lines were grown to around 1.5 × 10⁴ cells cm−2 in in the media specified in the methods, trypsinized and plated into 10 cm dishes at 4.4 × 103 cm−2. Six hours later, the cells were treated with the indicated concentration of palbociclib or left untreated. Twenty-four hours after this, samples were stained for propidium iodide FACS analysis to gauge the proportion of the population that had a 2 N DNA content. One 10 cm dish was used for each dataset. Each plot represents the average of a minimum of four datasets (at least two biological repeats, each of which had at least two technical repeats). The error bars represent 1 × s.d.
Figure 5.
Figure 5.
Palbociclib induction synchronization screening: responsive cell lines. Each line was grown in the media specified in the methods to around 1.5 × 10⁴ cells cm−2 trypsinized, and plated at 4.4 × 103cm−2 in 10 cm dishes. Six hours later, 0.2 or 1 µM palbociclib was added to one-third of the dishes for each cell population. A control sample was left untreated. Twenty-four hours after this, cells were either fixed for staining (grey bars) or washed with fresh medium twice before incubation in 330 nM nocodazole for 24 h after which these samples were fixed and processed for propidium iodide FACs analysis alongside the samples that had been fixed 24 h earlier (blue bars). The proportion of the population that had a 2 N DNA content was calculated from the FACs profiles and plotted in the panels. The samples from the first 24 h incubation are shown in grey, while the subsequent nocodazole-treated samples are shown in blue. Each plot represents the average of at least four datasets (at least two biological repeats, each of which had at least two technical repeats). The error bars represent 1 × s.d. These experimental tests were purely exploratory in nature with the goal of finding lines for more detailed analysis in the rest of the study. Thus, these data should not be used to rule out the amenability of Cdk4/6i synchronization in the cell lines that show a partial response. We have not tested different inhibitors, media, longer incubations (in case, the cell cycles of certain lines emulate that of THP-1 of exceeding 24 h), or whether the addition of an MAP kinase inhibitor, or Cdk6 PROTAC may sharpen the responses. See Discussion for more details.
Figure 6.
Figure 6.
Spectrum of responses of four different lines to three Cdk4/6 inhibitors. THP1 and H1299 were grown in RPMI (+10% serum) and hTERT-RPE1 and A549 were grown in DMEM (+10% serum). Each adherent line was grown to around 1.5 × 10⁴ cells cm−2 before they were trypsinized and plated at 4.4 × 103 cm−2 in 10 cm dishes. The suspension THP1 cells were grown to around 4 × 10⁵ ml−1, centrifuged at 300g for 3 min before plating at 1 × 10⁵ ml−1 in 10 cm dishes. One 10 cm dish was plated for each condition. Six hours later, the indicated concentration of the indicated Cdk4/6 inhibitor was added to each population. Twenty-four hours after this, samples (an entire 10 cm dish) were either fixed or washed with fresh medium twice before incubation in media containing 330 nM nocodazole for 24 h after which these samples were fixed and processed for propidium iodide FACs analysis alongside the samples that had been fixed 24 h earlier (blue bars). The proportion of the population that had a 2 N DNA content was calculated from the FACs profiles and plotted in the panels. The samples from the first 24 h incubation are shown in grey while the subsequent nocodazole arrest profiles in blue. Each plot represents the average of at least three biological repeats. The error bars represent 1 × s.d.
Figure 7.
Figure 7.
Utility of THP1 suspension cell line for cell cycle analysis. THP1 cells were grown to around 4 × 10⁵ cells ml−1 in RPMI (+10% serum), isolated by mild centrifugation at 300g for 3 min, before resuspension in RPMI at a concentration of 1 × 10⁵ cells ml−1 in 10 cm dishes. Twelve hours later, 150 nM palbociclib was added for 24 h before cells were isolated by centrifugation at 300g for 3 min and once more resuspended in RPMI. Samples (one 10 cm dish per sample) were taken every 2 h to generate the propidium iodide FACS profiles in 12 h batches (a) to gauge the fluctuations in 2 N DNA content in the population (c), while sampling to monitor the indicated markers by western blot every 2 h (b). The numbers next to the plots in (a) indicate hours since release with U indicating an untreated control population. This analysis of cell cycle samples by western blotting shown in ac was done three times. (d) Cells grown as in (a) with the exception that sampling of 12 h batches was extended over a 48 h release period of the same population of cells. For this batch of cells, samples were only processed for PI FACs analysis of DNA content to generate the plot of the frequency of 2 N cells show in the panel. Samples for the 0–12 (filled circles), 14–24 (open squares), 24–36 (filled circles) and 36–48 (open squares) were taken in parallel from subpopulations to which the palbociclib had been added at staggered intervals. The propidium iodide FACs plots from which the data in (d) are derived are in electronic supplementary material, figure S3. This analysis of a 48 h progression of THP1 was done once. Note that the time taken for THP1 cells to transit the first cell cycle, under these conditions, is 32 h.
Figure 8.
Figure 8.
Cocktails support efficient arrest and release in four responsive lines. THP1 and H1299 were grown in RPMI (+10% serum). hTERT-RPE1 and A549 were grown in in DMEM (+10% serum). Adherent cell lines were grown to around 1.5 × 10⁴ cells cm−2 before they were trypsinized and plated at 4.4 × 103 cm−2 in 10 cm dishes. The suspension line THP1 was grown to around 4 × 10⁵ ml−1 and centrifuged at 300g for 3 min before plating at 1 × 10⁵ ml−1 in 10 cm dishes. Four 10 cm dishes were seeded for each cell line. Six hours later, two dishes for each line were left as the untreated control, while the indicated cocktail comprising 33 nM abemaciclib + 33 nM palbociclib + 300 nM ribociclib for THP1 and H1299, 33 nM abemaciclib + 33 nM palbociclib + 67 nM ribociclib for A549 and 33 nM abemaciclib + 33 nM palbociclib + 167 nM ribociclib for hTERT-RPE1 was added to the other. Twenty-four h later, one dish for each condition was fixed for staining, while the medium in the remaining dish was replaced with medium containing 330 nM nocodazole. Media exchange for A549, H1299 and hTERT-RPE1 was achieved by aspiration while the media switch for the THP1 was achieved by mild centrifugation at 300g for 3 min followed by resuspension in the nocodazole-containing medium. Twenty-four hours later, these three nocodazole samples were fixed and processed for propidium iodide FACs analysis alongside the samples that had been fixed 24 h earlier. The proportion of the population that had a 2 N DNA content was calculated from the propidium iodide FACs profiles and plotted in the panels. The inhibitor cocktail arrested samples from the first 24 h incubation are shown in grey while the subsequent nocodazole arrest profiles in blue. Samples treated with the inhibitor cocktail are indicated by C, while the untreated population by U. Each plot represents the average of at least three biological repeats. The error bars represent 1 × s.d.
Figure 9.
Figure 9.
γ-H2AX foci associated with DNA replication in hTERT-RPE1 cells. hTERT-RPE1 cells were grown to around 1.5 × 10⁴ cells cm−2 in DMEM (+10% serum), trypsinized and plated at 4.4 × 103 cm−2 in 10 cm dishes. Three 10 cm dishes were plated for each timepoint, one for propidium iodide staining (a,b), one for cumulatative EdU incorporation and one with coverslips for immunofluorescence. Twelve hours later, 150 nM palbociclib was added. Twenty-four hours later, cells were washed twice before incubation in pre-warmed medium that did not contain any palbociclib. At this point, one-third of dishes were left without EdU addition, 1 µM EdU was added to one-third of dishes at the time of release from palbociclib arrest, to monitor the cumulative accumulation of this marker of DNA replication (i.e. the extent of S phase progression at any one given point). In the dishes containing coverslips, 10 µM EdU was added to each dish just 1 h before these samples were fixed, in order to identify cells that were highly likely to have been actively replicating at the time of fixation. The cells with no EdU treatment were stained with propidium iodide, to monitor DNA content (a) that was used to calculate the value for the proportion of the population with 2 N DNA content (b), alongside the proportion of the population that had incorporated the EdU at any one time point (c). The samples from the population that had been subjected to the 1 h 10 µM EdU pulses were counterstained with γ-H2AX antibodies (d, e). The numbers next to the plots in (a) indicate hours since release, with U indicating an untreated control population. (d) Plots show the frequency of cells with staining of more than two γ-H2AX foci (light fill), EdU (intermediate fill) or those cells positive for both markers (black). (e) Focuses on the γ-H2AX-positive cells. The plots show the following at the indicated time points after palbociclib removal: the proportion of the whole population that stain positive for γ-H2AX alone (black, i.e. damaged cells, unlikely to be in S phase at the time of fixation), or for both γ-H2AX and EdU (grey, cells in S phase at the time of fixation). For each time point, at least 200 cells were counted to score each characteristic as a proportion of the total counted. The two populations sampled in parallel after staggered palbociclib addition are differentiated by grey and red in (a), closed circles and open squares in (b,c). This experiment was repeated three times with the similar outcomes each time; however, the finer kinetics of the synchrony plots differed and so it was not appropriate to combine the datasets.
Figure 10.
Figure 10.
DNA damage at arrest and throughout release in thymidine but not palbociclib synchronized H1299 cells. H1299 cells were grown to 1.5 × 10⁴ cells cm−2 in RPMI (+10% serum), trypsinized and plated at 4.4 × 103 cm−2 in 10 cm dishes. Twelve hours later, either 150 nM palbociclib (ac) or 2 mM thymidine (df) was added, as indicated. Two 10 cm dishes were used for each condition and each timepoint, one for FACS analysis and one containing coverslips for immunofluourescence. Twenty-four hours after inhibitor addition, cells were washed twice with pre-warmed medium before the addition of pre-warmed medium that did not contain any inhibitor. Samples (the contents of one entire 10 cm dish per sample) were removed for fixation at two hourly intervals. Ten micromolar EdU was added to each dish containing coverslips 1 h before fixation, alongside processing for combined propidium iodide staining to monitor DNA content by FACs (electronic supplementary material, figure S4) from which we derived the plots of 2 N DNA content shown in (a). Processing the EdU staining revealed the cells that were likely to be in S phase at the time of fixation, while the γ-H2AX staining revealed cells with double-strand breaks in their nuclear DNA that could arise as a consequence of DNA damage or active replication. (b,e) Plots of the frequency of cells with staining of more than two γ-H2AX foci (light fill), EdU (intermediate fill) or those cells positive for both markers (black). (c,f) focus only on the population of γ-H2AX-positive cells. Two categories are scored: those that show only a γ-H2AX signal and no EdU signal (black) and those positive for both γ-H2AX and EdU and so are highly likely to be in S phase at the time of fixation (light). For each time point, at least 200 cells were counted to score each characteristic as a proportion of the total counted. The two populations sampled in parallel after staggered palbociclib addition are differentiated by closed circles and open squares in (a,d). This experiment was repeated three times with the similar outcomes each time; however, the finer kinetics of the synchrony plots differed and so it was not appropriate to combine the datasets.
Figure 11.
Figure 11.
Substantial recovery from extended palbociclib-imposed cell cycle arrest. THP1 and H1299 were grown in RPMI (+10% serum), and hTERT RPE1 and A549 were grown in DMEM (+10% serum). Adherent lines were grown to around 1.5 × 10⁴ cells cm−2, isolated by trypsin digestion and plated at 4.4 × 10³ cells cm−2 in 10 cm dishes. The suspension cell line THP1 was grown to around 4 × 10⁵ cells ml−1, isolated by centrifugation at 300g for 3 min and plated at 1 × 10⁵ ml−1 in 10 cm dishes. Eighteen 10 cm dishes were plated for each cell line. Six hours later, dishes were either treated with the indicated concentration of palbociclib or left untreated. At the indicated time intervals, one plate for each condition was processed for propidium iodide FACs analysis, while another was incubated in palbociclib-free medium containing 330 nM nocodazole for a further 24 h before it too was processed for propidium iodide FACs analysis. The proportion of the population that had a 2 N DNA content was calculated from the FACs profiles and plotted in the panels. The samples after the incubation for the time shown under the plot are shown in grey, while the paired sample of cells of this population that had been released from the palbociclib arrest by medium replacement with nocodazole medium before fixation 24 h later are shown in blue. Each plot represents the average of at least three biological repeats. The error bars represent 1 × s.d.

References

    1. Mitchison JM. 1971. Synchronous cultures. In The biology of the cell cycle (ed. Mitchison JM.), pp. 25–57. London, NY: Cambridge University Press.
    1. Banfalvi G. 2011. Overview of cell synchronization. In Cell cycle synchronization (ed. Banfalvi G.), pp. 1–23. Totowa, NJ: Humana Press.
    1. Sakaue-Sawano A, et al. 2017. Genetically encoded tools for optical dissection of the mammalian cell cycle. Mol. Cell 68, 626–640.e5. (10.1016/j.molcel.2017.10.001) - DOI - PubMed
    1. Ly T, Whigham A, Clarke R, Brenes-Murillo AJ, Estes B, Madhessian D, Lundberg E, Wadsworth P, Lamond AI. 2017. Proteomic analysis of cell cycle progression in asynchronous cultures, including mitotic subphases, using PRIMMUS. eLife 6, 843 (10.7554/eLife.27574) - DOI - PMC - PubMed
    1. Schneiderman MH, Dewey WC, Leeper DB, Nagasawa H. 1972. Use of the mitotic selection procedure for cell cycle analysis. Comparison between the X-ray and cycloheximide G2 markers. Exp. Cell Res. 74, 430–438. (10.1016/0014-4827(72)90398-9) - DOI - PubMed

Publication types

MeSH terms