[Preprint]. 2020 Oct 5:2020.10.02.20204859.
doi: 10.1101/2020.10.02.20204859.

Pooled Saliva Specimens for SARS-CoV-2 Testing

Affiliations

Pooled Saliva Specimens for SARS-CoV-2 Testing

Bidisha Barat et al. medRxiv. .

Update in

  • Pooled Saliva Specimens for SARS-CoV-2 Testing.
    Barat B, Das S, De Giorgi V, Henderson DK, Kopka S, Lau AF, Miller T, Moriarty T, Palmore TN, Sawney S, Spalding C, Tanjutco P, Wortmann G, Zelazny AM, Frank KM. Barat B, et al. J Clin Microbiol. 2021 Feb 18;59(3):e02486-20. doi: 10.1128/JCM.02486-20. Print 2021 Feb 18. J Clin Microbiol. 2021. PMID: 33262219 Free PMC article.

Abstract

We evaluated saliva (SAL) specimens for SARS-CoV-2 RT-PCR testing by comparison of 459 prospectively paired nasopharyngeal (NP) or mid-turbinate (MT) swabs from 449 individuals with the aim of using saliva for asymptomatic screening. Samples were collected in a drive-through car line for symptomatic individuals (N=380) and in the emergency department (ED) (N=69). The percent positive and negative agreement of saliva compared to nasopharyngeal swab were 81.1% (95% CI: 65.8% - 90.5%) and 99.8% (95% CI: 98.7% - 100%), respectively. The sensitivity increased to 90.0% (95% CI: 74.4% - 96.5%) when considering only samples with moderate to high viral load (Cycle threshold (Ct) for the NP <=34). Pools of five saliva specimens were also evaluated on three platforms: bioMérieux NucliSENS easyMAG with ABI 7500Fast (CDC assay), Hologic Panther Fusion, and Roche COBAS 6800. The median loss of signal upon pooling was 2-4 Ct values across the platforms. The sensitivity of detecting a positive specimen in a pool compared with testing individually was 100%, 93%, and 95% for CDC 2019-nCoV Real-Time RT-PCR, Panther Fusion® SARS-CoV-2 assay, and cobas® SARS-CoV-2 test respectively, with decreased sample detection trending with lower viral load. We conclude that although pooled saliva testing, as collected in this study, is not quite as sensitive as NP/MT testing, saliva testing is adequate to detect individuals with higher viral loads in an asymptomatic screening program, does not require swabs or viral transport media for collection, and may help to improve voluntary screening compliance for those individuals averse to various forms of nasal collections.


Figures
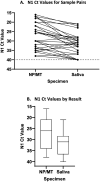
Figure 1 (A-C).
Figure 1 (A-C).. Comparison of Cycle Threshold (Ct) values of N1 for NP versus SAL specimens.
A. N1 Ct values for paired NP/MT and SAL samples (29 pairs). Pairs are connected by a line. The N1 Ct was set to 40 for samples for which N1 was not detected, indicating negative for SARS-CoV-2 RNA. Horizontal dashed line is at Ct=40, the assay cut off. P-value < 0.001 calculated by Wilcoxon matched-pair signed rank test. B. A lower median viral load was seen for SAL specimens compared with the median Ct for NP/MT samples. Median and interquartile range are 26, (21–34) for NP/MT and 31, (29–37) for SAL respectively. P-value <0.001. C. RP Ct values for NP/MT and SAL specimens (424 pairs). Median and interquartile range are 24, (–25) for NP/MT and 22 (–23) for saliva respectively. Horizontal dashed line is at Ct=40, the assay cut off. P value < 0.001 calculated by Wilcoxon matched-pairs signed rank test.
Figure 2 (A-C).
Figure 2 (A-C).. Comparison of Cycle Threshold (Ct) values for individual and pooled saliva specimens on different testing platforms.
A. Ct values for paired individual and pooled samples (easyMAG/ABI 7500) for 41 pairs. B. Ct values for paired individual (easyMAG/ABI 7500) and pooled samples (Hologic Panther) for 30 pairs. C. Ct values for paired individual (easyMAG/ABI 7500) and pooled samples (Roche COBAS 6800) for 39 pairs. For A-C, pairs are connected by a line. Horizontal dashed line is at Ct=40, the assay cut off. P-value < 0.001 calculated by Wilcoxon matched- pair signed rank test. For C,D, the pooled Ct was set to 40 for samples in which N1 was not detected including those negative for SARS- CoV-2 RNA.

References

    1. Johns Hopkins University and Medicine. Covid-19 Dashboard by the Center for Systems Science and Engineering (CSSE) at Johns Hopkins University. https://coronavirus.jhu.edu/map.html. Accessed September 20, 2020.
    1. Hanson KE, Barker AP, Hillyard DR, Gilmore N, Barrett JW, Orlandi RR, Shakir SM. 2020. Self- Collected Anterior Nasal and Saliva Specimens versus Healthcare Worker-Collected Nasopharyngeal Swabs for the Molecular Detection of SARS-CoV-2. J Clin Microbiol doi: 10.1128/JCM.01824-20 - DOI - PMC - PubMed
    1. Jamal AJ, Mozafarihashjin M, Coomes E, Powis J, Li AX, Paterson A, Anceva-Sami S, Barati S, Crowl G, Faheem A, Farooqi L, Khan S, Prost K, Poutanen S, Taylor M, Yip L, Zhong XZ, McGeer AJ, Mubareka S, Toronto Invasive Bacterial Diseases Network C-I. 2020. Sensitivity of nasopharyngeal swabs and saliva for the detection of severe acute respiratory syndrome coronavirus 2 (SARS-CoV-2). Clin Infect Dis doi: 10.1093/cid/ciaa848 - DOI - PMC - PubMed
    1. Landry ML, Criscuolo J, Peaper DR. 2020. Challenges in use of saliva for detection of SARS CoV-2 RNA in symptomatic outpatients. J Clin Virol 130:104567 doi: 10.1016/j.jcv.2020.104567 - DOI - PMC - PubMed
    1. Centers for Disease Control and Prevention. Interim Guidelines for Collecting, Handling and Testing Clinical Specimens for COVID-19. https://www.cdc.gov/coronavirus/2019-nCoV/lab/guidelines-clinical-specim.... Accessed September 20, 2020.

Publication types