. 2021 Feb;15(2):407-428.
doi: 10.1002/1878-0261.12823. Epub 2020 Nov 25.

Metabolomic profile of cancer stem cell-derived exosomes from patients with malignant melanoma

Affiliations

Metabolomic profile of cancer stem cell-derived exosomes from patients with malignant melanoma

José Luis Palacios-Ferrer et al. Mol Oncol. 2021 Feb.

Abstract

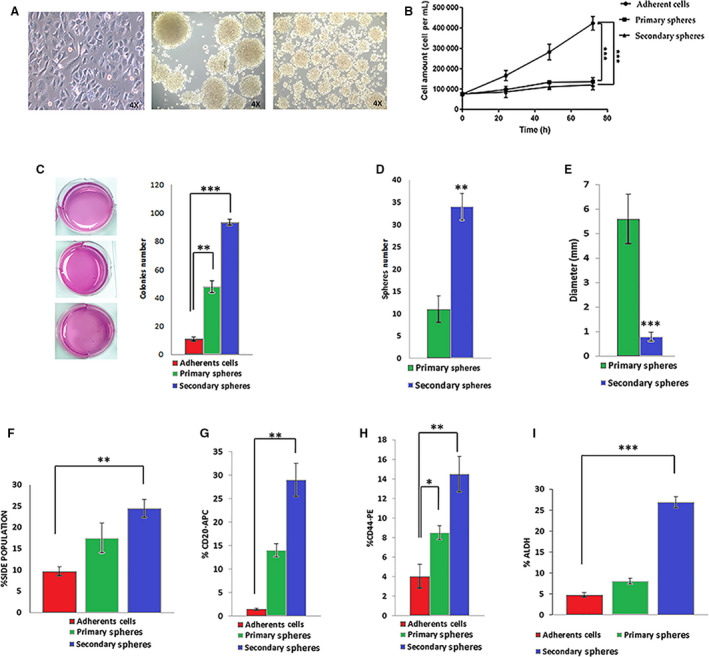
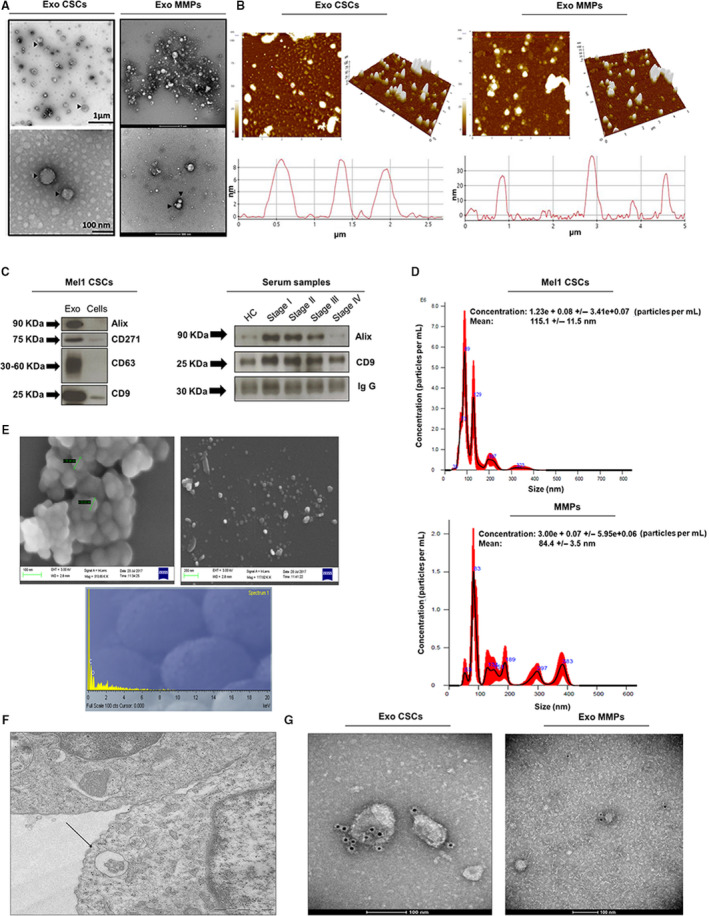
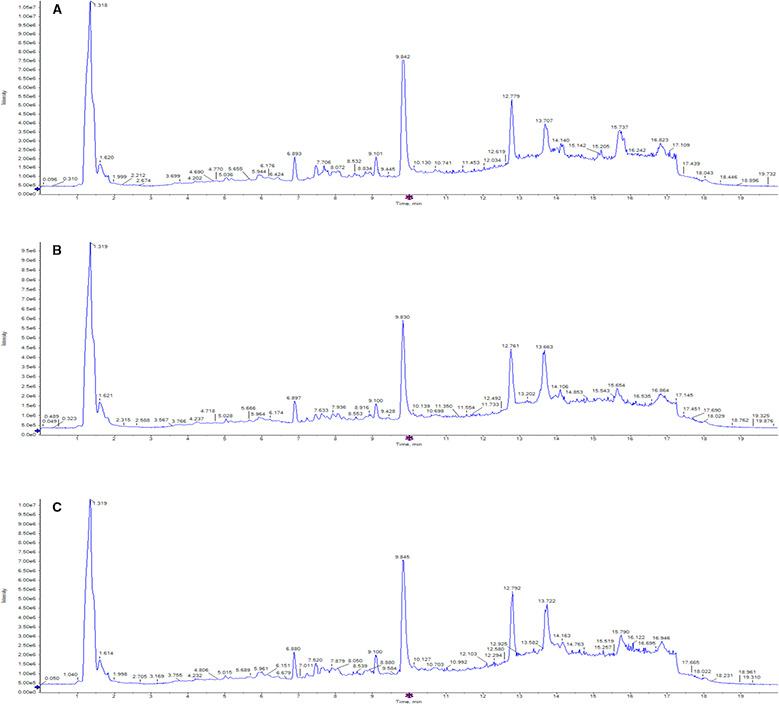
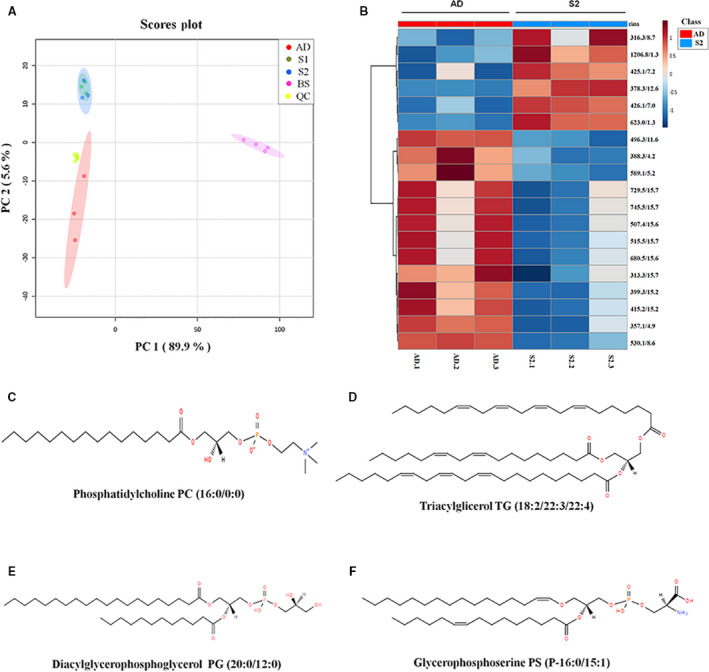
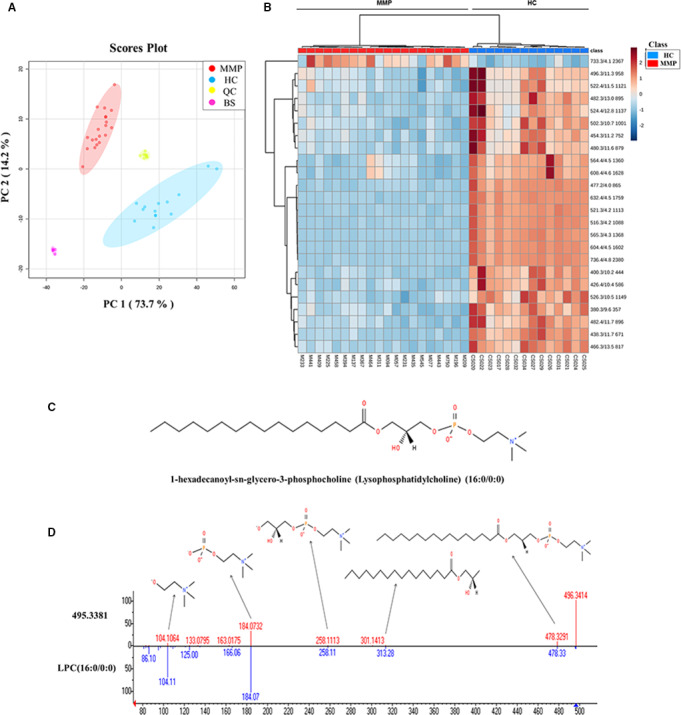
Malignant melanoma (MM) is the most aggressive and life-threatening form of skin cancer. It is characterized by an extraordinary metastasis capacity and chemotherapy resistance, mainly due to melanoma cancer stem cells (CSCs). To date, there are no suitable clinical diagnostic, prognostic or predictive biomarkers for this neoplasia. Therefore, there is an urgent need for new MM biomarkers that enable early diagnosis and effective disease monitoring. Exosomes represent a novel source of biomarkers since they can be easily isolated from different body fluids. In this work, a primary patient-derived MM cell line enriched in CSCs was characterized by assessing the expression of specific markers and their stem-like properties. Exosomes derived from CSCs and serums from patients with MM were characterized, and their metabolomic profile was analysed by high-resolution mass spectrometry (HRMS) following an untargeted approach and applying univariate and multivariate statistical analyses. The aim of this study was to search potential biomarkers for the diagnosis of this disease. Our results showed significant metabolomic differences in exosomes derived from MM CSCs compared with those from differentiated tumour cells and also in serum-derived exosomes from patients with MM compared to those from healthy controls. Interestingly, we identified similarities between structural lipids differentially expressed in CSC-derived exosomes and those derived from patients with MM such as the glycerophosphocholine PC 16:0/0:0. To our knowledge, this is the first metabolomic-based study aimed at characterizing exosomes derived from melanoma CSCs and patients' serum in order to identify potential biomarkers for MM diagnosis. We conclude that metabolomic characterization of CSC-derived exosomes sets an open door to the discovery of clinically useful biomarkers in this neoplasia.

Keywords: biomarkers; cancer stem cells; exosomes; malignant melanoma; metabolomics.


Conflict of interest statement

The authors declare no conflict of interest.

Figures

Fig. 1
Fig. 1
Characterization of Mel1 CSCs. (A) Representative light microscopy (4×) images of primary (left) and secondary (right) melanospheres formed from Mel1 cell line; (B) proliferation curves of Mel1 adherent cells and melanospheres cultured for 3 days and seeded with an equal number of cells at day 0; (C) representative optical image of the colonies formed by Mel1 cells coming from adherent cells, primary and secondary spheroids after 37 days soft agar culture in P6 well plates; stained with 0.1% iodonitrotetrazolium chloride; (D) number of primary and secondary spheres formed by Mel1 cell line growing in anchorage‐independent and serum‐free conditions. Spheres were counted after 3 days under light microscopy; (E) diameter of primary and secondary spheres, measured by imagej software; (F) side population determined in the different culture types; (G) percentage of CD20+ and (H) CD44+ in adherent cells and primary and secondary melanospheres, and (I) percentage of ALDH+ cells measured by flow cytometry. Data are graphed as mean ± SD from experiments carried out in triplicates (***P < 0.001; **P < 0.01; *P < 0.05).
Fig. 2
Fig. 2
Characterization of exosomes derived from Mel1 secondary melanospheres and MMP serums. (A) Transmission electron microscopy images of isolated exosomes with a saucer‐like shape limited by a lipid bilayer. EVs isolated from Mel1 secondary melanospheres culture supernatants had diameters ranging from ~ 40 to 210 nm; those isolated from MMP in had a diameter ranging from ~ 30 to 140 nm. Images show exosomes derived from an MMP at stage IV. Black arrowheads point to exosomes; (B) topography of exosomes derived from Mel1 secondary melanospheres and MMP serum observed under atomic force microscopy (AFM). Exosomes on a mica surface revealed heterogeneity in size and shape as well as forming aggregates in both 2‐dimensional 2D (left) images and 3D profiles (right). Acquisition areas were 5 × 5 µm2; (C) western blot analysis of CD9, CD63, Alix exosomal surface markers and the CD271 melanoma stem cell marker in melanosphere‐derived exosomes and Mel1 CSCs. The expression of CD9 and Alix is also shown as representative exosomal surface markers in MMP serum‐derived exosomes. IgG was used as a positive control; (D) the size distribution of exosomes obtained from Mel1 CSC and MMP serum was analysed by NTA; (E) scanning electron microscopy images of CSC‐derived exosomes aggregated (left) and individualized (right) and microanalysis of particles (down) showing the particle composition; (F) multivesicular bodies observed by electron microscopy in Mel1 CSCs. Image obtained from paraffin sections; (G) immunogold using beads coated with an anti‐CD63 antibody in exosomes derived from Mel1 secondary melanospheres cultures (left) and from a stage IV MMP serum (right).
Fig. 3
Fig. 3
Representative HPLC/MS total ion chromatograms (TICs) of metabolites present in exosomes derived from Mel‐1 cell line. TIC corresponding to representative exosome samples derived from (A) adherent cells, (B) primary melanospheres and (C) secondary melanospheres, scanned by positive ion mode. The x‐axis represents the chromatographic retention time, while the y‐axis represents the intensity. Methanol was used for metabolite extraction.
Fig. 4
Fig. 4
Metabolomic analysis of exosomes derived from Mel1 patient‐derived cell line. (A) PCA score plots based on HPLC/MS data of exosome samples derived from adherent cells (red), primary melanospheres (green), secondary melanospheres (blue), QC samples (yellow) and BS samples (pink). (B) Heat map showing the significantly different metabolites when comparing exosomes derived from adherent cells (red) and secondary melanospheres (blue). Each row on the heat map represent a unique metabolite with a characteristic mass‐to‐charge ratio and retention time, while each column represents one exosome sample. The colour code represents the normalized intensity with which each metabolite is detected. Blue represents a decreasing trend, while red represents a rising trend. (C) Chemical structure of candidate biomarker 1‐hexadecanoyl‐sn‐glycero‐3‐phosphocholine PC (16:0/0:0). (D) Chemical structure of candidate biomarker triacylglycerol TG (18:2/22:3/22:4). (E) Chemical structure of candidate biomarker diacylglycerophosphoglycerol PG (20:0/12:0). (F) Chemical structure of candidate biomarker glycerophosphoserine PS (P‐16:0/15:1).
Fig. 5
Fig. 5
Metabolomic analysis of serum‐derived exosomes from both patients with malignant melanoma and healthy individuals. (A) PCA score plots based on HPLC/MS data of serum‐derived exosome samples from MMPs (red), HCs (blue), QC samples (yellow) and BS samples (pink). (B) Heat map showing the changing intensity patterns of significantly different metabolites of two‐group comparison: exosome samples derived from MMPs (red) versus exosomes derived from HCs (blue). (C) Chemical structure of candidate biomarker 1‐hexadecanoyl‐sn‐glycero‐3‐phosphocholine PC (16:0/0:0); (D) representative fragmentation spectrum of candidate biomarker PC (16:0/0:0). Within the product ion spectra arising from the [M + H]+ ions of this molecule, different specific fragments were found, such as the m/z 184, 104, 258, 321 or 478 ions, corresponding to characteristic molecule fragments.

References

    1. Allegra A, Alonci A, Penna G, Innao V, Gerace D, Rotondo F & Musolino C (2014) The cancer stem cell hypothesis: a guide to potential molecular targets. Cancer Invest 32, 470–495. - PubMed
    1. Islam F, Gopalan V, Smith RA & Lam AK‐Y (2015) Translational potential of cancer stem cells: a review of the detection of cancer stem cells and their roles in cancer recurrence and cancer treatment. Exp Cell Res 335, 135–147. - PubMed
    1. Hernández‐Camarero P, Jiménez G, López‐Ruiz E, Barungi S, Marchal JA & Perán M (2018) Revisiting the dynamic cancer stem cell model: importance of tumour edges. Crit Rev Oncol Hematol 131, 35–45. - PubMed
    1. Schatton T, Murphy GF, Frank NY, Yamaura K, Waaga‐Gasser AM, Gasser M, Zhan Q, Jordan S, Duncan LM, Weishaupt C et al (2008) Identification of cells initiating human melanomas. Nature 451, 345–349. - PMC - PubMed
    1. Civenni G, Walter A, Kobert N, Mihic‐Probst D, Zipser M, Belloni B, Seifert B, Moch H, Dummer R, van den Broek M et al (2011) Human CD271‐positive melanoma stem cells associated with metastasis establish tumor heterogeneity and long‐term growth. Cancer Res 71, 3098–3109. - PubMed

Publication types