Clinical Trial
. 2020 Dec 20;38(36):4260-4273.
doi: 10.1200/JCO.19.03250. Epub 2020 Oct 14.

First-in-Human Phase I Study of Iadademstat (ORY-1001): A First-in-Class Lysine-Specific Histone Demethylase 1A Inhibitor, in Relapsed or Refractory Acute Myeloid Leukemia

Affiliations
Clinical Trial

First-in-Human Phase I Study of Iadademstat (ORY-1001): A First-in-Class Lysine-Specific Histone Demethylase 1A Inhibitor, in Relapsed or Refractory Acute Myeloid Leukemia

Olga Salamero et al. J Clin Oncol. .

Abstract

Purpose: Iadademstat is a novel, highly potent, and selective inhibitor of LSD1 (KDM1A), with preclinical in vitro and in vivo antileukemic activity. This study aimed to determine safety and tolerability of iadademstat as monotherapy in patients with relapsed/refractory acute myeloid leukemia (R/R AML).

Methods: This phase I, nonrandomized, open-label, dose-escalation (DE), and extension-cohort (EC) trial included patients with R/R AML and evaluated the safety, pharmacokinetics (PK), pharmacodynamics (PD), and preliminary antileukemic activity of this orally bioavailable first-in-class lysine-specific demethylase 1 inhibitor.

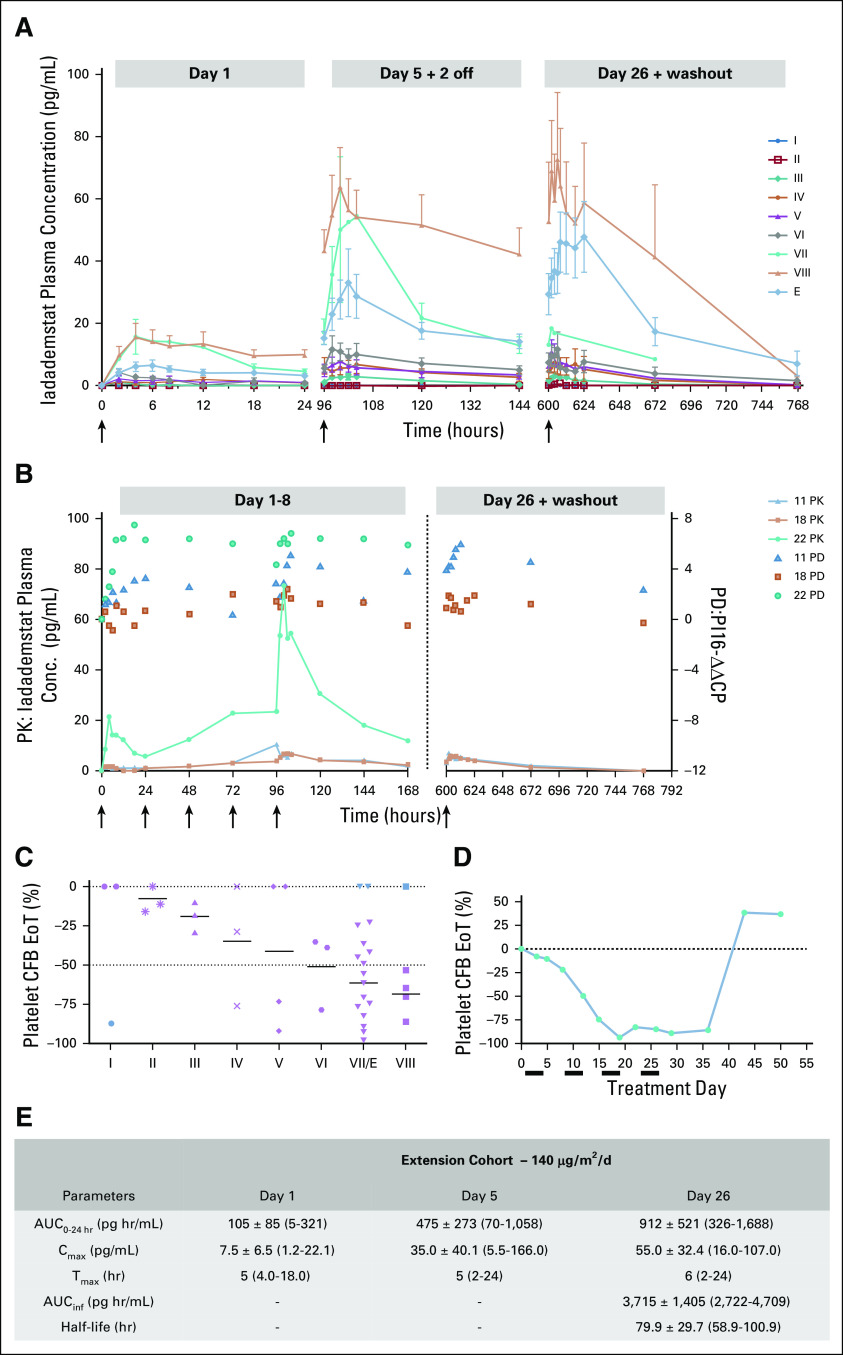
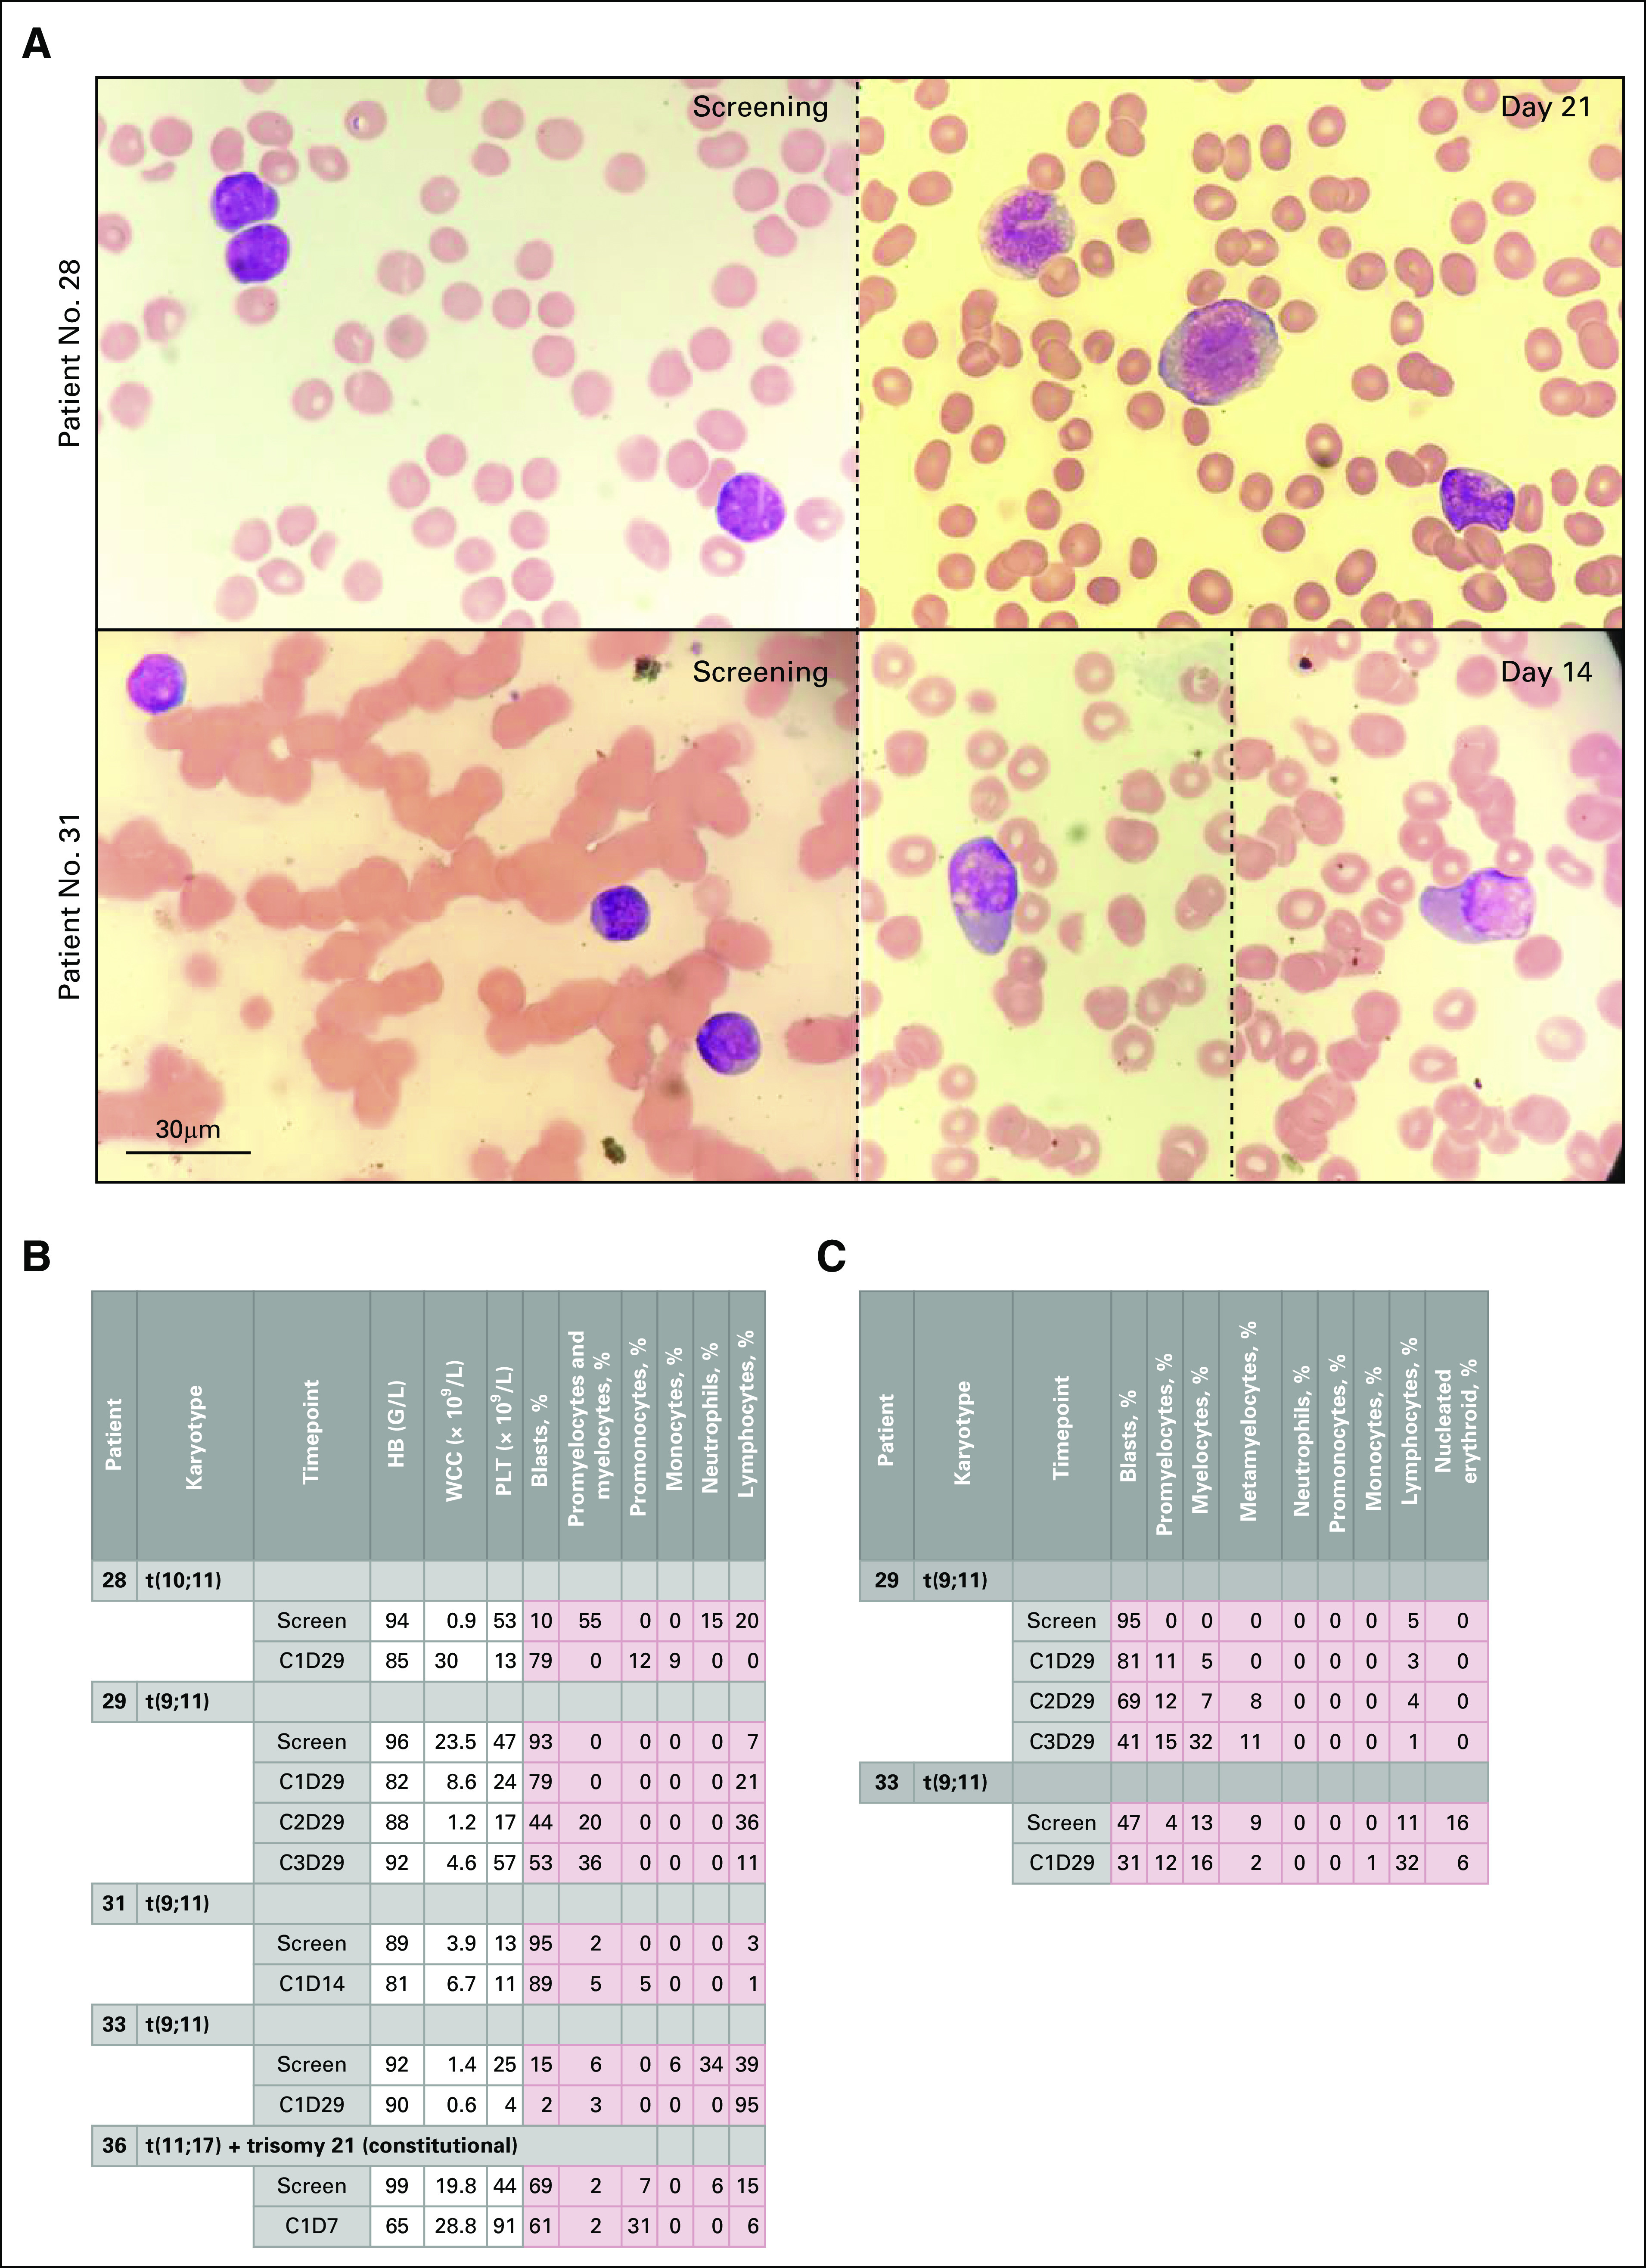
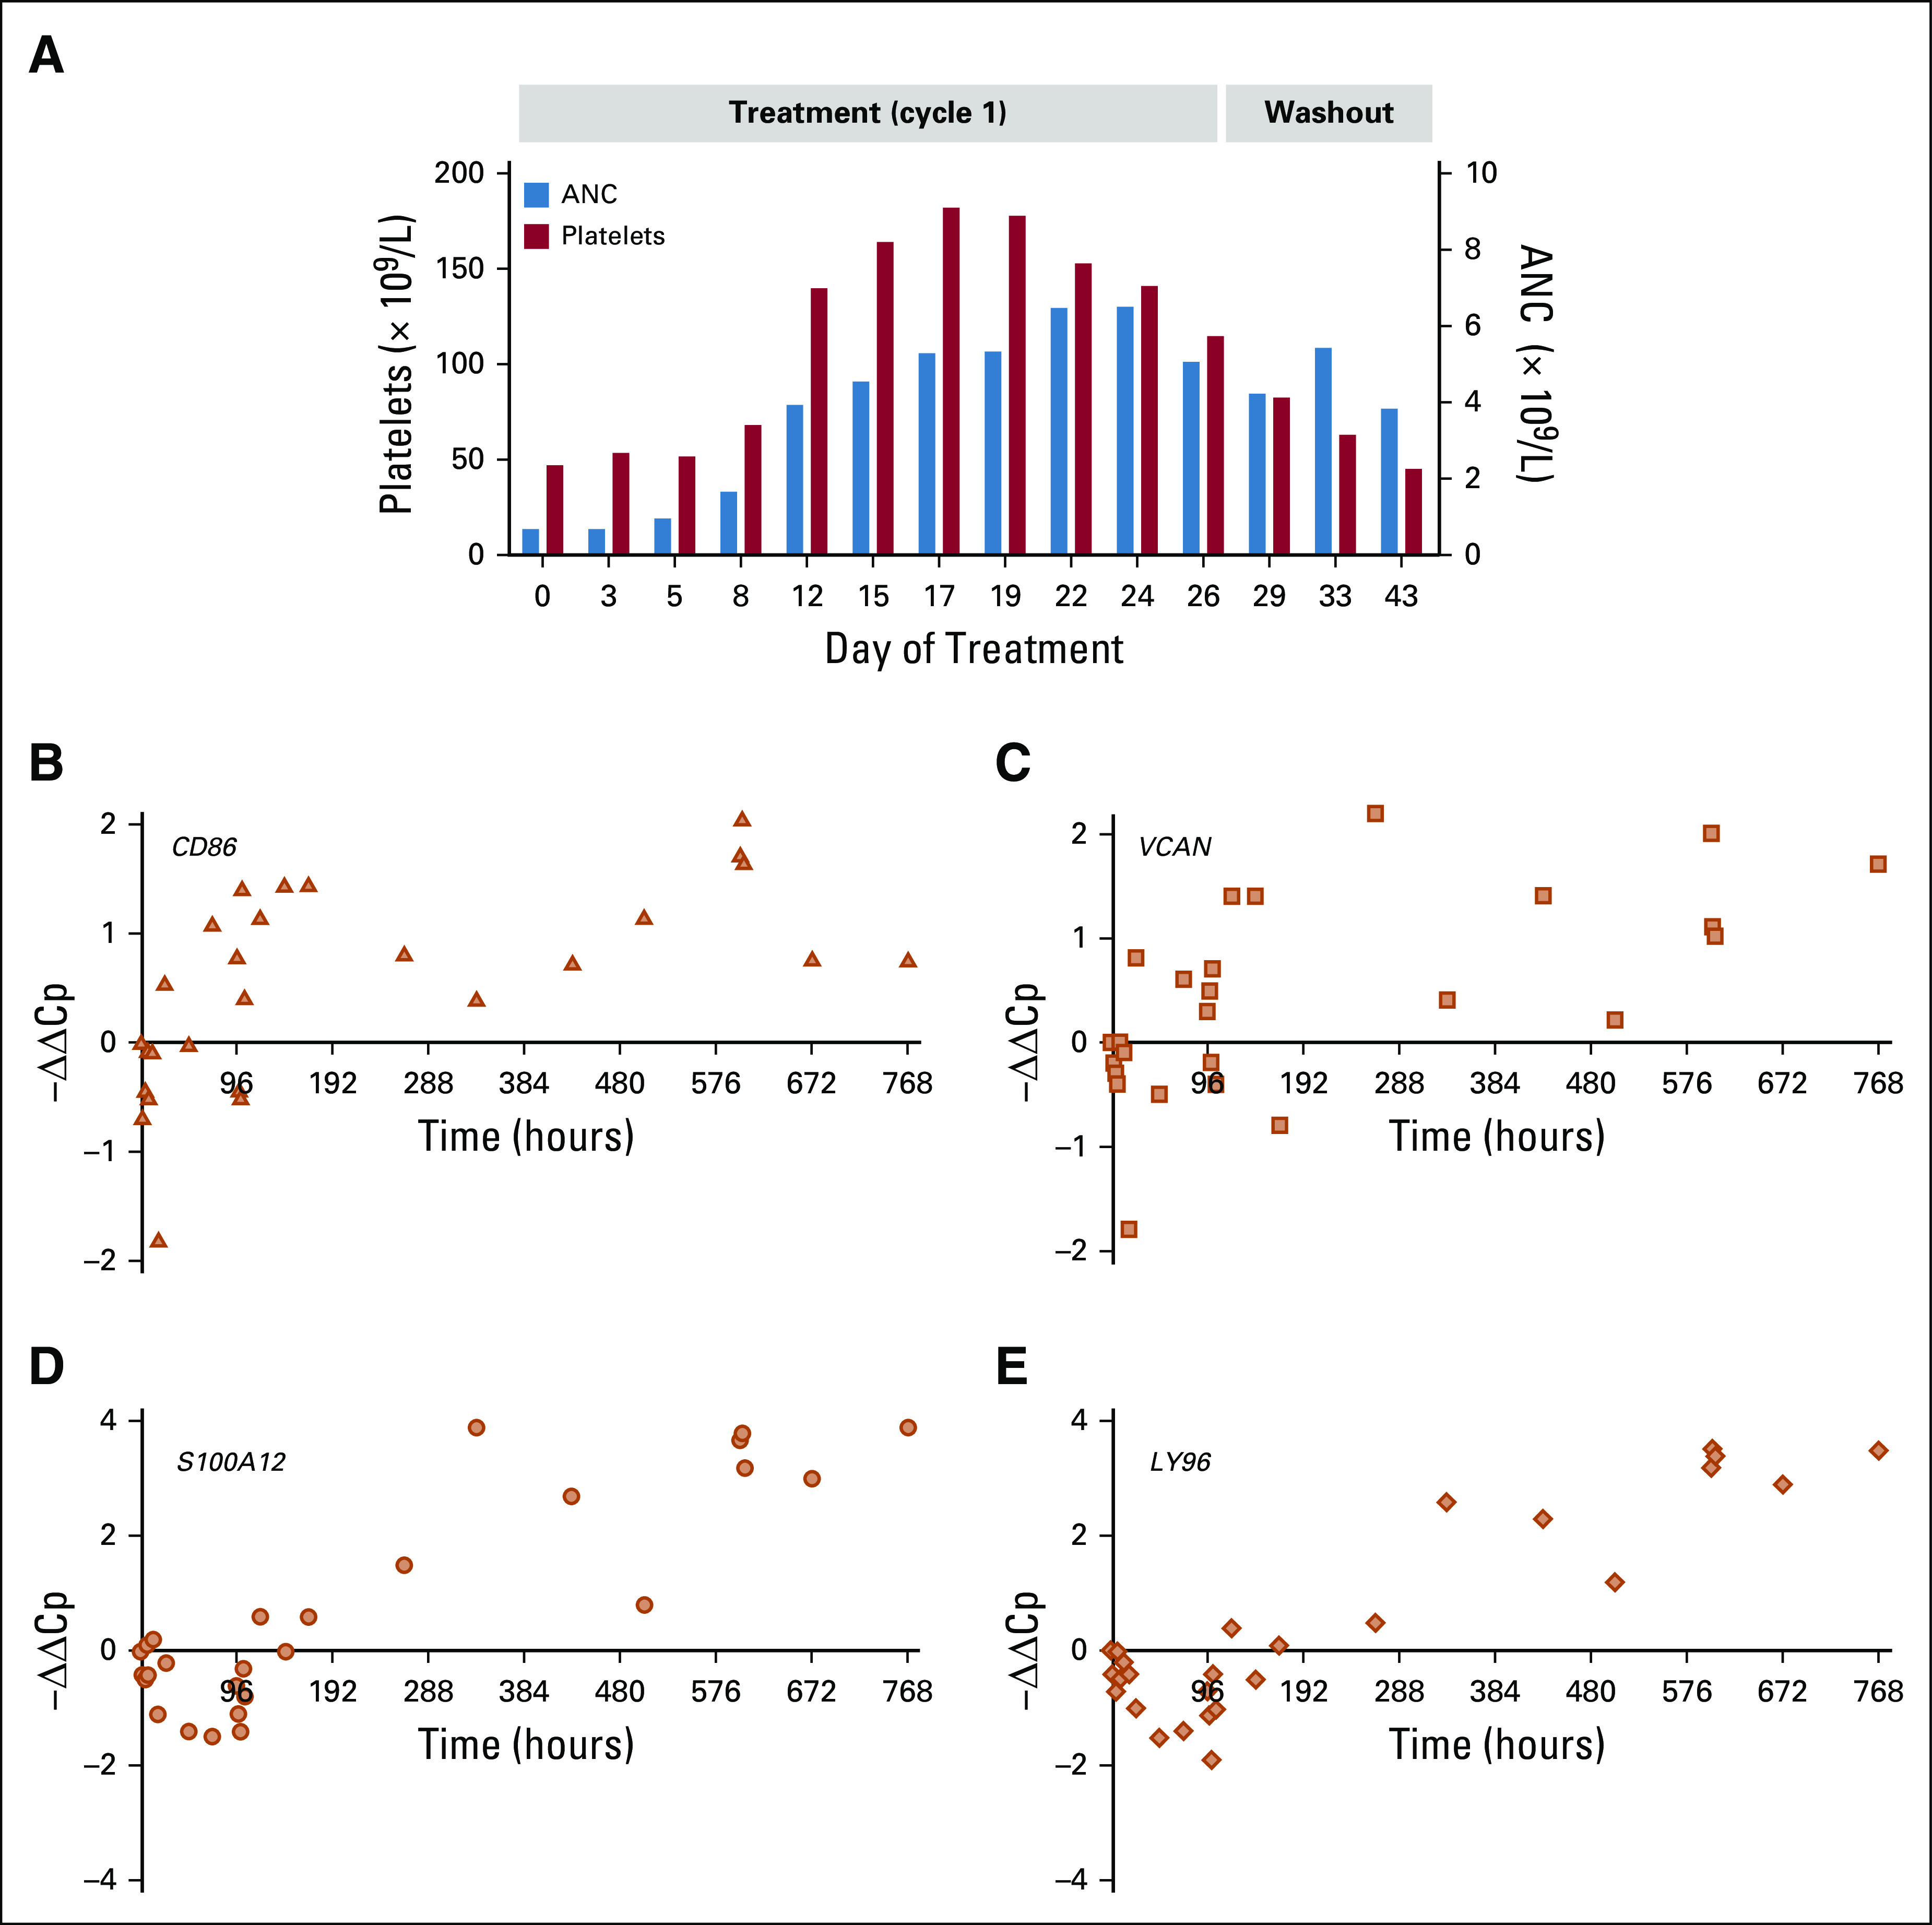
Results: Twenty-seven patients were treated with iadademstat on days 1 to 5 (5-220 µg/m2/d) of each week in 28-day cycles in a DE phase that resulted in a recommended dose of 140 µg/m2/d of iadademstat as a single agent. This dose was chosen to treat all patients (n = 14) in an EC enriched with patients with MLL/KMT2A-rearranged AML. Most adverse events (AEs) were as expected in R/R AML and included myelosuppression and nonhematologic AEs, such as infections, asthenia, mucositis, and diarrhea. PK data demonstrated a dose-dependent increase in plasma exposure, and PD data confirmed a potent time- and exposure-dependent induction of differentiation biomarkers. Reductions in blood and bone marrow blast percentages were observed, together with induction of blast cell differentiation, in particular, in patients with MLL translocations. One complete remission with incomplete count recovery was observed in the DE arm.

Conclusion: Iadademstat exhibits a good safety profile together with signs of clinical and biologic activity as a single agent in patients with R/R AML. A phase II trial of iadademstat in combination with azacitidine is ongoing (EudraCT No.: 2018-000482-36).


Figures

FIG 1.
FIG 1.
Pharmacokinetics (PK) and pharmacodynamics (PD) assessments of iadademstat. (A) Plasma levels of iadademstat were assessed by High-performance liquid chromatography–tandem mass spectrometry (HPLC-MS/MS) in serial samples (day [D]1, D5, D26), trough samples, and washout samples. Mean ± SEM plasma levels in cohorts I-VIII and the extension cohort (EC) are shown. (B) PK/PD relationship for PI16 (peptidase inhibitor 16) expression in patients 11 (cohort IV; triangles), 18 (cohort VI; squares), and 22 (cohort VII; dots) during week 1 of treatment (left panel) or washout (right panel). Black arrows indicate dosing occasions. (C) Maximal impact of iadademstat on platelet levels, represented as % inhibition compared with baseline. Individual (symbols) and mean (bar) values are shown for each cohort. Blue symbols represent outlier values that were excluded for calculation of mean. (D) Example of the platelet dynamics in patient 21 (cohort VII), with a predose count of 149 × 109/L. A time-dependent reduction is followed by rebound. Black bars indicate iadademstat treatment blocks. (E) PK parameters for iadademstat in the EC. Area under the curve (AUC)0-24h indicates area under the plasma concentration time curve within time 0 to 24 hours (D1: n = 13, D5: n = 13, D26: n = 9). Cmax indicates maximum (peak) plasma drug concentration (D1: n = 14, D5: n = 14, D26: n = 9). Tmax indicates time to reach maximum (peak) plasma concentration (D1: n = 14, D5: n = 14, D26: n = 9). AUCinf indicates area under the plasma concentration time curve from time zero to infinity and half-life (hours; D26: n = 2). Values are shown as mean ± standard deviation (median for Tmax) with range in brackets. CFB, change from baseline; EoT, end of treatment.
FIG 2.
FIG 2.
Morphologic response to treatment with iadademstat. (A) Representative images of blood smears showing morphologic differentiation from patient 28 (top) at screening (left) and cycle 1(C1), day 21 (D21) (right) and patient 31 (bottom) at screening (left) and C1D14 (right; two images from the same slide and patient are shown, separated by a dotted line). Charts show results of morphologic analysis of (B) blood smears and (C) bone marrow smears from selected MLL-translocated patients in the extension cohort (EC). HB, hemoglobin; WCC, white cell count; PLT, platelets.
FIG 3.
FIG 3.
Molecular response to treatment with iadademstat. Relative gene expression levels in nucleated blood cells of a differentiation biomarker panel in the extension cohort (EC). Magenta values show gene upregulation and pink values show gene downregulation. The maximum response and its timing within the treatment period is shown. Data are expressed as −ΔΔCp, calculated relative to expression of the endogenous gene HPRT1 and to the predose sample. Information on the occurrence of blast cell differentiation in bone marrow (BM) or blood and the percentage variation is also shown. The final column shows blast percentage in peripheral blood at baseline. (a) In bone marrow and/or peripheral blood. (b) Grey background indicates chromosome alterations involving MLL; dark grey, MLL fusion. (c) Between D5 and D12 of treatment (patient 28) or between D15 and D29 of treatment (patient 32). (d) Differentiation syndrome diagnosed. Morph. differ., morphologic differentiation.
FIG 4.
FIG 4.
Hematologic and biomarker response in patient 16. (A) Absolute neutrophil count (ANC) and platelet dynamics after treatment (cycle 1) and during the washout period in patient 16 of cohort V. Time course of changes in expression of differentiation biomarkers analyzed by quantitative reverse transcriptase–polymerase chain reaction shows that iadademstat induced expression of (B) CD86, (C) VCAN, (D) S100A12, and (E) LY96 in blood cells of patient 16.

References

    1. Vardiman JW Thiele J Arber DA, et al. : The 2008 revision of the World Health Organization (WHO) classification of myeloid neoplasms and acute leukemia: Rationale and important changes. Blood 114:937-951, 2009 - PubMed
    1. Döhner H Estey EH Amadori S, et al. : Diagnosis and management of acute myeloid leukemia in adults: Recommendations from an international expert panel, on behalf of the European LeukemiaNet. Blood 115:453-474, 2010 - PubMed
    1. Döhner H, Weisdorf DJ, Bloomfield CD: Acute myeloid leukemia. N Engl J Med 373:1136-1152, 2015. - PubMed
    1. Nagel G Weber D Fromm E, et al. : Epidemiological, genetic, and clinical characterization by age of newly diagnosed acute myeloid leukemia based on an academic population-based registry study (AMLSG BiO). Ann Hematol 96:1993-2003, 2017 - PMC - PubMed
    1. Burnett AK Milligan D Prentice AG, et al. : A comparison of low-dose cytarabine and hydroxyurea with or without all-trans retinoic acid for acute myeloid leukemia and high-risk myelodysplastic syndrome in patients not considered fit for intensive treatment. Cancer 109:1114-1124, 2007 - PubMed

Publication types

Associated data