. 2020 Dec 1;124(6):1698-1705.
doi: 10.1152/jn.00534.2020. Epub 2020 Oct 14.

Prediction of mild parkinsonism revealed by neural oscillatory changes and machine learning

Affiliations

Prediction of mild parkinsonism revealed by neural oscillatory changes and machine learning

Joyce Chelangat Bore et al. J Neurophysiol. .

Abstract

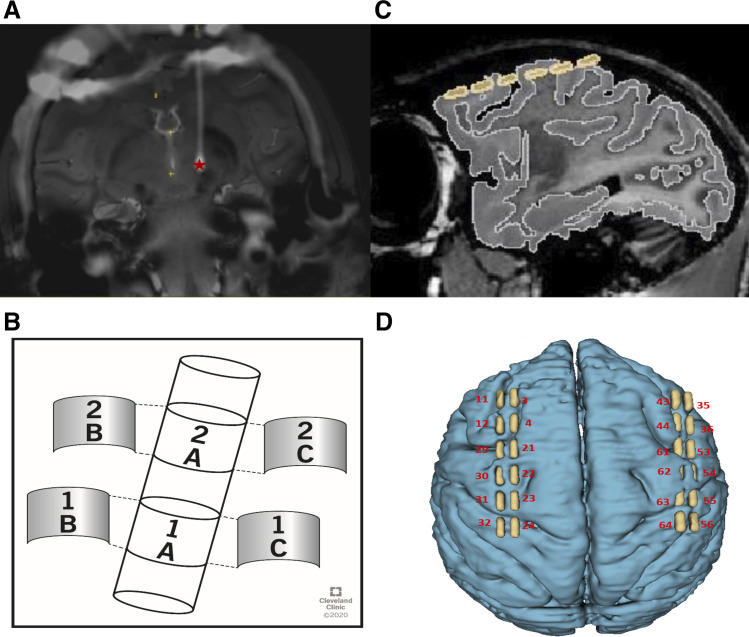
Neural oscillatory changes within and across different frequency bands are thought to underlie motor dysfunction in Parkinson's disease (PD) and may serve as biomarkers for closed-loop deep brain stimulation (DBS) approaches. Here, we used neural oscillatory signals derived from chronically implanted cortical and subcortical electrode arrays as features to train machine learning algorithms to discriminate between naive and mild PD states in a nonhuman primate model. Local field potential (LFP) data were collected over several months from a 12-channel subdural electrocorticography (ECoG) grid and a 6-channel custom array implanted in the subthalamic nucleus (STN). Relative to the naive state, the PD state showed elevated primary motor cortex (M1) and STN power in the beta, high gamma, and high-frequency oscillation (HFO) bands and decreased power in the delta band. Theta power was found to be decreased in STN but not M1. In the PD state there was elevated beta-HFO phase-amplitude coupling (PAC) in the STN. We applied machine learning with support vector machines with radial basis function (SVM-RBF) kernel and k-nearest neighbors (KNN) classifiers trained by features related to power and PAC changes to discriminate between the naive and mild states. Our results show that the most predictive feature of parkinsonism in the STN was high beta (∼86% accuracy), whereas it was HFO in M1 (∼98% accuracy). A feature fusion approach outperformed every individual feature, particularly in the M1, where ∼98% accuracy was achieved with both classifiers. Overall, our data demonstrate the ability to use various frequency band power to classify the clinical state and are also beneficial in developing closed-loop DBS therapeutic approaches.NEW & NOTEWORTHY Neurophysiological biomarkers that correlate with motor symptoms or disease severity are vital to improve our understanding of the pathophysiology in Parkinson's disease (PD) and for the development of more effective treatments, including deep brain stimulation (DBS). This work provides direct insight into the application of these biomarkers in training classifiers to discriminate between brain states, which is a first step toward developing closed-loop DBS systems.

Keywords: Parkinson’s disease; machine learning; phase-amplitude coupling; spectral changes.


Conflict of interest statement

A. G. Machado is a consultant with St Jude Medical. None of the other authors has any conflicts of interest, financial or otherwise, to disclose.

Figures

Fig. 1.
Fig. 1.
Electrode configuration. A: coregistered preoperative MRI and postoperative computer tomography (CT) depicting the trajectory and location of the deep brain stimulation (DBS) lead targeting the subthalamic nucleus (STN) (coronal view, center of contact region of DBS lead marked with a red star). B: lead that was placed in STN. C: the relative location of the electrocorticography (ECoG) array over the ipsilateral hemisphere (sagittal view, contacts highlighted in yellow). Both images reflect coregistration of preoperative MRI and postoperative CT. D: 3-dimensional (3-D) reconstruction of cortex and ECoG array [primary motor cortex (M1) local field potentials (LFPs) were derived from bipolar rereferencing of sites 31 and 23].
Fig. 2.
Fig. 2.
Procedure of data analysis. A: we record local field potentials (LFPs) from the cortex and the subthalamic nucleus (STN), after which these data are preprocessed by bipolar rereferencing, band-pass filtering, and artifact rejection. B: feature extraction via phase-amplitude coupling (PAC) and power spectral density (PSD) of specific frequency bands is performed. PD, parkinsonian. C: features are used for PSD and PAC-based classifier training [support vector machines with radial basis function (SVM-RBF) kernel and k-nearest neighbors (KNN)]. D: finally, classification accuracy is evaluated.
Fig. 3.
Fig. 3.
Local field potential (LFP) power spectra in the low- and high-frequency bands: primary motor cortex (M1) LFP data (A) and subthalamic nucleus (STN) LFP data (B) in both the naive and parkinsonian (PD) states.
Fig. 4.
Fig. 4.
Summary statistics of the changes in oscillatory activity and phase-amplitude coupling (PAC) due to parkinsonism. A: effect of parkinsonism on the power spectral densities (PSDs) and PAC in subthalamic nucleus (STN). B: effect of parkinsonism on the PSDs and PAC in primary motor cortex (M1). ***Significance bars represent P < 0.05, Mann–Whitney–Wilcoxon test, corrected for multiple comparisons. HFO, high-frequency oscillation; PD, parkinsonian; STN, subthalamic nucleus.
Fig. 5.
Fig. 5.
Classification results. A and B: the results of the support vector machines with radial basis function (SVM-RBF) and k-nearest neighbors (KNN) classifiers for the discrimination of various features in the naive and parkinsonian (PD) states based on local field potential (LFP) recordings from primary motor cortex (M1, A) and subthalamic nucleus (STN, B) brain areas. Error bars indicate the 95% confidence interval. C and D: receiver operating characteristic (ROC) curves for both KNN and SVM-RBF for the STN (C) and M1 (D) pooled features that attained the highest classification accuracy among all the comparisons in discriminating between the naive and PD states. HFO, high-frequency oscillation; PAC, phase-amplitude coupling; PSD, power spectral density.

References

    1. Alonso-Frech F, Zamarbide I, Alegre M, Rodríguez-Oroz MC, Guridi J, Manrique M, Valencia M, Artieda J, Obeso JA. Slow oscillatory activity and levodopa-induced dyskinesias in Parkinson’s disease. Brain 129: 1748–1757, 2006. doi:10.1093/brain/awl103. - DOI - PubMed
    1. Altman NS An introduction to kernel and nearest-neighbor nonparametric regression. Am Stat 46: 175–185, 1992. doi:10.1080/00031305.1992.10475879. - DOI
    1. Amoozegar S, Pooyan M, Roughani M. Toward a closed-loop deep brain stimulation in Parkinson’s disease using local field potential in parkinsonian rat model. Med Hypotheses 132: 109360, 2019. doi:10.1016/j.mehy.2019.109360. - DOI - PubMed
    1. Aru J, Aru J, Priesemann V, Wibral M, Lana L, Pipa G, Singer W, Vicente R. Untangling cross-frequency coupling in neuroscience. Curr Opin Neurobiol 31: 51–61, 2015. doi:10.1016/j.conb.2014.08.002. - DOI - PubMed
    1. Avila I, Parr-Brownlie LC, Brazhnik E, Castañeda E, Bergstrom DA, Walters JR. Beta frequency synchronization in basal ganglia output during rest and walk in a hemiparkinsonian rat. Exp Neurol 221: 307–319, 2010. doi:10.1016/j.expneurol.2009.11.016. - DOI - PMC - PubMed

Publication types

LinkOut - more resources