. 2020 Oct 14;16(10):e1008623.
doi: 10.1371/journal.pgen.1008623. eCollection 2020 Oct.

Comparing DNA replication programs reveals large timing shifts at centromeres of endocycling cells in maize roots

Affiliations

Comparing DNA replication programs reveals large timing shifts at centromeres of endocycling cells in maize roots

Emily E Wear et al. PLoS Genet. .

Abstract

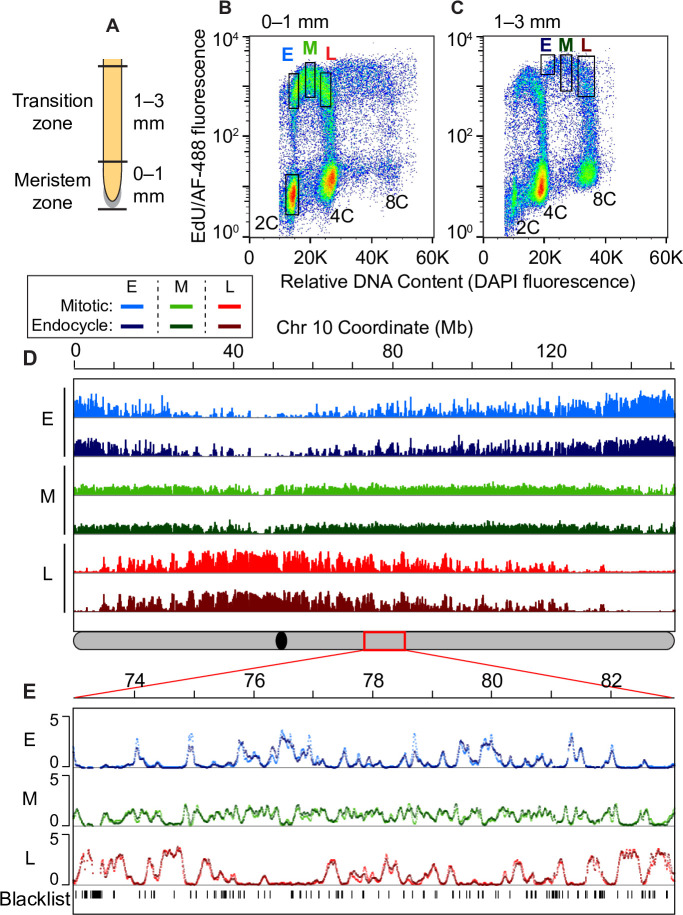
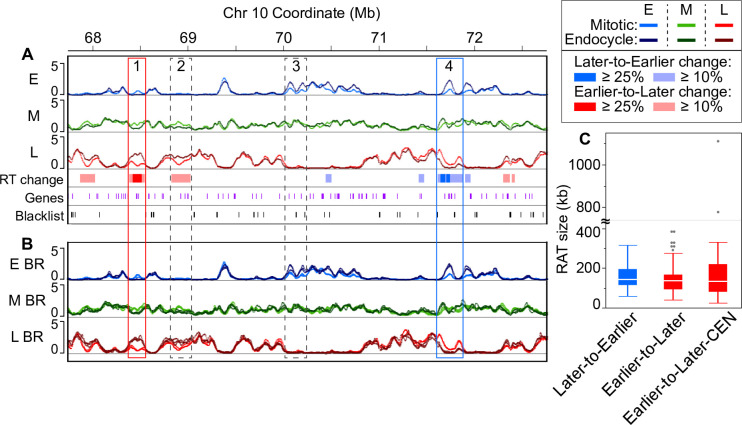
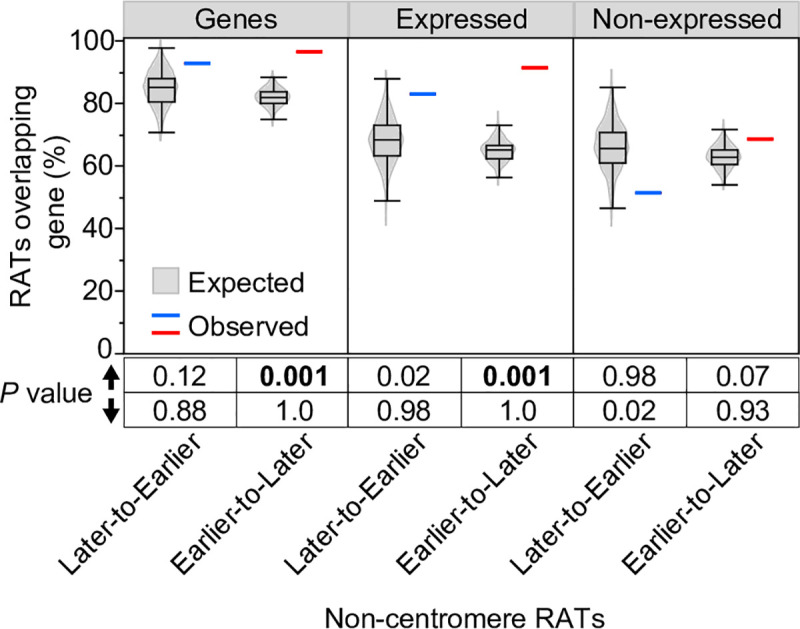
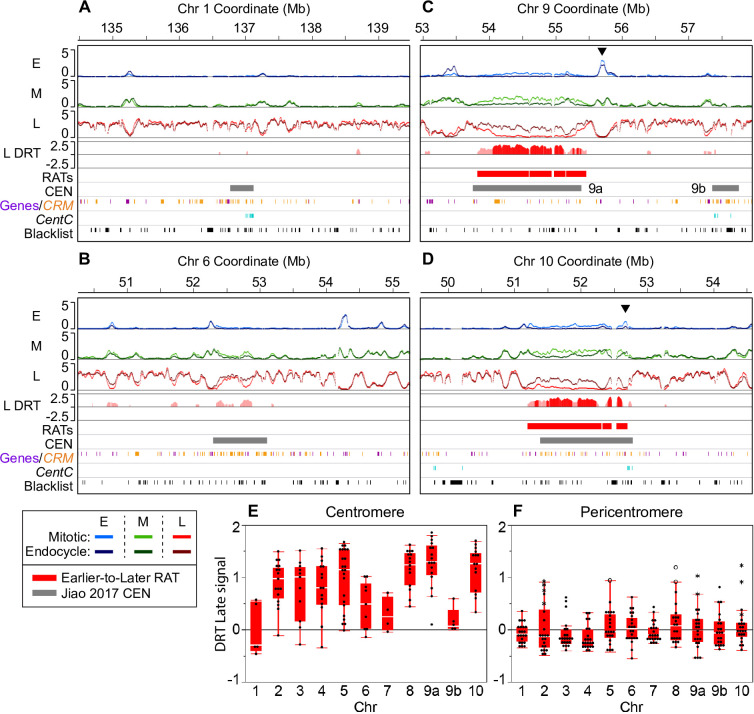
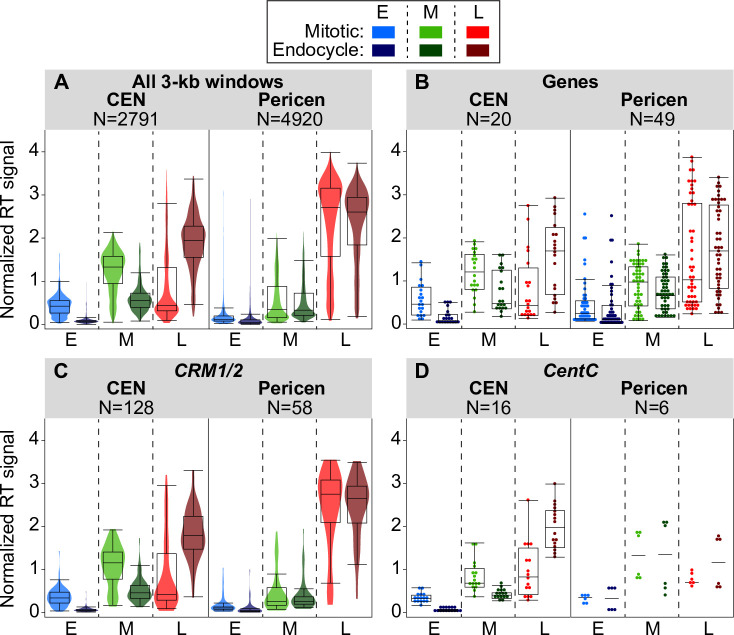
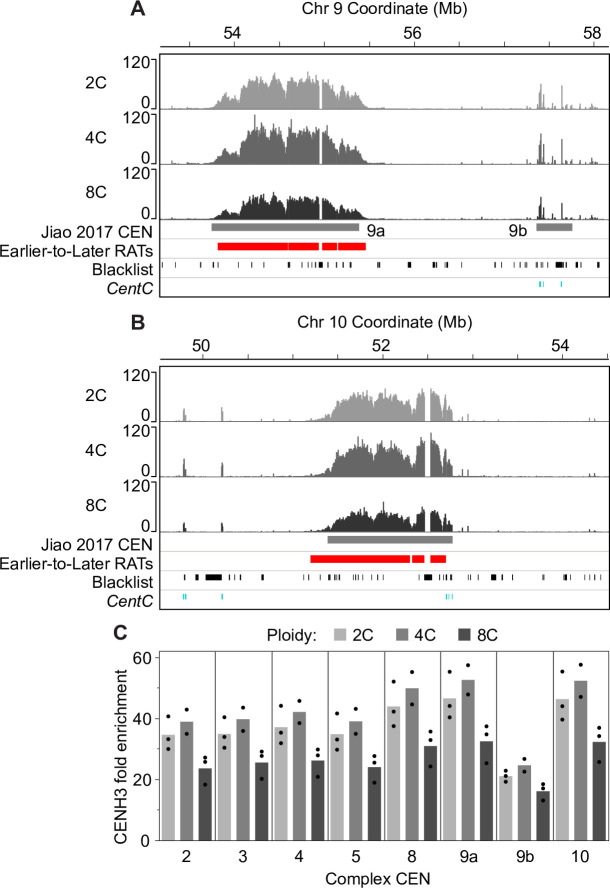
Plant cells undergo two types of cell cycles-the mitotic cycle in which DNA replication is coupled to mitosis, and the endocycle in which DNA replication occurs in the absence of cell division. To investigate DNA replication programs in these two types of cell cycles, we pulse labeled intact root tips of maize (Zea mays) with 5-ethynyl-2'-deoxyuridine (EdU) and used flow sorting of nuclei to examine DNA replication timing (RT) during the transition from a mitotic cycle to an endocycle. Comparison of the sequence-based RT profiles showed that most regions of the maize genome replicate at the same time during S phase in mitotic and endocycling cells, despite the need to replicate twice as much DNA in the endocycle and the fact that endocycling is typically associated with cell differentiation. However, regions collectively corresponding to 2% of the genome displayed significant changes in timing between the two types of cell cycles. The majority of these regions are small with a median size of 135 kb, shift to a later RT in the endocycle, and are enriched for genes expressed in the root tip. We found larger regions that shifted RT in centromeres of seven of the ten maize chromosomes. These regions covered the majority of the previously defined functional centromere, which ranged between 1 and 2 Mb in size in the reference genome. They replicate mainly during mid S phase in mitotic cells but primarily in late S phase of the endocycle. In contrast, the immediately adjacent pericentromere sequences are primarily late replicating in both cell cycles. Analysis of CENH3 enrichment levels in 8C vs 2C nuclei suggested that there is only a partial replacement of CENH3 nucleosomes after endocycle replication is complete. The shift to later replication of centromeres and possible reduction in CENH3 enrichment after endocycle replication is consistent with a hypothesis that centromeres are inactivated when their function is no longer needed.


Conflict of interest statement

The authors have declared that no competing interests exist.

Figures

Fig 1
Fig 1. Global comparison of mitotic cycle and endocycle replication timing programs.
(A) Schematic of a maize root showing the meristem zone (0–1 mm region) and transition zone (1–3 mm region) used for Repli-seq experiments. (B and C) Flow cytograms of nuclei isolated from the 0–1 mm root segments (B) and 1–3 mm root segments (C). Dots are pseudo-colored by density and black rectangles represent the sorting gates used to collect the pre-replicative 2C reference sample and early (E), mid (M) and late (L) S-phase fractions from either the mitotic cycle or endocycle. (D) Global scale view of replication timing (RT) for chromosome 10, comparing mitotic and endocycling profiles in early, mid and late S phase. Uniquely mapping reads were aggregated in 3-kb windows, normalized for sequencing depth, divided by the normalized 2C reference read counts, and Haar wavelet smoothed (see Methods). The global RT profiles for mitotic and endocycling cells are very similar to each other for all ten chromosomes. The schematic of chromosome 10 at the bottom shows the location of the centromere (black oval) and the 10 Mb region that is expanded in panel E (red rectangle). (E) Expanded view of a 10 Mb region on chromosome 10 with overlaid mitotic and endocycle RT profiles. Unmappable or multi-mapping regions (“blacklist”) were identified from the pre-replicative 2C reference sample and are indicated as tick marks in the bottom track. This example illustrates the similarity between the mitotic and endocycle RT profiles that is observed throughout most of the genome. Scale for all panels: 0–5 normalized replication signal.
Fig 2
Fig 2. Identifying regions of altered timing.
(A) An example region (5 Mb) on chromosome 10 containing two robust Regions of Altered Timing (RATs), indicated by boxes outlined with solid lines. The RAT in box 1 (red) shifts from Earlier-to-Later, and the RAT in box 4 (blue) shifts from Later-to-Earlier. Dashed boxes denote regions with some level of difference in RT (DRT) in which the magnitude of the difference did not meet our ≥ 25% criterion (box 2), or in which the change in one S-phase fraction was not compensated by an opposite change in at least one other S-phase fraction (box 3). Annotated genes (purple) and unmappable or multi-mapping regions (“blacklist”, black) are indicated as tick marks in the bottom tracks. (B) The same chromosome region as in (A) with the individual biological replicate RT profiles overlaid to demonstrate that RATs are not caused by local regions of technical variation between replicates. Scale for panels A and B: 0–5 normalized replication signal. (C) Boxplots representing the distribution of RAT sizes in the three categories: Later-to-Earlier, Earlier-to-Later, and a subset of Earlier-to-Later RATs found in functional centromeres (CEN) [46]. Boxplot whiskers represent 1.5 x interquartile range (IQR). The axis is broken to show two values that are much higher than the others and correspond to large RATs in CEN 9 and CEN 10. However, it is important to note that the sizes of CEN RATs are underestimated, because centromeres contain variable numbers and sizes of blacklist regions, which break up what would probably be long continuous RATs (see Fig 4 and Table 2).
Fig 3
Fig 3. Permutation analysis of the percentage overlap of non-CEN RATs and genes.
The percentage of RATs that overlap genes, expressed genes or non-expressed genes was calculated for non-CEN RATS and corresponding 1000 randomly shuffled sets (see Methods). The observed percentage for Later-to-Earlier (blue line) and Earlier-to-Later (red line) RATs are plotted alongside the expected percentage distribution of the 1000 random sets (grey violin plots overlaid with boxplots). Permutation P values below the graph were calculated from the proportion of the 1000 random sets that had a percent overlap value greater than (up arrow) or less than (down arrow) the observed value. Permutation P values ≤ 0.001 are considered evidence that the observed percent overlap is significantly different than random expectation.
Fig 4
Fig 4. Large RATs correspond to functional centromeres.
Our analysis found large RATs, sometimes broken by blacklist regions (black tick marks at the bottom of each panel) at each of the seven “complex” maize centromeres. The remaining three “simple” centromeres (on chromosomes 1, 6, and 7) showed various levels of DRT that did not meet the criteria for calling RATs in our initial analysis. (A–D) Each 5-Mb region shown contains early (E), mid (M) and late (L) RT profiles with mitotic and endocycle data overlaid (scale: 0–5 normalized replication signal). The difference in late replication signal (endocycle minus mitotic; labeled “L DRT”) for windows where the difference was compensated by an equal and opposite difference in the early and/or mid profiles is also shown. Late replication signal differences compensated at the ≥ 10% threshold (light red), and those compensated at the ≥ 25% threshold (dark red) are shown, but only regions that contained at least one ≥ 25% shift were classified as robust RATs in our initial analysis. Two examples of simple centromeres, CEN 1 (A) and CEN 6 (B), and two examples of complex centromeres, CEN 9 (C) and CEN 10 (D) are presented. The black arrowheads in panels C and D denote example regions with a peak of early replication signal within or adjacent to the centromere that also shows an increase in mid replication signal in the endocycle (for other examples, see S12 Fig). Colored boxes below the RT profiles denote Earlier-to-Later RATs (red) and the functional centromere (grey; [46]). Chromosome 9 contains two called CEN regions labeled 9a and 9b. The colored tick marks correspond to elements of centromeric retrotransposons of maize (CRM) families 1–4 (orange; [47]), gene annotations (purple; [46]), and mappable CentC satellite repeats (teal; [57]). Blacklist regions are indicated by black tick marks in the lowest track. (E and F) DRT (endocycle—mitotic) between late RT profiles for each centromere (E) and corresponding pericentromere (F; ± 1 Mb) were calculated in 100-kb static windows. In panel F, asterisks indicate DRT values from windows where an Earlier-to-Later-CEN RAT extends past the called CEN boundary [46] into the pericentromere (also see Table 2); open circles indicate windows that contain a non-CEN Earlier-to-Later RAT that met our compensation criteria. DRT values between early and mid profiles are shown in S13 Fig.
Fig 5
Fig 5. Comparing replication times for genomic features in complex centromeres and corresponding pericentromeres.
(A–D) Boxplots comparing replication signals during mitotic and endocycle S phases for centromeres, pericentromeres (± 1 Mb), and genomic features within them. The panels show the distributions of replication signals in early (E), mid (M), and late (L) S for all 3-kb windows (A), annotated genes (B), CRM1/2 elements (C), and mapped CentC repeats (D) in centromeres and pericentromeres. For panels A and C, colored violin plots are overlaid, while for panels B and D, individual data points are shown because of the smaller number of data points. The number of windows or elements included in each analysis is indicated above each graph. Only elements that covered at least 50% of a 3-kb window were included in each analysis, though results were similar when all elements were included (S14 Fig). Boxplots for all elements in simple centromeres, as well as for the individual CRM1 and CRM2 families are in S14 Fig.
Fig 6
Fig 6. CENH3 localization and enrichment in mitotic and endocycling centromeres.
We profiled CENH3 binding by ChIP-seq in flow sorted, non S-phase nuclei with 2C (before mitotic replication), 4C (after mitotic replication) and 8C (after endocycle replication) DNA contents. (A and B) CENH3 localization patterns for 2C, 4C and 8C nuclei in CEN 9a and 9b (A) and CEN 10 (B). Scale in both panels is 0–120 fold CENH3 enrichment relative to input. Colored boxes below the CENH3 profiles denote the previously identified functional centromere (grey; [46]), and Earlier-to-Later-CEN RATs (red). Tick marks in the bottom two tracks indicate blacklist regions (black) and mapped CentC repeats (teal). (C) We used the ChIP-seq datasets from 2C, 4C and 8C nuclei to estimate the CENH3 average fold enrichment relative to DNA content for complex centromeres by calculating the percent of total CENH3 reads found in a given centromere (using coordinates from [46] and dividing by the percent of total input reads corresponding to that centromere. Black dots represent the individual values from biological replicates. Data for simple centromeres are shown in S17B Fig.

Similar articles

Cited by

References

    1. Edgar BA, Zielke N, Gutierrez C. Endocycles: A recurrent evolutionary innovation for post-mitotic cell growth. Nat Rev Mol Cell Biol. 2014;15: 197–210. 10.1038/nrm3756 - DOI - PubMed
    1. Lee HO, Davidson JM, Duronio RJ. Endoreplication: Polyploidy with purpose. Genes Dev. 2009;23: 2461–2477. 10.1101/gad.1829209 - DOI - PMC - PubMed
    1. Fox DT, Duronio RJ. Endoreplication and polyploidy: Insights into development and disease. Development. 2013;140: 3–12. 10.1242/dev.080531 - DOI - PMC - PubMed
    1. Galbraith DW, Harkins KR, Knapp S. Systemic endopolyploidy in Arabidopsis thaliana. Plant Physiol. 1991;96: 985–989. 10.1104/pp.96.3.985 - DOI - PMC - PubMed
    1. Joubes J, Chevalier C. Endoreduplication in higher plants. Plant Mol Biol. 2000;43: 735–745. 10.1023/a:1006446417196 - DOI - PubMed

Publication types

MeSH terms