. 2020 Nov 2;219(11):e202006178.
doi: 10.1083/jcb.202006178.

ECM deposition is driven by caveolin-1-dependent regulation of exosomal biogenesis and cargo sorting

Affiliations

ECM deposition is driven by caveolin-1-dependent regulation of exosomal biogenesis and cargo sorting

Lucas Albacete-Albacete et al. J Cell Biol. .

Abstract

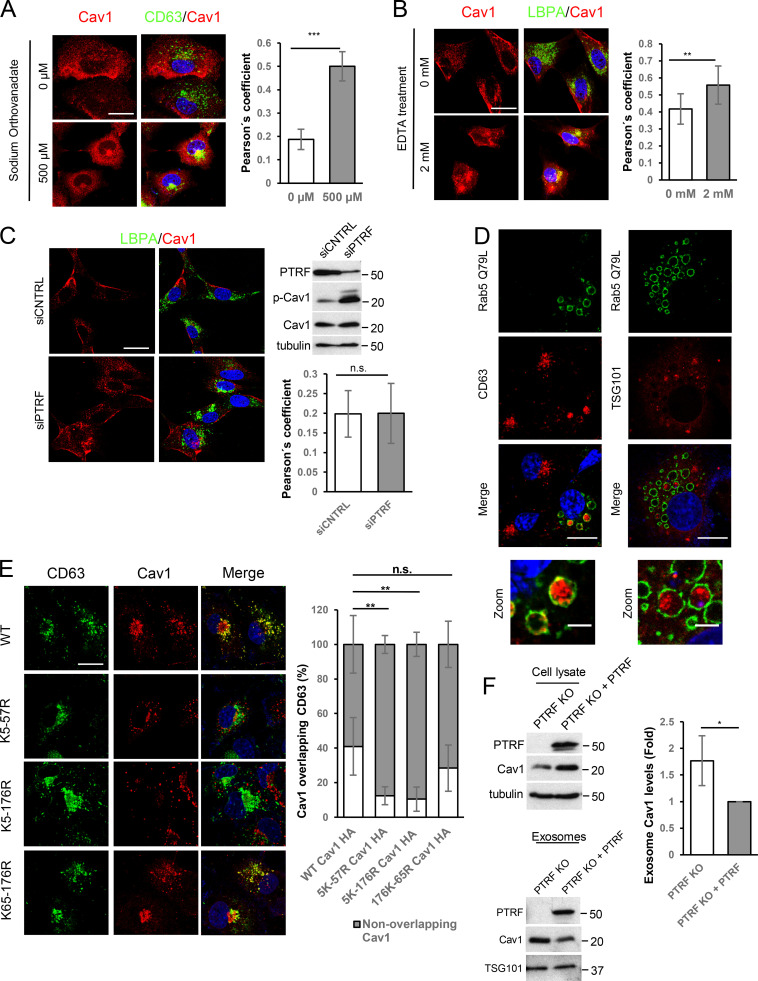
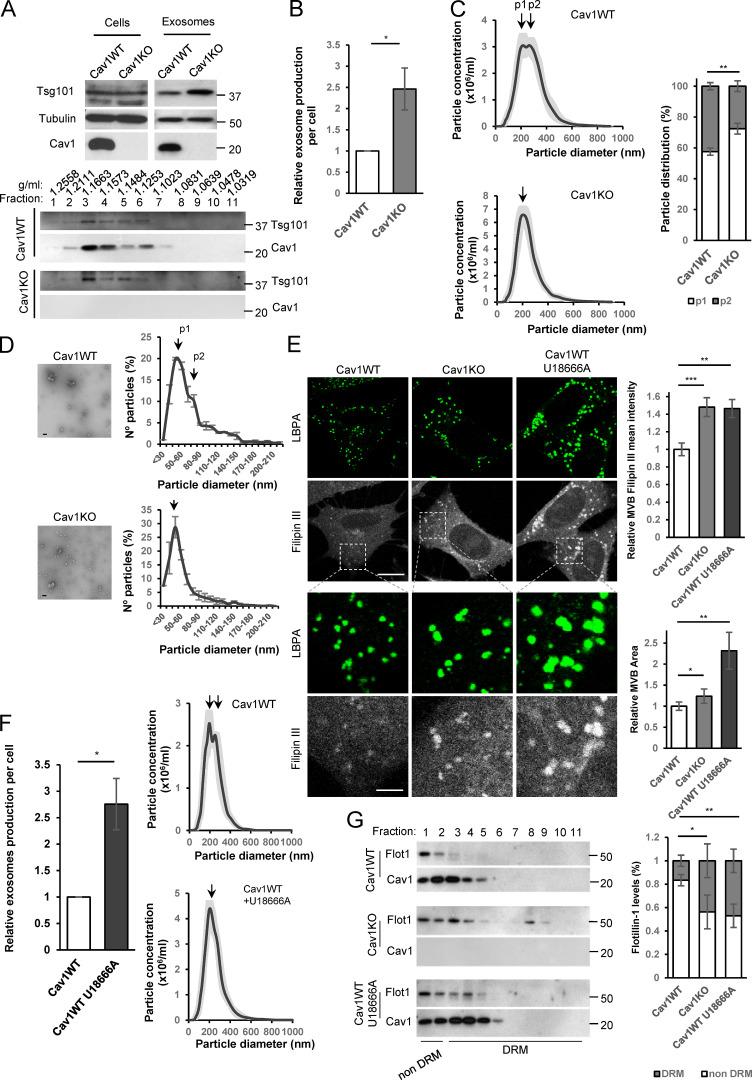
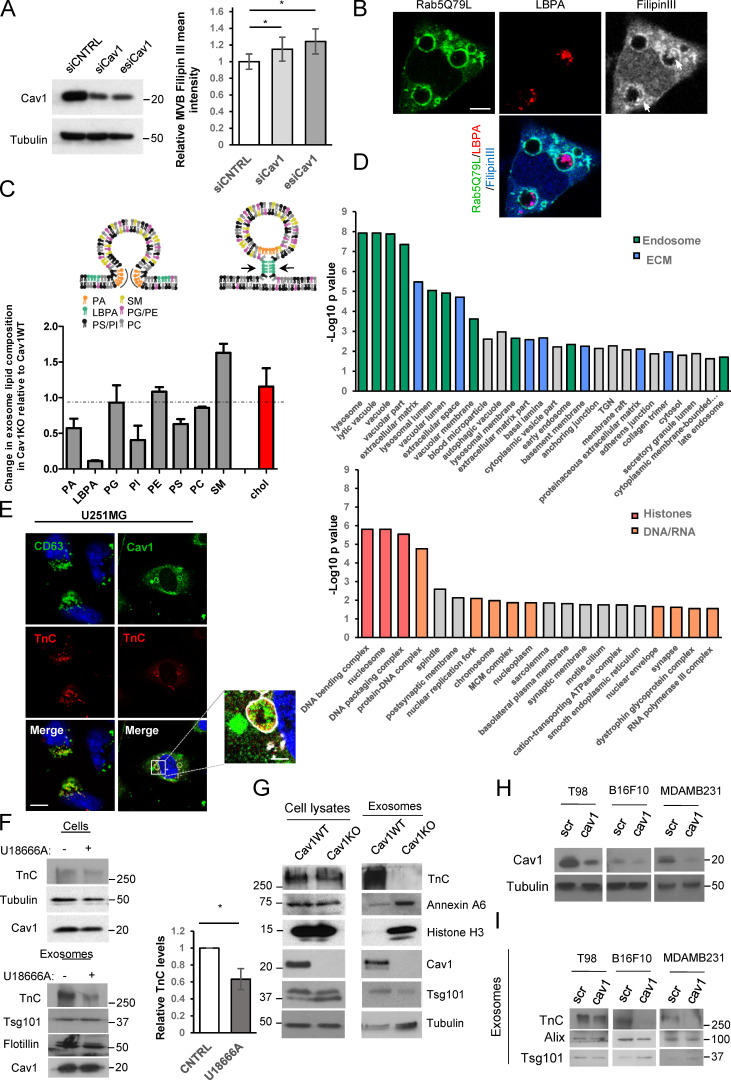
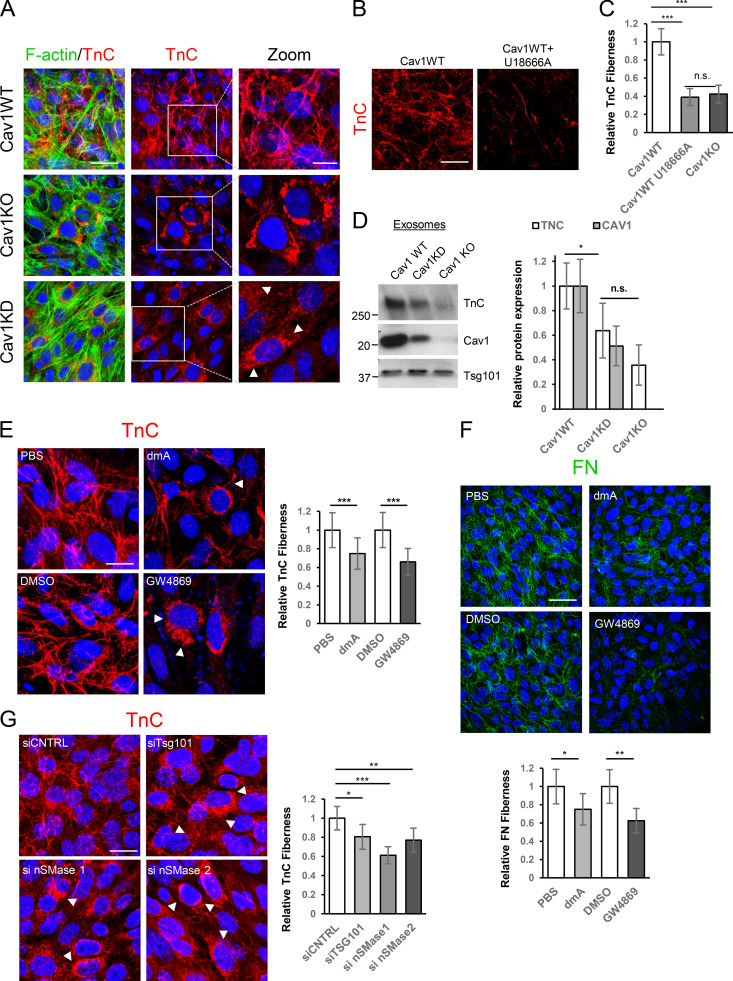
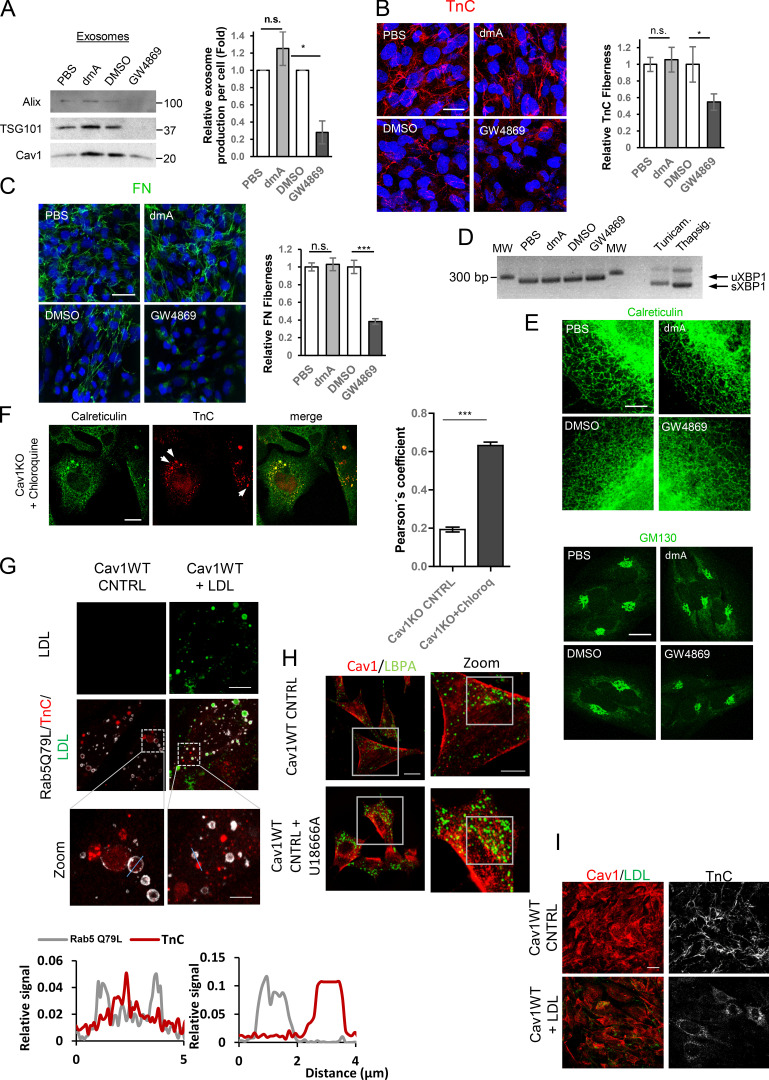
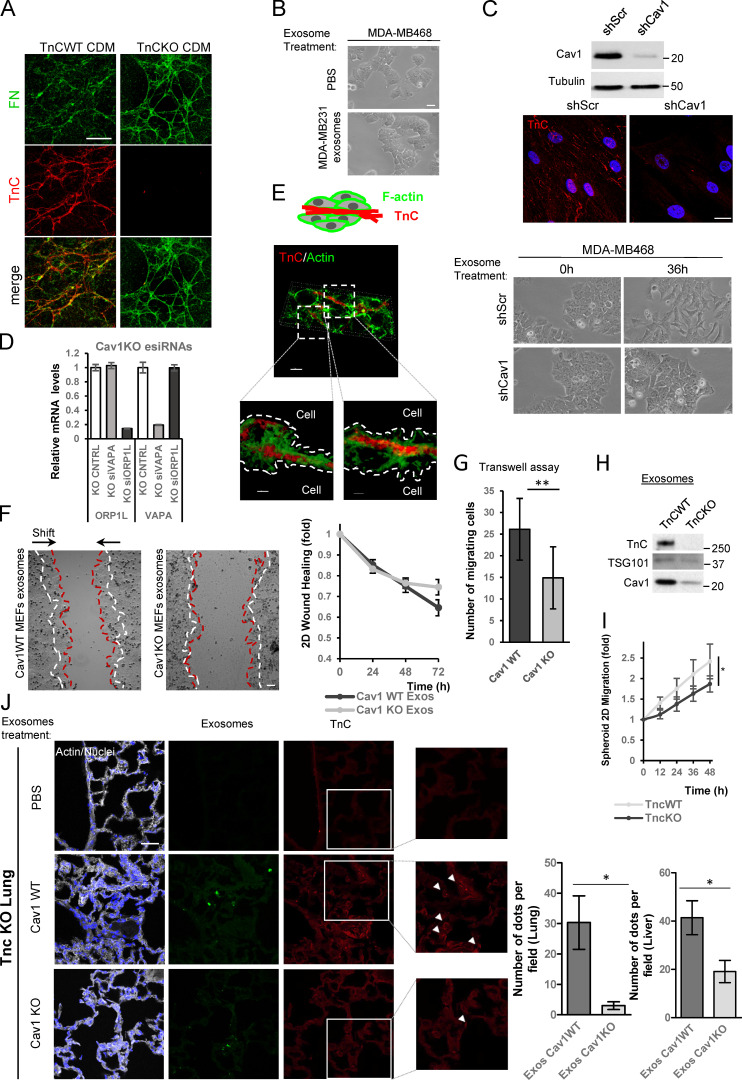
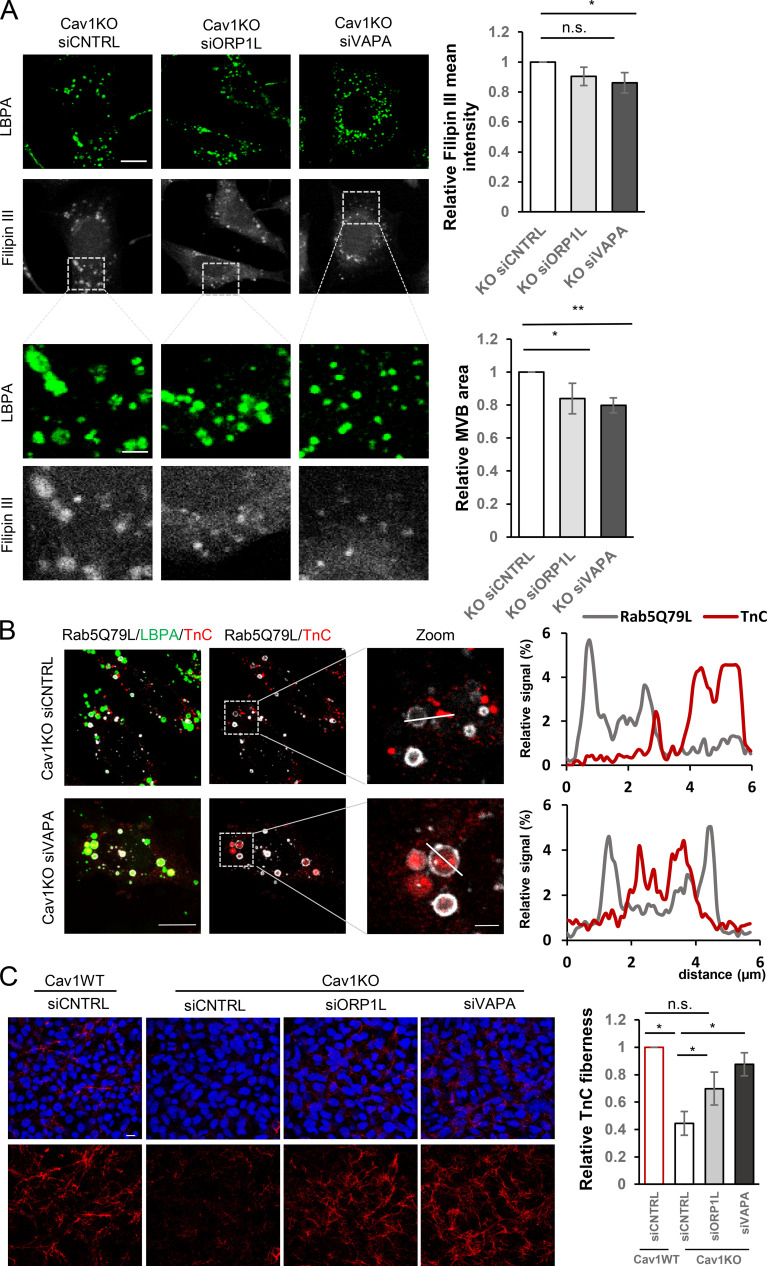
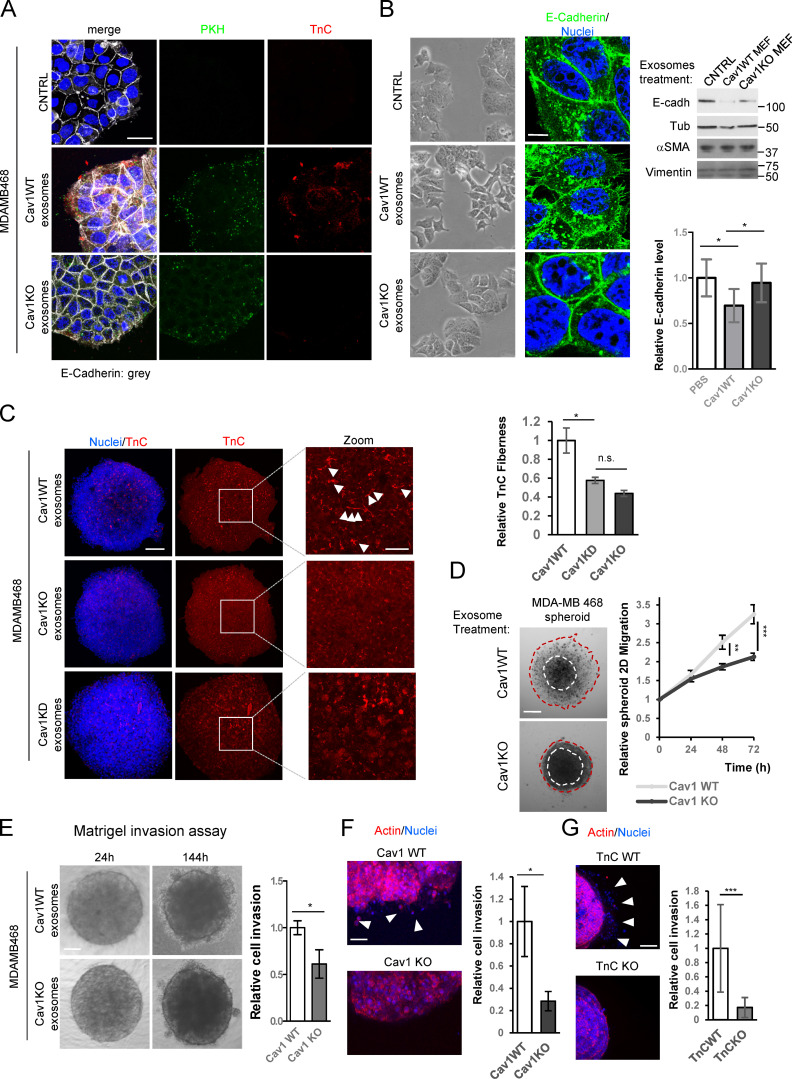
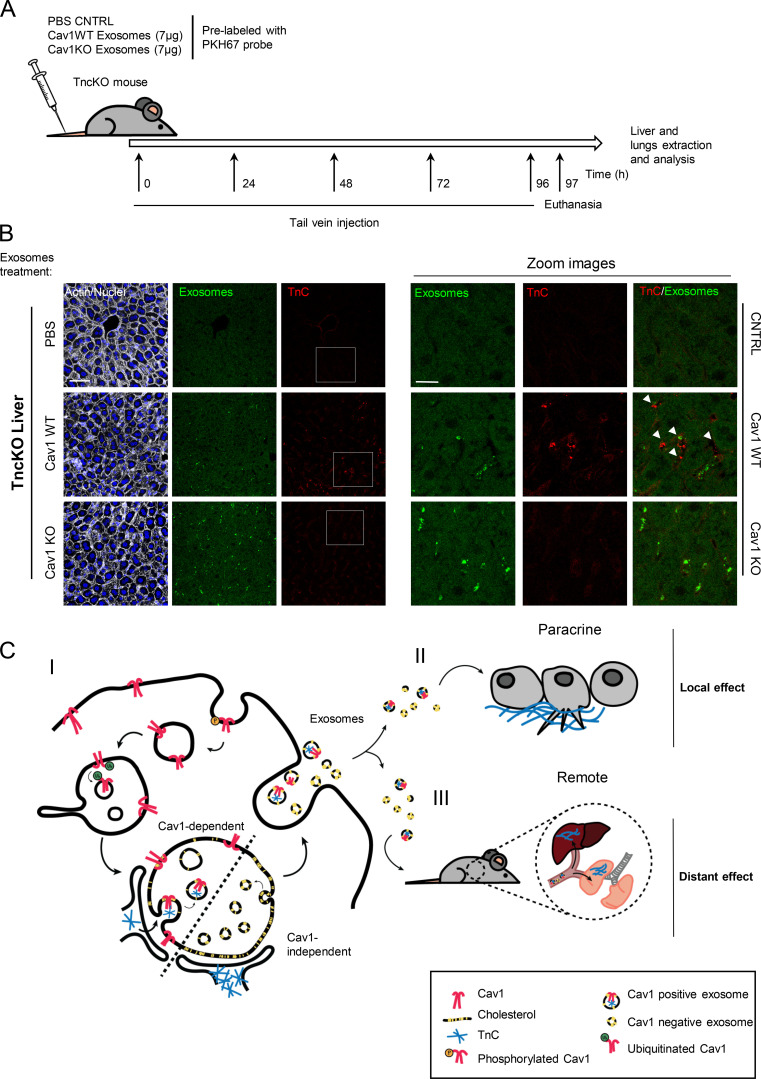
The composition and physical properties of the extracellular matrix (ECM) critically influence tumor progression, but the molecular mechanisms underlying ECM layering are poorly understood. Tumor-stroma interaction critically depends on cell communication mediated by exosomes, small vesicles generated within multivesicular bodies (MVBs). We show that caveolin-1 (Cav1) centrally regulates exosome biogenesis and exosomal protein cargo sorting through the control of cholesterol content at the endosomal compartment/MVBs. Quantitative proteomics profiling revealed that Cav1 is required for exosomal sorting of ECM protein cargo subsets, including Tenascin-C (TnC), and for fibroblast-derived exosomes to efficiently deposit ECM and promote tumor invasion. Cav1-driven exosomal ECM deposition not only promotes local stromal remodeling but also the generation of distant ECM-enriched stromal niches in vivo. Cav1 acts as a cholesterol rheostat in MVBs, determining sorting of ECM components into specific exosome pools and thus ECM deposition. This supports a model by which Cav1 is a central regulatory hub for tumor-stroma interactions through a novel exosome-dependent ECM deposition mechanism.


Figures

Figure 1.
Figure 1.
Internalized Cav1 is sorted to exosomes. (A) Confocal images of Cav1 (red) and LBPA (green) in WT MEFs after treatment with sodium orthovanadate (NaV; 2 h). White arrows: plasma membrane–localized Cav1. Gray arrows: Cav1 relocalized to perinuclear area (scale bar, 25 µm). Charts show Pearson´s correlation coefficient for Cav1-LBPA colocalization. Error bars: mean ± SD; n = 80 cells. Western blot: phospho-Cav1 (pCav1) and total Cav1 in sodium orthovanadate–treated cells. (B) Cav1-CD63 colocalization. Right panels show high-resolution images of an MVB compartment (scale bar, 1 µm). (C) Cav1 distribution in Rab5(Q79L)-expressing COS7 cells (scale bar, 10 µm). Right: zoomed view of an endosome (scale bar, 2.5 µm). (D) Top: cartoon of assayed Cav1 constructs. Ubiquitination-target lysine residues (Ub) and residues mutated to arginine (X) are indicated. Bottom: confocal analysis of COS7 cells transfected with Rab5(Q79L) (green) and indicated Cav1 constructs (scale bar, 10 µm). Chart: endosomal lumen localization of Cav1 variants (internal, INT; white) versus the endosomal membrane (peripheral, MEMB; gray), expressed as percentage of total endosomal localization. Error bars are mean ± SD; n > 20 endosomes. (E) Western blot analysis of sodium orthovanadate–induced phosphorylation in WT Cav1 (pCav1), ubiquitination-target lysine mutants, and nonphosphorylatable Y14F Cav1. (F) Cav1 inclusion in exosomes derived from fibroblasts (MEFs). Representative Western blots of exosomal proteins floated on a continuous sucrose gradient (0.25–2 M). Individual 1-ml fractions were collected and after protein precipitation were loaded on electrophoresis gels and analyzed for Cav1 and the exosome marker Tsg101. Red rectangles highlight fractions with detectable amounts of the exosome marker Tsg101 (3–7). (G) Western blot analysis of cell lysates and exosomes of COS7 cells expressing HA-tagged Cav1 ubiquitination mutants. CNTRL, control; n.s., not significant. For all graphs, *, P < 0.05; **, P < 0.01; ***, P < 0.001.
Figure S1.
Figure S1.
Internalization of Cav1 favors its entry into exosomes. (A) Colocalization analysis of Cav1 (red) and CD63 (green) in WT MEFs after 2-h treatment with sodium orthovanadate (scale bar, 25 µm). Chart shows colocalization between CD63 and Cav1 as measured by Pearson’s correlation coefficient (mean ± SD; n = 2, total 80 cells). (B) Colocalization analysis of Cav1 (red) and LBPA (green) after 10-min EDTA treatment (scale bar, 25 µm). Chart shows Pearson’s correlation coefficient of the colocalization between the two labels (mean ± SD; n = 2, total 80 cells). (C) Confocal microscopy of Cav1 (red) and LBPA (green) in PTRF-KD MEFs (scale bar, 25 µm). A representative Western blot of phosphorylated Cav1 is shown for PTRF-KD cells. Chart shows colocalization analysis as measured by Pearson’s correlation coefficient (mean ± SD; n = 2, total 40 cells). (D) Confocal analysis of COS7 cells transfected with Rab5(Q79L) (green) and the exosomal markers CD63 and Tsg101 (red; scale bar, 15 µm). Zoomed views show the intraluminal accumulation of both markers (scale bar, 5 µm). (E) Colocalization analysis of lysine-arginine Cav1 mutants (red) and CD63 (green; scale bar, 25 µm). Chart shows the percentage of labeled colocalization (mean ± SD; n = 3). (F) Western blot analysis of Cav1 in cell lysates and released exosomes of control and PTRF-reconstituted PTRFKO cells. Tubulin and Tsg101 were used as loading controls. Chart shows Cav1 levels in exosomes produced by either control or PTRF-reconstituted PTRFKO cells (mean ± SD; n = 4). CNTRL, control; n.s., not significant. For all graphs, *, P < 0.05; **, P < 0.01; ***, P < 0.001.
Figure 2.
Figure 2.
Cav1 regulates exosome biogenesis by modulating MVB cholesterol content. (A–G) Exosomes were isolated from supernatants of Cav1WT and Cav1KO fibroblast cultures. (A) Top: Western blots for indicated proteins in exosomes derived from equal cell numbers. Bottom: Western blots showing the distribution of Cav1 and Tsg101 in exosomes floated on a continuous sucrose gradient. (B) Quantification of exosome particles relative to cell number. Error bar are means ± SD; n = 10. (C) Left: Nanosight distribution profiles of exosome preparations from WT and Cav1KO fibroblasts, showing greater morphological and size heterogeneity of WT-derived exosomes. Right: Quantification of the two exosome populations identified in WT and Cav1KO fibroblasts. Error bars are mean ± SEM; n = 10. (D) Representative TEMs of WT and Cav1KO exosomes (scale bar, 200 nm). Distribution profiles measured from TEMs of WT and Cav1KO fibroblast-derived exosomes. (E) Filipin staining (gray) and LBPA (green) of WT, Cav1KO, and U18666A-treated Cav1WT fibroblasts (scale bar, 20 µm). Lower panel rows show zoomed views (scale bar, 6 µm). Charts on the right show quantitative analysis of filipin mean fluorescence intensity in MVBs (upper) and total MVB area (lower). Error bar are means ± SD; n = 3. (F) Exosome production per cell. Error bars are means ± SD; n = 4 (left) and Nanosight distribution profiles of exosome preparations (right) from WT fibroblasts without treatment (control) and treated with U18666A. (G) Western blots of sucrose density gradient fractions in the presence of TritonX-100 of exosomes produced by untreated WT and Cav1KO fibroblasts and U18666A-treated WT fibroblasts. The chart shows the proportion of flotillin (Flot1) in detergent-resistant and nonresistant membranes (DRM). Error bars are mean ± SD; n = 3. For all graphs, *, P < 0.05; **, P < 0.01; ***, P < 0.001.
Figure 3.
Figure 3.
Cav1 specifies protein cargo into exosomes. (A) Representation of hierarchical analysis of proteins equally expressed in the two parental cell populations (cell lysates, shaded in yellow) and differentially expressed in exosomes. Blue: proteins up-regulated in WT exosomes; red: proteins up-regulated in Cav1KO exosomes. Graphics on the right show STRING network analysis. Top: interactions among identified proteins up-regulated in Cav1WT MEF-derived exosomes. Highlighted groups are related to ECM components (blue) and extracellular vesicle/exosome biogenesis and lysosome components (green). Bottom: interactions among identified proteins up-regulated in Cav1KO MEF-derived exosomes. Highlighted groups are related to histones (red) and DNA/RNA binding (orange). (B) Clustered heatmap of extracellular proteins with significant changes in ECM protein abundance between exosomes produced by WT and Cav1KO fibroblasts (top) or in histone-related proteins (bottom). (C) Heatmap comparing annexin isoform enrichment in exosomes produced by Cav1KO and WT fibroblasts. (D) Western blot analysis showing the distribution of Cav1 and some of the proteins identified by quantitative proteomics in WT and Cav1KO-derived exosomes floated on an Optiprep (iodixanol) density gradient. Tsg101, Alix, and flotillin-1 were used as exosomal markers, and GM130 was included as a negative control.
Figure S2.
Figure S2.
Cav1-positive exosomes display a specific lipid/protein composition. (A) Western blot confirming Cav1KD in WT MEFs. Chart shows filipin III mean fluorescence intensity at MVBs of WT MEFs transfected with either control (siCNTRL, silencing RNA duplex control) or Cav1-targeting siRNAs (siCav1, siRNA duplex targeting Cav1; esiCav1, enzymatically prepared siRNAs targeting Cav1; mean ± SD; n = 4). (B) Distribution of LBPA (red) and filipin III (grey and blue) in Rab5(Q79L)-expressing MEFs (green). Arrows indicate LBPA and filipin III colocalization at ILVs (scale bar, 5 µm). (C) Upper panel: lipids involved in exosome biogenesis are summarized in the scheme (adapted from Subra et al., 2007). Lower panel: MS analysis of lipid composition profiles of Cav1KO MEF-derived exosomes compared with WT-derived exosomes. Values denote relative content in Cav1KO-derived exosomes as normalized to the relative content measured in WT exosomes for each lipid class (mean ± SD; n = 2 for determination of all lipid species except for cholesterol; for cholesterol determination, n = 3). PA, phosphatidic acid; SM, sphingomyelin; PG, phosphatidylglycerol; PI, phosphatidylinositol; PC, phosphatidylcholine; PE, phosphatidylethanolamine. (D) Enrichr diagram of “cellular component” category for proteins upregulated in either WT MEF–derived exosomes (top) or Cav1KO MEF–derived exosomes (bottom). MCM complex, minichromosome maintenance protein complex. (E) Colocalization analysis of TnC (red) with CD63 or Cav1 (green) in U251 glioblastoma cells expressing Rab5(Q79L) (white; scale bar, 25 µm; zoomed view scale bar, 2.5 µm). (F) Western blot analysis of TnC in cell lysates and released exosomes of untreated or U18666A-treated WT MEFs. Tsg101 was used as exosome loading control. Chart shows the relative amount of TnC in exosomes produced by WT control and U18666A-treated cells (mean ± SD; n = 4). (G) Western blot analysis confirming protein expression changes identified by quantitative proteomics in WT fibroblast lysates and purified exosomes compared with Cav1KO counterparts. (H) Validation of lentivirus-mediated KD (scr, scrambled control sequence; Cav1, Cav1-targeting shRNA) of Cav1 mRNA across tumor cell lines (T98: glioblastoma; B16F10: melanoma; MDAMB231: breast cancer). (I) Western blot analysis of TnC secretion in exosomes produced by the different tumor cell lines described in H. Tsg101 and Alix were used as exosomal markers. CNTRL, control. For all graphs, *, P < 0.05; **, P < 0.01; ***, P < 0.001.
Figure S3.
Figure S3.
Exosome inhibition favors intracellular TnC accumulation. (A) Western blot analysis (left) and quantification of exosome particle production per cell (right graph) showing reduced exosome secretion by WT fibroblasts after treatment with dmA or GW4869 (mean ± SEM; n = 3). (B) Pipeline of the fiberness macro (see Materials and methods). The original image, a, is first preprocessed (b), and nearly unidimensional tubular structures are enhanced to obtain an image for fiberness scoring (c). M0 measures the mean fiberness score in the whole image. a′ and c′ show magnifications of indicated region (red box) in panels a and c. (C) Representative Western blot and quantification (mean ± SEM; n = 9) showing the effect of indicated small-compound inhibitors on intracellular TnC accumulation. (D) Assessment of ER stress in WT MEFs treated with exosome secretion inhibitors dmA and GW4689. Upper panel:agarose gel for RT-PCR XBP1 mRNA splicing analysis. sXBP1, spliced mRNA species; uXBP1, unspliced mRNA species; Thapsig., Thapsigargin; Tunicam., Tunicamycin. Lower panel: quantitative (q) RT-PCR assessment of CHOP mRNA expression across indicated treatments. (E) Confocal microscopy analysis of Golgi (in green) labeled with GM130 in WT MEFs treated with exosome secretion inhibitors dmA and GW4689 (scale bar, 15 µm). (F and G) qRT-PCR assessment of KD efficiency of indicated siRNA treatments in WT fibroblasts (F) and Western blot (G). (H) Representative Western blot and quantification (mean ± SEM; n = 9) showing the effect of siRNA targeting Tsg101 and nSMase1 and 2 on intracellular TnC accumulation. (I) Representative Western blot of FN and pentraxin across both lysates and purified exosomes from WT and Cav1KO fibroblasts. (J) Representative Z-stack projection confocal microscopy images showing the effect of siRNAs targeting Tsg101 and nSMase1 and 2 on MEF FN matrix deposition (green; scale bar, 50 µm; mean ± SEM; n = 5). (K) FN deposition of WT MEFs treated with U18666A, as determined by Z-stack projection confocal microscopy (scale bar, 40 µm). Chart shows extracellular FN deposition in fibers produced by either untreated or U18666A-treated WT MEFs, as measured using custom software (mean ± SD; n = 8). (L) Depiction of an MCS between the endosomal compartment and the ER. Pairs of proteins described as key players for tethering and cholesterol transfer are indicated by dashed lines. Yellow arrows indicate the direction of cholesterol transfer as regulated by each tethering complex. From the ER toward the endosomes (box I) or from the endosomes to the ER (box II). n.s., not significant. For all graphs, *, P < 0.05; **, P < 0.01; ***, P < 0.001.
Figure 4.
Figure 4.
Exosome-mediated ECM deposition is a Cav1-dependent process. (A) Z-stack projection of confocal images showing TnC (red) in matrix deposited by WT, Cav1KD, and Cav1KO MEFs. F-actin is shown in green (scale bar, 40 µm). Zoomed views reveal an absence of TnC matrix deposition and a corresponding increased intracellular accumulation (white arrowheads) in Cav1KD and Cav1KO MEFs (scale bar, 10 µm). (B) TnC deposition of WT MEFs treated with U18666A determined by Z-stack projection confocal microscopy (scale bar, 40 µm). (C) Extracellular TnC deposition in fibers produced by Cav1WT, Cav1KO, and U18666A-treated Cav1WT MEFs (mean ± SD; n = 8). (D) Western blot analysis of TnC expression in exosomes secreted by indicated genotypes. Quantification: mean ± SEM; n = 6. (E) Effect of 5-d exposure to the exosome inhibitors dmA (75 nM) and GW4869 (10 µM) on TnC matrix deposition (red) by WT MEFs (scale bar, 20 µm). Right: chart shows extracellular TnC fiber deposition (mean ± SEM; n = 12). (F) Z-stack of confocal images showing the effect of 5-d exposure to dmA (75 nM) and GW4869 (10 µM) on FN matrix deposition (green) by WT MEFs (scale bar, 50 µm). Bottom: chart shows extracellular FN fiber deposition (mean ± SEM; n = 5). (G) Representative Z-stack projection of confocal images showing the effect of siRNAs targeting Tsg101 and neutral nSMase1 and 2 on TnC matrix deposition by WT MEFs (red; scale bar, 20 µm). The chart to the right shows extracellular TnC deposition in fibers measured as in C (mean ± SEM; n = 6). n.s., not significant. For all graphs, *, P < 0.05; **, P < 0.01; ***, P < 0.001.
Figure S4.
Figure S4.
Exosomes derived from CAFs modulate ECM deposition. (A) Western blot analysis (left) and exosome particle production per cell (right) show reduced exosome secretion by CAFs after treatment with dmA or GW4869 (mean ± SD; n = 3). (B and C) Representative Z-stack projection confocal microscopy images showing the effect of exosome inhibitor drugs (dmA and GW4689) on CAF TnC matrix deposition (B; scale bar, 20 µm; mean ± SEM; n = 5) and CAF FN matrix deposition (C; mean ± SEM; n = 5; scale bar, 50 µm). (D) ER stress was assessed by analysis of XBP1 mRNA splicing in CAFs treated with inhibitors of exosome biogenesis (dmA or GW4869). sXBP1, spliced mRNA species; uXBP1, unspliced mRNA species; Thapsig., Thapsigargin; Tunicam., Tunicamycin. (E) Confocal microscopy assessment of ER (immunolabeled for calreticulin; left panels; scale bar, 5 µm) and Golgi subcellular distribution (immunolabeled for GM130; right panels; scale bar, 20 µm) in CAFs treated with either dmA or GW4869. (F) Confocal microscopy showing accumulation of TnC (red; white arrows) within the ER (green) in chloroquine-treated Cav1KO MEFs (scale bar, 20 µm). Chart shows Pearson’s correlation coefficient for colocalization between TnC and calreticulin in Cav1KO cells across indicated conditions (mean ± SD; n = 3). (G) Impact of exogenous supplementation of Alexa Fluor 647–LDLs (in green) on TnC distribution (in red) in WT MEFs overexpressing Rab5(Q79L) mutant (in grey). Scale bar, 20 µm. Zoomed views show intraluminal accumulation of TnC upon treatment (scale bar, 5 µm). Histogram shows pixel intensities for Rab5(Q79L) (grey) and TnC (red) along the lines indicated on the images. (H) Confocal microscopy analysis of Cav1 distribution in U18666A-treated WT fibroblasts (scale bar, 20 µm). Zoomed images (scale bar, 10 µm). (I) Z-stack projection of confocal microscopy images show TnC (red) in matrices deposited by WT fibroblasts treated with LDLs (scale bar, 20 µm). CNTRL, control; n.s., not significant. For all graphs, *, P < 0.05; **, P < 0.01; ***, P < 0.001.
Figure 5.
Figure 5.
Exosomal incorporation of TnC occurs intracellularly via the ER-MVB route. (A) Left: Western blot analysis of TnC and FN expression in lysates from TnCWT and TnCKO fibroblasts. Right: CDMs were generated from TnCWT and TnCKO cells as described in Materials and methods, and TnCWT and TnCKO cells were plated on these CDMs for further 24 h as depicted. CDMs were labeled with TnC (in red), and the plated cells were stained with F-actin (in gray; scale bar, 50 µm). (B) Western blot analysis of TnC and FN in total lysates (CDM + plated cells) and cells plated on CDM and isolated by trypsinization. Tubulin was used as a loading control. Cells were cultured on decellularized CDMs for 24 h prior to analysis. (C) Interaction assay of purified exosomes with TnC-rich or TnCKO CDMs. The scheme shows the assay protocol. Western blot shows analysis of TnC and FN binding to exosomes. (D) Subcellular fractionation analysis of intracellular TnC distribution in WT (treated with either vehicle or GW4869) and Cav1KO cells, using indicated markers. The boxed area denotes MVB-enriched fractions. Plots show the relative amount of TnC in each fraction with respect to the total TnC (normalized to 1) present in MVB-enriched fractions across conditions (mean ± SD; n = 3). (E) Colocalization between TnC (red) and calreticulin (green) was analyzed in Cav1WT MEFs treated with GW4869 alone or in combination with the lysosomal inhibitor chloroquine (scale bar, 50 µm; zoomed views scale bar, 20 µm). Chart shows Pearson´s correlation coefficient for colocalization TnC and calreticulin (mean ± SD; n = 3). CNTRL, control. *, P < 0.05; **, P < 0.01; ***, P < 0.001.
Figure S5.
Figure S5.
Disruption of ER-MVB contact sites modulates TnC matrix deposition. (A) Representative confocal microscopy of either WT or TnCKO CDMs showing FN (green) and TnC (red; scale bar, 20 µm). (B) Phase-contrast microscopy showing morphological changes in MDA-MB468 cells 36 h after exposure to MDA-MB231–derived exosomes (scale bar, 10 µm). (C) Top:Western blot analysis of Cav1KD efficiency in CCD-1069S CAFs. Middle: Z-stack projection of confocal microscopy images showing TnC (red) in matrix deposited by CAFs stably expressing either scrambled shRNA (shScr) or Cav1-targeting shRNA (shCav1; scale bar, 40 µm). Bottom:Phase-contrast microscopy showing morphological changes in MDA-MB468 cells 36 h after exposure to exosomes derived from either shScr or shCav1 CAFs (scale bar, 10 µm). (D) Quantitative RT-PCR assessment of VAPA and ORP1L mRNA KD efficiency in Cav1KO fibroblasts. (E) Top: Graphical scheme. Bottom: 3D reconstruction of TnC fibers deposited by exosomes produced by WT MEFs. (F) Wound closure assays performed with MDA-MB468 cells treated with fibroblast-derived WT and Cav1KO exosomes. The graph plots relative wound area (n = 6). (G) Number of invasive MDA-MB468 cells in transwell assays after exposure to exosomes derived from WT or Cav1KO fibroblasts (mean ± SD; n = 3). (H) Representative Western blot analysis of WT and TnCKO MEF-derived exosomes. (I) Phase-contrast microscopy of MDA-MB468 migration in spheroids generated in the presence of either WT or TnCKO MEF-derived exosomes over 72 h. Graph shows quantitative analysis of spheroid migration (mean ± SEM; n = 11). (J) Immunofluorescence microscopy of lung sections from TnCKO mice injected in the tail vein with WT or Cav1KO fibroblast-derived exosomes. Control mice were injected with PBS. Exosome foci are green. White arrowheads indicate regions of TnC deposition (red). Immunofluorescence images are representative of seven random fields from two independent experiments. The charts show exosome foci accumulation in liver and in lungs after WT or Cav1KO exosome injection. CNTRL, control. For all graphs, *, P < 0.05; **, P < 0.01; ***, P < 0.001.
Figure 6.
Figure 6.
Cholesterol modulation at endosomal compartment/MVBs controls exosome-mediated TnC deposition. (A) Disruption of cholesterol transfer from the ER to the endosomes upon knocking down VAPA or ORP1L tethers in Cav1KO MEFs attenuates cholesterol accumulation as assessed by filipin (grayscale) and LBPA (green) staining (scale bar, 20 µm). Lower panel rows show zoomed thumbnails of the indicated regions of interest (scale bar, 6 µm). Charts on the right show quantitative analysis of filipin mean fluorescence intensity in MVBs (upper) and total MVB area (lower). Error bar are means ± SD; n = 3. (B) Confocal analysis of TnC distribution (in red) and LBPA (in green) in VAPA-depleted Cav1KO MEFs electroporated with Rab5(Q79L) (gray; scale bar, 10 µm). Rightmost panels show zoomed views of endosomes/MVBs (scale bar, 5 µm). Plots show pixel intensities for Rab5(Q79L) (gray) and TnC (red) along the indicated lines. (C) Z-stack projection of confocal images showing the effect on TnC fiber deposition (red) upon RNAi-mediated depletion for VAPA and ORP1L (scale bar, 10 µm). The chart shows extracellular TnC fiber deposition by either WT or Cav1KO MEFs upon depletion of indicated tethers (mean ± SEM; n = 3). n.s., not significant. For all graphs, *, P < 0.05; **, P < 0.01; ***, P < 0.001.
Figure 7.
Figure 7.
TnC deposition mediated by exosomes promotes tumor cell invasiveness. (A–G) MDA-MB468 breast tumor cells were incubated with PKH67-labeled exosomes derived from WT or Cav1KO MEFs or with PBS (control). (A) Microscopy images of exosome (green) uptake by MDA-MB468 cells and deposition of exosome-delivered TnC (red) in areas surrounding tumor cells. Scale bar, 30 µm. (B) Phenotypic changes in MDA-MB468 cells 36 h after exposure to fibroblast-derived WT and Cav1KO exosomes. Cells were stained for the epithelial-mesenchymal transition marker E-cadherin; nuclei were stained with Hoechst. Zoomed images show E-cadherin redistribution from cell-cell contact sites to intracellular compartments (scale bar, 10 µm). E-cadherin and other epithelial-mesenchymal transition markers were determined by Western blot. Chart shows the changes in E-cadherin upon treatment with PBS (CNTRL), WT, or Cav1KO exosomes (mean ± SD; n = 3). (C) Z-stack confocal images of TnC deposition (red) within 3D MDA-MB468 spheroids generated in the presence of WT, Cav1KO, or Cav1KD exosomes. Nuclei are stained with Hoechst (blue; scale bar, 150 µm). Zoomed images show a clear distribution of TnC deposits (scale bar, 50 µm). White arrowheads: TnC fibers. Right: chart shows extracellular TnC fiber deposition (mean ± SEM; n = 3). (D) Phase-contrast image of MDA-MB468 spheroid migration (scale bar, 175 µm). Spheroids were generated in the presence of the indicated exosomes and cultured for 72 h. Graph shows quantitative analysis of spheroid migration (mean ± SEM; n = 11). (E and F) Invasiveness of MDA-MB468 spheroids generated in the presence of fibroblast-derived WT or Cav1KO exosomes. Invasiveness was assessed in Matrigel (E; phase-contrast microscopy and quantified; mean ± SEM; n = 26 spheroids per condition; scale bar, 150 µm) or collagen type I gel (F; immunofluorescence; arrowheads indicate areas of cell invasion; mean ± SEM; n = 24 spheroids per condition; scale bar, 100 µm). (G) Invasiveness of MDA-MB468 spheroids generated in the presence of fibroblast-derived TnCWT and TnCKO exosomes. Arrowheads indicate areas of cell invasion. The chart shows quantification of MDA-MB468 spheroid invasiveness into collagen (mean ± SD; n = 15 spheroids per condition; scale bar, 150 µm). CNTRL, control; n.s., not significant. For all graphs, *, P < 0.05; **, P < 0.01; ***, P < 0.001.
Figure 8.
Figure 8.
Cav1-loaded fibroblast-derived exosomes deposit TnC in vivo in a tissue-specific manner. (A) Treatment protocol. (B) Fluorescence microscopy of liver sections from mice injected in the tail vein with Cav1WT or Cav1KO fibroblast-derived exosomes or with PBS (scale bar, 60 µm; zoomed views, scale bar, 30 µm). Exosome foci are green. White arrowheads indicate regions of TnC deposition. All images are representative of nine random fields from two independent experiments. (C) Proposed role of Cav1 in exosome-mediated ECM deposition. (C I) Endocytosed Cav1 enters the MVB compartment, where it promotes exosome heterogeneity in size and composition, favoring the entry of specific ECM components. (C II) Cav1WT fibroblast-derived exosomes stimulate protrusive activity and motility of breast cancer cells by nucleating local ECM (TnC) deposition in areas surrounding the tumor cells. (C III) Cav1WT fibroblast-derived exosomes also generate ECM-rich deposits at long distances from their source in vivo, generating sites of possible future metastasis.

Similar articles

Cited by

References

    1. Augsten M., Sjöberg E., Frings O., Vorrink S.U., Frijhoff J., Olsson E., Borg Å., and Östman A.. 2014. Cancer-associated fibroblasts expressing CXCL14 rely upon NOS1-derived nitric oxide signaling for their tumor-supporting properties. Cancer Res. 74:2999–3010. 10.1158/0008-5472.CAN-13-2740 - DOI - PubMed
    1. Axelsen P.H., and Murphy R.C.. 2010. Quantitative analysis of phospholipids containing arachidonate and docosahexaenoate chains in microdissected regions of mouse brain. J. Lipid Res. 51:660–671. 10.1194/jlr.D001750 - DOI - PMC - PubMed
    1. Babst M. 2011. MVB vesicle formation: ESCRT-dependent, ESCRT-independent and everything in between. Curr. Opin. Cell Biol. 23:452–457. 10.1016/j.ceb.2011.04.008 - DOI - PMC - PubMed
    1. Beacham D.A., Amatangelo M.D., and Cukierman E.. 2007. Preparation of extracellular matrices produced by cultured and primary fibroblasts. Curr. Protoc. Cell Biol. Chapter 10:Unit 10.9 - PubMed
    1. Bligh E.G., and Dyer W.J.. 1959. A rapid method of total lipid extraction and purification. Can. J. Biochem. Physiol. 37:911–917. 10.1139/o59-099 - DOI - PubMed

Publication types