. 2020 Oct 13;53(4):878-894.e7.
doi: 10.1016/j.immuni.2020.09.015.

Second-Strand Synthesis-Based Massively Parallel scRNA-Seq Reveals Cellular States and Molecular Features of Human Inflammatory Skin Pathologies

Affiliations

Second-Strand Synthesis-Based Massively Parallel scRNA-Seq Reveals Cellular States and Molecular Features of Human Inflammatory Skin Pathologies

Travis K Hughes et al. Immunity. .

Abstract

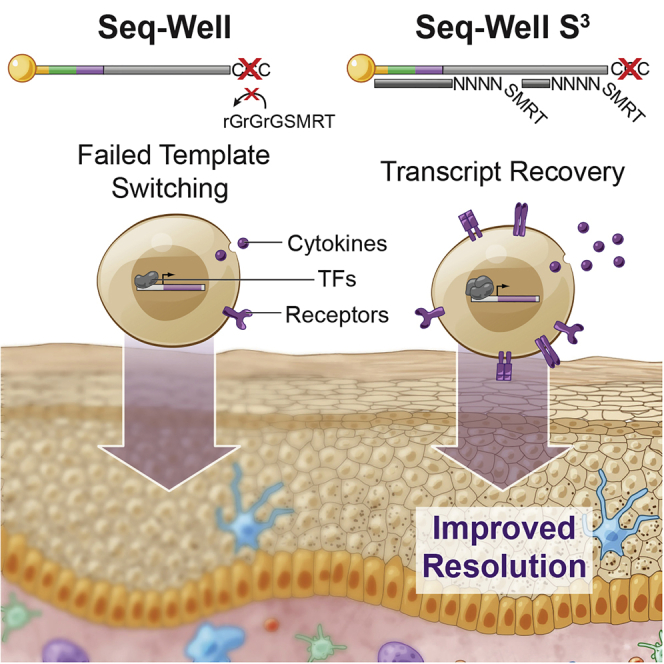
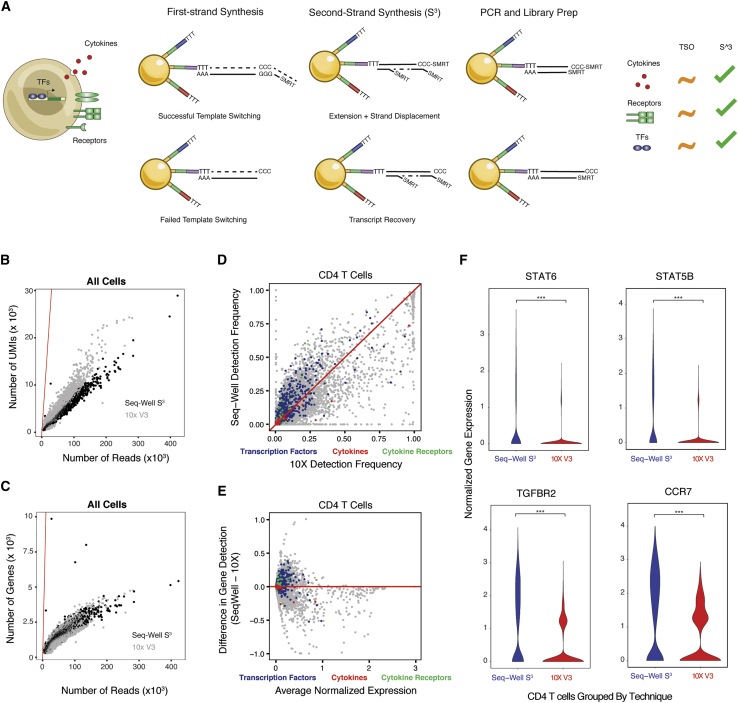
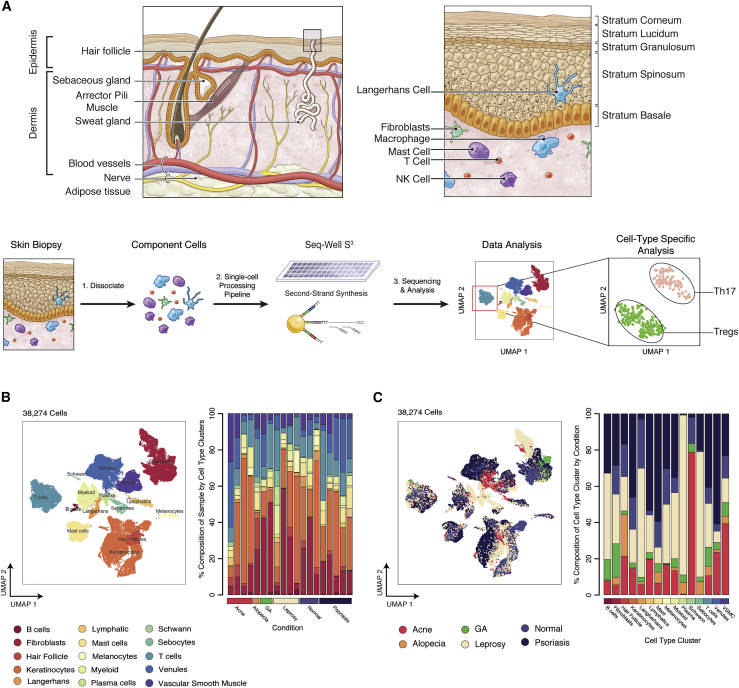
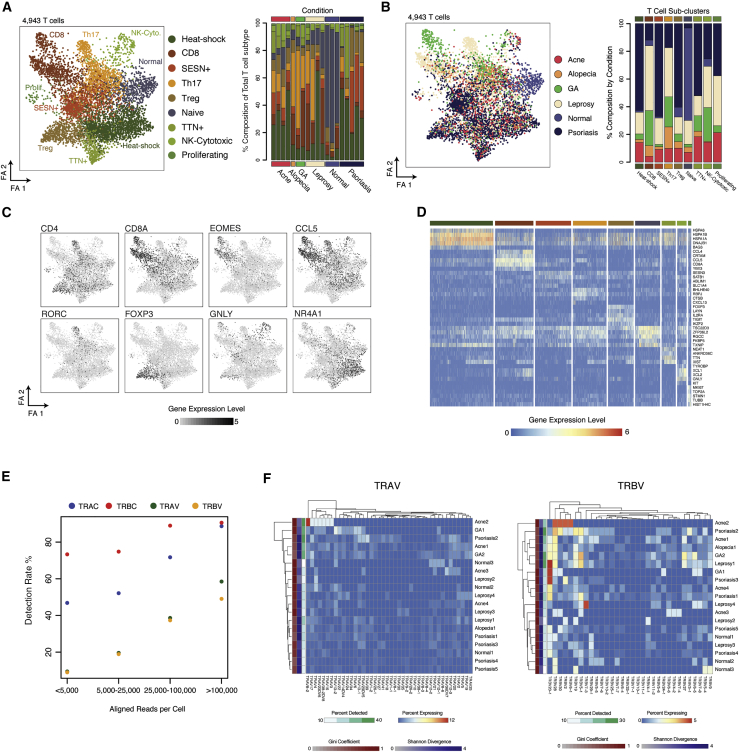
High-throughput single-cell RNA-sequencing (scRNA-seq) methodologies enable characterization of complex biological samples by increasing the number of cells that can be profiled contemporaneously. Nevertheless, these approaches recover less information per cell than low-throughput strategies. To accurately report the expression of key phenotypic features of cells, scRNA-seq platforms are needed that are both high fidelity and high throughput. To address this need, we created Seq-Well S3 ("Second-Strand Synthesis"), a massively parallel scRNA-seq protocol that uses a randomly primed second-strand synthesis to recover complementary DNA (cDNA) molecules that were successfully reverse transcribed but to which a second oligonucleotide handle, necessary for subsequent whole transcriptome amplification, was not appended due to inefficient template switching. Seq-Well S3 increased the efficiency of transcript capture and gene detection compared with that of previous iterations by up to 10- and 5-fold, respectively. We used Seq-Well S3 to chart the transcriptional landscape of five human inflammatory skin diseases, thus providing a resource for the further study of human skin inflammation.

Keywords: Seq-Well; acne; alopecia areata; granuloma annulare; leprosy; psoriasis; scRNA-seq; single-cell RNA sequencing; skin inflammation.


Conflict of interest statement

Declaration of Interests A.K.S. and J.C.L. have received compensation for consulting and SAB membership from Honeycomb Biotechnologies. A.K.S. has received compensation for consulting and SAB membership from Cellarity, Repertoire Immune Medicines, Orche Bio, and Dahlia Biosciences. T.M.G., T.K.H., M.H.W., A.K.S., and J.C.L. are co-inventors on a provisional patent application filed by MIT relating to the improved methodology described in this manuscript.

Figures

None
Graphical abstract
Figure 1
Figure 1
Overview of Second-Strand Synthesis (S3) (A) Conceptual illustration of the molecular features that define immune phenotypes as well as the Seq-Well second-strand synthesis method (Seq-Well S3). (B) Scatterplot showing differences in per-cell transcript capture (y-axis) as a function of aligned reads per cell (x axis) between 10x Genomics v3 (10x v3, grey) and Seq-Well S3 (black) in human PBMCs. Red line indicates where transcripts per cell and aligned reads would be equivalent. (C) Scatterplot shows the differences in per-cell gene detection (y axis) as a function of aligned reads per cell (x axis) between 10x v3 (grey) and Seq-Well S3 (black) in human PBMCs. Red line indicates where genes per cell and aligned reads would be equivalent. (D) Scatterplot comparing gene detection rates in CD4+ T cells between 10x v3 (x axis) and Seq-Well S3 (y axis). Red line indicates point of equivalence in gene detection frequency between methods. Colors correspond to classes of genes including transcription factors (blue), cytokines (red), and receptors (green). See also Table S1. (E) Scatterplot comparing gene detection frequency (y axis) between Seq-Well S3 (positive values) and 10x v3 (negative values) as a function of the average expression amounts (log(scaled UMI + 1)) of an individual gene (x axis). Red line indicates point of equivalence in gene detection frequency between methods. Colors correspond to classes of genes including transcription factors (blue), cytokines (red), and receptors (green). See also Table S1. (F) Violin plots of the distribution of normalized expression values (log(scaled UMI + 1)) for select transcription factors and cytokine receptors between Seq-Well S3 and 10x v3. ∗∗∗p < 1.0 × 10−10.
Figure 2
Figure 2
Cell Types Recovered across Inflammatory Skin Conditions (A) (Top, left) Illustration of the anatomic organization and major features of human skin. Shown at the top, right is the cell type composition of the epidermis and dermis. Shown on the bottom is a sample processing pipeline for skin samples (Table S2). (B) (Left) UMAP plot for 38,274 cells colored by cell type cluster. Shown on the right is a stacked barplot depicting the cell type composition for each of the 19 skin biopsies. (C) (Left) UMAP plot for 38,274 cells colored by inflammatory skin condition. Shown on the right is a stacked barplot depicting the proportion of cells from each skin condition within phenotypic clusters.
Figure 3
Figure 3
Identification of Inflammatory T cell States by using Seq-Well S3 (A) (Left) Force-directed graph of 4,943 T cells colored by phenotypic sub-cluster. Shown on the right is a stacked barplot depicting the distribution of T cell sub-clusters within each biopsy. (B) (Left) Force-directed graph of 4,943 T cells colored by inflammatory skin condition. Shown on the right is a stacked barplot depicting the contribution of each inflammatory skin condition to the T cell sub-clusters. (C) T cell force-directed graphs displaying normalized expression (log(scaled UMI + 1)) of a curated group of sub-cluster-defining gene. Higher expression values are shown in black. (D) Heatmap showing normalized gene expression values (log(scaled UMI + 1)) for a curated list of sub-cluster-defining genes across nine T cell sub-clusters. See also Table S3. (E) Plot showing rates of detection of TCR genes from human skin T cells across a range of sequencing depths. (F) Heatmaps showing the distribution of TRAV (left) and TRBV (right) gene expression among T cells within each sample. Within each sample (rows), the color represents the percent of T cells expressing a given TRAV or TRBV gene (columns). The sidebar shows the gini coefficient (red), the Shannon Divergence (blue), and the percent of T cells (green) within each sample with non-zero expression of either TRAV or TRBV genes.
Figure 4
Figure 4
Diverse Myeloid Cell States Uncovered by using Seq-Well S3 (A) (Left) Force-directed graph of 5,010 myeloid cells colored by phenotypic sub-cluster (NB, LCs were enriched from leprosy and normal skin). Shown on the right is a stacked barplot showing the distribution of myeloid sub-clusters within each biopsy. See also Table S3. (B) (Left) Force-directed graph of 5,010 myeloid cells colored by inflammatory skin condition. Shown on the right is a stacked barplot showing the contribution of each inflammatory skin condition to each myeloid sub-cluster. (C) Force-directed graphs of 5,010 myeloid cells highlighting expression of a curated group of sub-cluster defining genes (log(scaled UMI + 1)). Higher expression values are shown in black. See also Table S3. (D) Heatmap showing the normalized expression (log(scaled UMI + 1)) of a curated list of myeloid cell type cluster-defining genes. (E) Volcano plot showing genes differentially expressed in LCs between leprosy (ncells = 67) and normal skin (ncells = 171). Log10-fold change values are shown on the x axis and −log10 adjusted p values are shown on the y axis. See also Table S5. (F) (Left) UMAP plot for 951 DCs from human skin colored by inflammatory skin condition. Shown on the right is a stacked barplot showing the distribution DC sub-grouping within 19 skin biopsies. (G) Heatmap showing the distribution of normalized gene expression amounts (log(scaled UMI + 1)) for cluster-defining genes across dermal DC subpopulations. See also Table S3.
Figure 5
Figure 5
Stromal Cell Diversity (A) Force-directed plots for 8,571 endothelial cells colored by phenotypic sub-cluster (left) and stacked barplot showing the distribution of endothelial phenotypic sub-clusters across samples (right) (Table S3). (B) Force-directed plots for 8,571 endothelial colored by inflammatory skin condition (left) and stacked barplot showing the contribution of each inflammatory skin condition to endothelial phenotypic sub-clusters (right). (C) Force-directed plot colored by normalized expression amounts of genes that mark endothelial cell types: (Left) CD93, venules, (Middle) TAGLN, arterioles, (Right) LYVE1, lymphatics. (D) Heatmap showing patterns of normalized gene expression amounts (log(scaled UMI + 1)) across nine clusters of endothelial cells (Table S3). (E) Heatmap showing row-normalized expression amounts of vascular addressins across phenotypic sub-clusters of endothelial cells. (F) Force-directed plots for 7,237 fibroblasts colored by phenotypic sub-cluster (left) and stacked barplot showing the distribution of fibroblast phenotypic sub-clusters across samples (right) (Table S3). (G) Force-directed plots for 7,237 fibroblasts colored by inflammatory skin condition (left) and stacked barplot showing the contribution of each inflammatory skin condition to fibroblast phenotypic sub-clusters (right). (H) Force-directed graphs highlighting fibroblast cluster-defining genes. (I) Heatmap showing the normalized gene expression levels (log(scaled UMI + 1)) of fibroblast cluster-defining genes (Table S3).
Figure 6
Figure 6
Keratinocyte Differentiation Trajectories (A) Diagram showing the layers of the epidermis and morphologic changes associated with keratinocyte differentiation. (B) t-SNE plot showing differentiation trajectory of keratinocytes from normal skin from basal cells (yellow) through differentiating cells (aqua) and terminal keratinocytes (purple). (C) (Top, left) t-SNE plot of normal keratinocytes colored by KRT14 expression. Shown at the top right is KRT14 staining from the human protein atlas (Uhlén et al., 2015). Shown on the bottom left is a t-SNE plot of normal keratinocytes colored by FLG expression. Shown on the bottom right is FLG staining from the human protein atlas (Uhlén et al., 2015). Scale bars, 50 μm. (D) Diffusion map of 10,777 keratinocytes colored by inflammatory skin condition. Axes correspond to diffusion components 1, 2, and 3. (E) Diffusion map of keratinocytes colored by signatures of hair-follicle-specific gene expression (Joost et al., 2016) (Left: outer bulge, inner bulge, and upper hair follicle) and genes that distinguish basal (COL17A1), normal (KRT77), and inflamed (S100A9) keratinocytes. (F) Volcano plot of genes differentially expressed between psoriatic and normal keratinocytes. Log10-fold change values are shown on the x axis and −log10 adjusted p values are shown on the y axis. (G) Heatmap showing gene-specific Pearson correlation values between diffusion pseudotime and gene expression for two normal skin biopsies and five psoriatic biopsies. (H) (Top) Immunofluorescence staining in normal (above) and psoriatic (below) for FOSL, IL36G, TNFAIP3, and APOBEC3. All images stained for nuclei (DAPI) and gene of interest (red fluorescence). Scale bar, 100 μm. (I). Immunofluorescence staining for IL-17R expression (green) in normal (left), uninvolved (middle), and psoriatic skin (right). Scale bar, 100 μm.

References

    1. Angelo M., Bendall S.C., Finck R., Hale M.B., Hitzman C., Borowsky A.D., Levenson R.M., Lowe J.B., Liu S.D., Zhao S. Multiplexed ion beam imaging of human breast tumors. Nat. Med. 2014;20:436–442. - PMC - PubMed
    1. Aran D., Looney A.P., Liu L., Wu E., Fong V., Hsu A., Chak S., Naikawadi R.P., Wolters P.J., Abate A.R. Reference-based analysis of lung single-cell sequencing reveals a transitional profibrotic macrophage. Nat. Immunol. 2019;20:163–172. - PMC - PubMed
    1. Balin S.J., Pellegrini M., Klechevsky E., Won S.T., Weiss D.I., Choi A.W., Hakimian J., Lu J., Ochoa M.T., Bloom B.R. Human antimicrobial cytotoxic T lymphocytes, defined by NK receptors and antimicrobial proteins, kill intracellular bacteria. Science immunology. 2018;3:eaat7668. - PMC - PubMed
    1. Best J.A., Blair D.A., Knell J., Yang E., Mayya V., Doedens A., Dustin M.L., Goldrath A.W., Monach P., Shinton S.A., Immunological Genome Project Consortium Transcriptional insights into the CD8(+) T cell response to infection and memory T cell formation. Nat. Immunol. 2013;14:404–412. - PMC - PubMed
    1. Beylot C., Auffret N., Poli F., Claudel J.P., Leccia M.T., Del Giudice P., Dreno B. Propionibacterium acnes: an update on its role in the pathogenesis of acne. J. Eur. Acad. Dermatol. Venereol. 2014;28:271–278. - PubMed

Publication types