. 2020 Nov 11;28(5):752-766.e9.
doi: 10.1016/j.chom.2020.09.011. Epub 2020 Oct 13.

A Comprehensive Subcellular Atlas of the Toxoplasma Proteome via hyperLOPIT Provides Spatial Context for Protein Functions

Affiliations

A Comprehensive Subcellular Atlas of the Toxoplasma Proteome via hyperLOPIT Provides Spatial Context for Protein Functions

Konstantin Barylyuk et al. Cell Host Microbe. .

Abstract

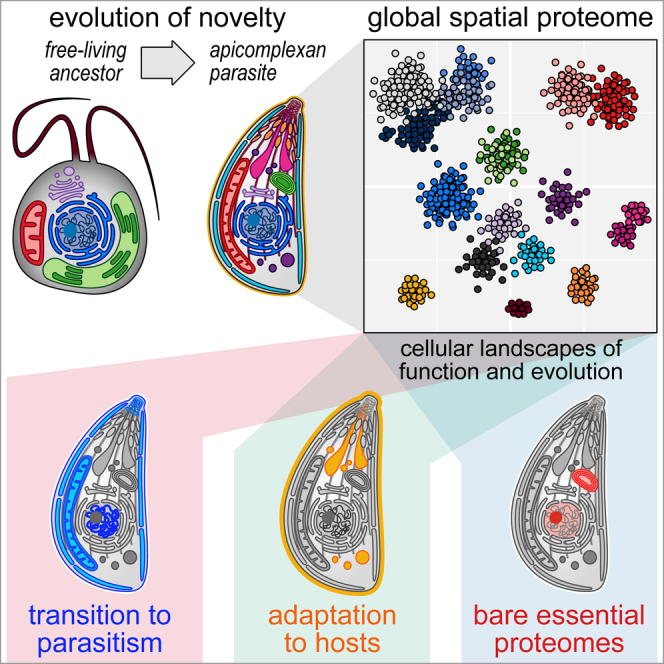
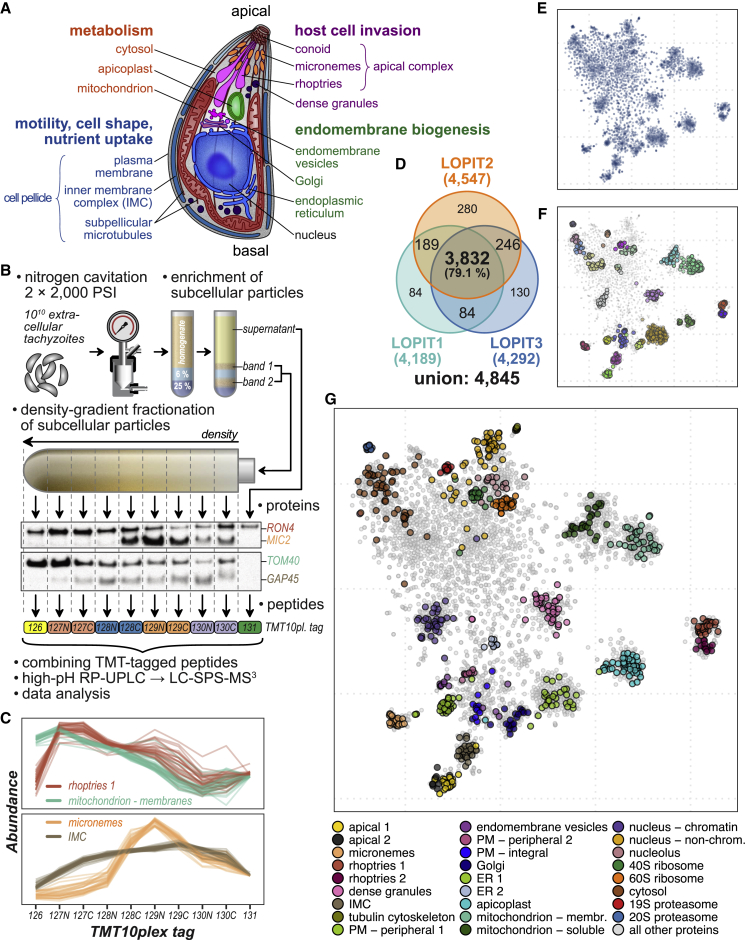
Apicomplexan parasites cause major human disease and food insecurity. They owe their considerable success to highly specialized cell compartments and structures. These adaptations drive their recognition, nondestructive penetration, and elaborate reengineering of the host's cells to promote their growth, dissemination, and the countering of host defenses. The evolution of unique apicomplexan cellular compartments is concomitant with vast proteomic novelty. Consequently, half of apicomplexan proteins are unique and uncharacterized. Here, we determine the steady-state subcellular location of thousands of proteins simultaneously within the globally prevalent apicomplexan parasite Toxoplasma gondii. This provides unprecedented comprehensive molecular definition of these unicellular eukaryotes and their specialized compartments, and these data reveal the spatial organizations of protein expression and function, adaptation to hosts, and the underlying evolutionary trajectories of these pathogens.

Keywords: apicomplexa; evolution; host-pathogen interaction; invasion; organelle; parasitism; plasmodium; proteomics; subcellular; toxoplasma.


Conflict of interest statement

Declaration of Interests The authors declare no competing interests.

Figures

None
Graphical abstract
Figure 1
Figure 1
HyperLOPIT Reveals Organelle Protein Ensembles through Measuring Cofractionation Profiles of Proteins (A) Schematic of T. gondii tachyzoite showing the main subcellular compartments and structures. (B) Summary of hyperLOPIT workflow. Cells are mechanically disrupted, homogenate fractionated (conditions optimization by western blot, e.g., markers for rhoptries (RON4), micronemes (MIC2), mitochondria (TOM40), and IMC (GAP45)), and peptides labeled with a unique 10plex tandem mass tags for relative peptide quantitation by tandem mass spectrometry (LC-SPS-MS3). (C) Abundance-distribution profiles of select subcellular marker proteins measured in the LOPIT2 experiment. Note the similarity with the WB results shown in (B). See Figure S1 for concatenated profiles of all experiments (30plex). (D) A Venn diagram showing the numbers of unique and shared proteins identified and quantified in all 10 fractions of the three hyperLOPIT experiments. (E) A 2D-projection of the 30plex quantitative proteomic data (i.e., abundance-distribution profiles) for 3,832 T. gondii proteins shared across three hyperLOPIT datasets. t-distributed stochastic neighbor embedding (t-SNE) was used for dimensionality reduction. Each data point represents an individual protein, and the clustering of proteins reflects the similarity of their abundance distribution profiles. (F) Protein clusters discovered by the analysis of raw abundance-distribution profiles with HDBSCAN overlaid on the t-SNE projection. Distinct clusters are indicated by color. (G) Mapping of 718 subcellular marker proteins on the t-SNE projection of T. gondii spatial proteome data.
Figure 2
Figure 2
Validation of HyperLOPIT-Predicted Subcellular Locations (A) Examples of uncharacterized proteins epitope tagged and detected by immunofluorescence microscopy (magenta) co-located with named marker proteins (green). Cell outlines are indicated (dashed lines). See Figure S2 for all validated proteins. Scale bar, 10 μm. (B) Optical super-resolution (3D-SIM) images of select proteins (magenta) from (A) with subcellular marker proteins (green). Arrows indicate the cell posterior-to-anterior cell axis. Scale bar, 1 μm.
Figure 3
Figure 3
Protein Assignment to Known Subcellular Niches by Supervised Bayesian Classification (A) TAGM-MAP predicted a steady-state location of proteins (99% probability) superimposed on the t-SNE projection of the 30plex hyperLOPIT data for 3,832 proteins. (B) The number of proteins assigned to each location. Marker proteins (Mk: previously characterized proteins + verified proteins as in Figures 2 and S2) are indicated in a dark color, newly assigned protein predictions (Pd: at 99% TAGM-MAP probability) in a light color. (C) Heatmap showing proteins ordered by the TAGM-MAP-assigned class (rows) against joint probabilities of proteins to belong to each of the 26 defined subcellular classes or the outlier component (columns) inferred by TAGM-MCMC. Colorbars on the right show the uncertainty of TAGM-MCMC localization as the 95% equitailed confidence interval of the TAGM-MCMC localization probability (in shades of gray) and the mean Shannon entropy (in shades of red). (D) A violin plot showing an example TAGM-MCMC distribution of localization probabilities across the 26 subcellular niches. The most probable location predicted by TAGM-MAP and TAGM-MCMC for this protein is PM-integral, but there is also a significant probability of localization to Golgi, consistent with signals seen for proteins that might cycle between multiple compartments. (E) Fractions of monotopic and polytopic integral membrane proteins (blue and red, respectively) by subcellular class. (F) Compartment-specific distributions of protein charge (computed pI) are shown as Tukey box plots (legend at right). The probability of class-specific means differing from the dataset average by chance is shown to the right. See also Figures S3 and S4; Tables S4 and S6A.
Figure 4
Figure 4
Correlation of Gene-Expression Patterns within Subcellular Compartments (A) Schematic of analysis of gene co-expression according to protein location. The distribution of co-expression levels between members of a cluster (blue) is plotted against this distribution between members of the cluster and all other genes (orange). (B) Gene co-expression levels for select hyperLOPIT clusters measured as Pearson correlations. Cohen's d values are shown above each chart along with effect size descriptors. See also Figure S5; Table S5.
Figure 5
Figure 5
Distinction of Properties of Apicomplexan Signal Peptide and Transmembrane Domain Sequences According to Subcellular Compartment (A) Differences in relative positional abundances of amino acids for signal peptide (SP) sequences of proteins from apicomplexan endomembrane compartments shown as logo plots anchored on the cleavage site (position 0). See also Figure S6; Tables S7A and S7B. Amino acids are colored by physicochemical properties. (B) Distributions of apicomplexan transmembrane (TM) span length for single-span proteins of different compartments. The length distributions (violin plots) were compared pairwise by the Mann-Whitney U test, and the resulting p values (heatmap) were used to cluster membrane type. See also Table S7C.
Figure 6
Figure 6
T. gondii Subcellular Compartments Show Distinct Distributions of the Functional Redundancy of the Proteomes, Selection Pressure, and Genetic Polymorphism (A) Compartment-specific distribution of protein functional redundancy expressed as the average gene knockout (KO) phenotype score quantifying the contribution of each T. gondii gene to the parasite fitness during in vitro culture (a negative score indicates relatively indispensable genes; a positive score indicates dispensable genes). (B) Compartment-specific distributions of evolutionary selection pressures expressed as the protein-average ratio of nonsynonymous and synonymous mutation rates (dN/dS ratio). (C) Compartment-specific distributions of genetic polymorphism expressed as the density of SNP per kilobase of gene coding sequence (CDS). Compartment-specific distributions are shown as Tukey box plots as for Figure 3F. See also Figure S7; Tables S6B–S6D.
Figure 7
Figure 7
T. gondii Subcellular Compartment Proteomes Reveal the Tempo of Compartment Evolution Over Evolutionary Time A dot plot showing the distribution of significant enrichments for new protein orthologues at twelve phylogenetic distance levels within hyperLOPIT-defined apicomplexan compartment classes. p values (colors) calculated by under-representation hypergeometric test and scaled according to the gene ratio (fraction of novel proteins in a compartment against all novel proteins at a given phylogenetic distance level). Toxo./Ham., Toxoplasma/Hammondia; SAR, stramenopiles/Alveolata/Rhizaria. See also Tables S8A–S8F.

References

    1. Almagro Armenteros J.J., Tsirigos K.D., Sønderby C.K., Petersen T.N., Winther O., Brunak S., von Heijne G., Nielsen H. SignalP 5.0 improves signal peptide predictions using deep neural networks. Nat. Biotechnol. 2019;37:420–423. - PubMed
    1. Aurrecoechea C., Brestelli J., Brunk B.P., Dommer J., Fischer S., Gajria B., Gao X., Gingle A., Grant G., Harb O.S. PlasmoDB: a functional genomic database for malaria parasites. Nucleic Acids Res. 2009;37:D539–D543. - PMC - PubMed
    1. Aurrecoechea C., Brestelli J., Brunk B.P., Fischer S., Gajria B., Gao X., Gingle A., Grant G., Harb O.S., Heiges M. EuPathDB: a portal to eukaryotic pathogen databases. Nucleic Acids Res. 2010;38:D415–D419. - PMC - PubMed
    1. Bai M.J., Wang J.L., Elsheikha H.M., Liang Q.L., Chen K., Nie L.B., Zhu X.Q. Functional characterization of dense granule proteins in Toxoplasma gondii RH strain using CRISPR-Cas9 system. Front. Cell. Infect. Microbiol. 2018;8:300. - PMC - PubMed
    1. Benjamini Y., Hochberg Y. Controlling the false discovery rate: a practical and powerful approach to multiple testing. J. R. Stat. Soc. B. 1995;57:289–300.

Publication types