. 2021 Dec 1;106(12):3056-3066.
doi: 10.3324/haematol.2020.253740.

Plasmacytoid dendritic cells proliferation associated with acute myeloid leukemia: phenotype profile and mutation landscape

Affiliations

Plasmacytoid dendritic cells proliferation associated with acute myeloid leukemia: phenotype profile and mutation landscape

Loria Zalmaï et al. Haematologica. .

Abstract

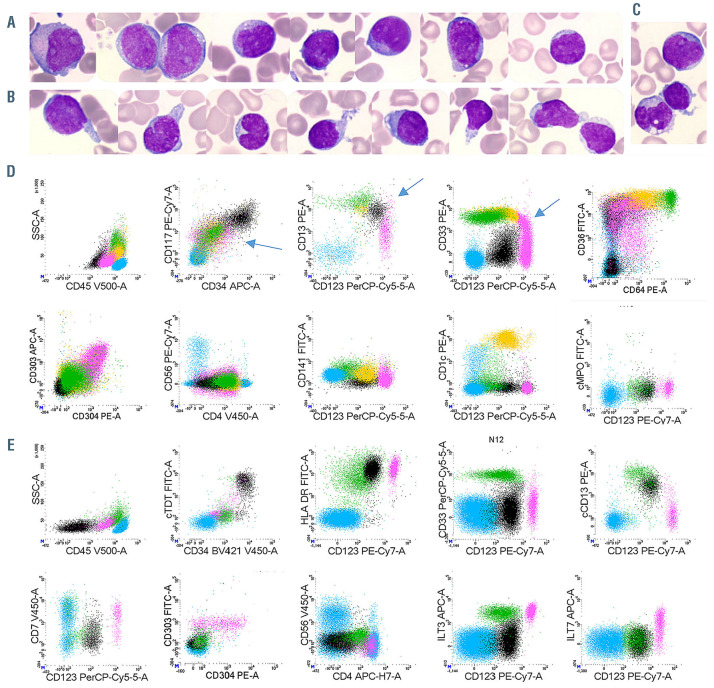
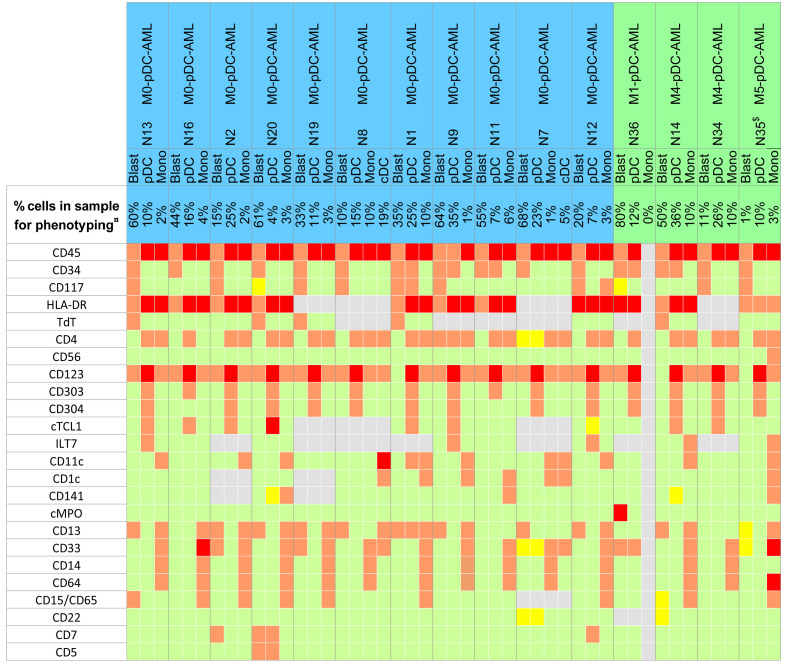
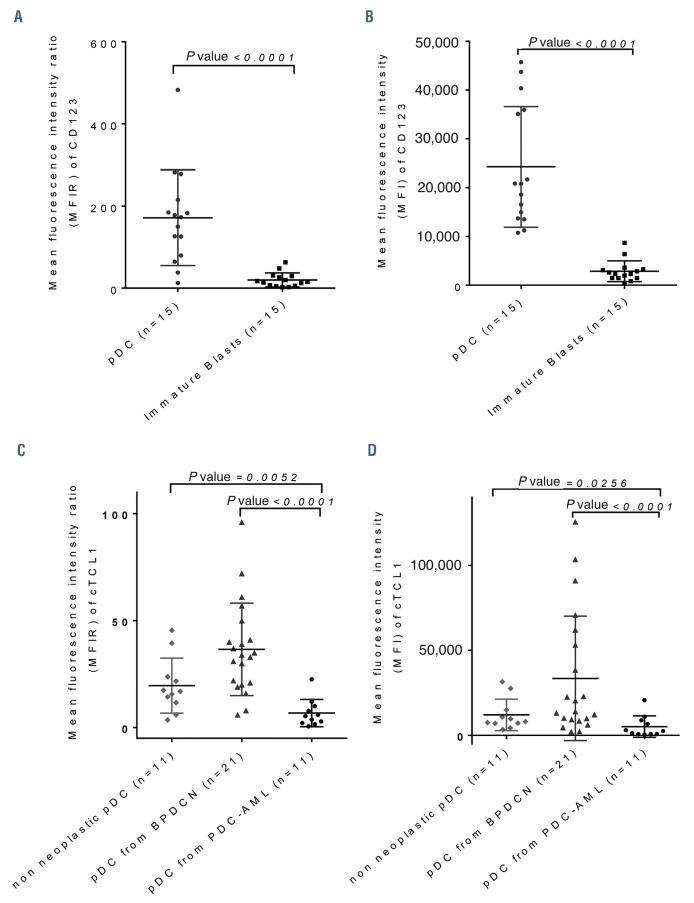
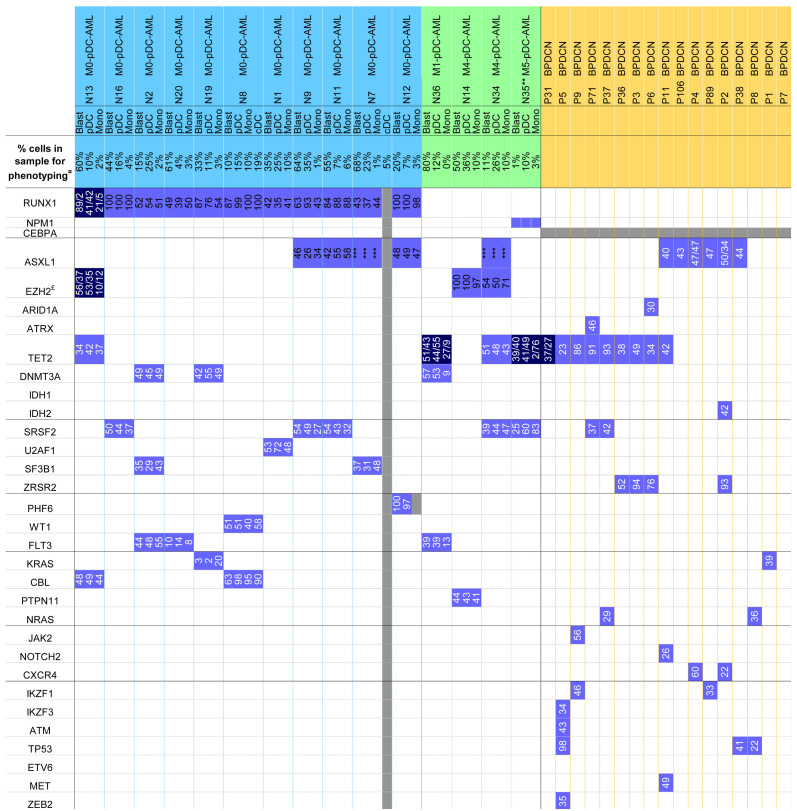
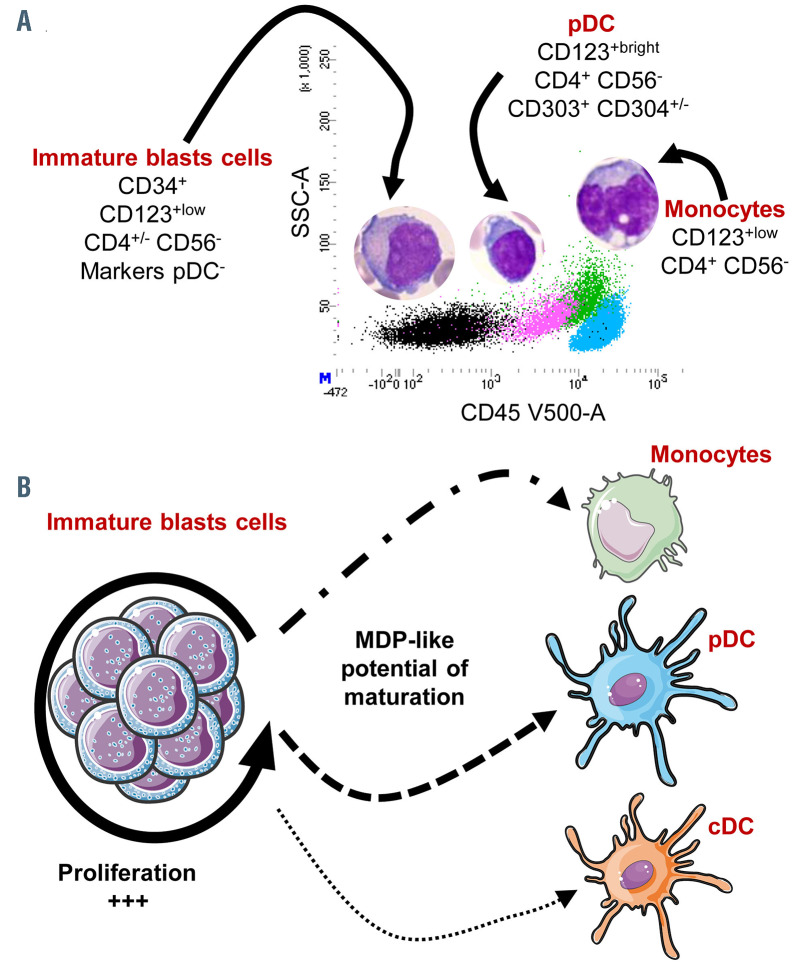
Neoplasms involving plasmacytoid Dendritic Cells (pDCs) include Blastic pDC Neoplasms (BPDCN) and other pDC proliferations, where pDCs are associated with myeloid malignancies: most frequently Chronic MyeloMonocytic Leukemia (CMML) but also Acute Myeloid Leukemia (AML), hereafter named pDC-AML. We aimed to determine the reactive or neoplastic origin of pDCs in pDC-AML, and their link with the CD34+ blasts, monocytes or conventional DCs (cDCs) associated in the same sample, by phenotypic and molecular analyses (targeted NGS, 70 genes). We compared 15 pDC-AML at diagnosis with 21 BPDCN and 11 normal pDCs from healthy donors. CD45low CD34+ blasts were found in all cases (10-80% of medullar cells), associated with pDCs (4-36%), monocytes in 14 cases (1-10%) and cDCs (2 cases, 4.8-19%). pDCs in pDC-AML harbor a clearly different phenotype from BPDCN: CD4+ CD56- in 100% of cases, most frequently CD303+, CD304+ and CD34+; lower expression of cTCL1 and CD123 with isolated lymphoid markers (CD22/CD7/CD5) in some cases, suggesting a pre-pDC stage. In all cases, pDCs, monocytes and cDC are neoplastic since they harbor the same mutations as CD34+ blasts. RUNX1 is the most commonly mutated gene: detected in all AML with minimal differentiation (M0-AML) but not in the other cases. Despite low number of cases, the systematic association between M0-AML, RUNX1 mutations and an excess of pDC is puzzling. Further evaluation in a larger cohort is required to confirm RUNX1 mutations in pDC-AML with minimal differentiation and to investigate whether it represents a proliferation of blasts with macrophage and DC progenitor potential.


Figures

Figure 1.
Figure 1.
Morphologies and immunophenotypes of populations of interest. (A to C) Representative morphologic aspects of peripheral blood smears from patient N1 (magnification 1,000X). (A) Blast cells are medium sized with a high nuclear cytoplasmic ratio, fine chromatin with proeminent nucleoli. Cytoplasm is basophilic with some rare azurophilic granulations. (B) Plasmacytoid dendritic cells (pDC) are smaller with more mature chromatin. The cytoplasm is less basophilic without granulation but sometimes pseudopodia and small vacuoles under the cytoplasmic membrane. (C) A blast cell (top), a pDC with pseudopodia (center) and a monocyte (bottom). (D to E) Representative immunophenotype after gating on FSC-A vs. FSC-H plus sides catter (SSC) vs. forward scatter (FSC) to select singlets, leucocytes and exclude debris (not shown). Lymphocytes in blue (CD45bright/SSCdim cells); immature blasts in black (CD34+ cells); pDC in pink (CD123bright); monocytes in green (CD123dim, CD33bright, CD64bright); cDC in orange (CD123+, CD33+ CD64dim). (D) Patient N8: acute myeloid leukemia with minimal differentiation (M0-AML) with a continuum of phenotypic acquisition of markers (arrows) from the immature blasts: downregulation of CD13 and CD33 to pDC or upregulation to monocytes and cDC; downregulation of CD117 and CD34 to pDC/monocytes/cDC. (E) Patient N12: M0-AML with Tdt+, HLA-DRbright, CD33-, cCD13+ immature blasts; CD7+ CD4+ CD56– pDC.
Figure 2.
Figure 2.
Immunophenotypic features of plasmacytoid dendritic cell-acute myeloid leukemia. Positive high on 100% of cells in red (>10x4), positive on 100% of cells in orange (10x2 to 10x4), partially positive in light yellow, negative (<20%) in green, not done in grey. CD15 and CD65 are both labeled by fluorescein isothiocyanate (FITC) in the same tube of our panel. ¤Percentage of cells corresponds to flow cytometry, quantification on the sample used for phenotyping, possibly diluted by peripheral blood. All cases exhibited more than 20% of blasts on bone marrow smears. $Analyses performed on sample obtained after induction of chemotherapy, 70 days after diagnosis. cCD3, CD3, CD19, cCD79a were negative for all cases and all fractions. pDC: plasmacytoid dendritic cells; cDC: conventional DC; Mono: monocytes; AML: acute myeloid leukemia; M0-AML: AML with minimal differentiation.
Figure 3.
Figure 3.
Expression of CD123 and cTCL1 on plasmacytoid dendritic cells from plasmacytoid dendritic cell-acute myeloid leukemia. (A) Comparison of mean fluorescence intensity ratio (MFIR) of CD123 between plasmacytoid dendritic cells (pDC) and immature CD34+ blasts in pDC-acute myeloid leukemia (pDC-AML). (B) Comparison of MFI of CD123 between pDC and immature CD34+ blasts in pDC-AML. (C) Comparison of MFIR of cTCL1 between pDC from pDC-AML, blastic pDC neoplasms (BPDCN) and non-neoplastic pDC from healthy donors. (D) Comparison of MFI of cTCL1 between pDC from pDC-AML, BPDCN and non-neoplastic pDC from healthy donors. P-values (unpaired Mann-Whitney test) are marked above.
Figure 4.
Figure 4.
Mutation profile of plasmacytoid dendritic cell-acute myeloid leukemia. Mutations detected by next-generation sequencing with variant allele frequencies (VAF), or Sanger sequencing (especially for ASXL1). Abnormalities in plasmacytoid dendritic cells-acute myeloid leukemia (pDC-AML) and blastic pDC neoplasms (BPDCN) are depicted in: bright blue (monoallelic mutation); dark blue (biallelic mutation); white (absence of mutation); grey (not available). ¤Percentage of cells corresponds to flow cytometry, quantification on the sample used for phenotyping, possibly diluted by peripheral blood (all cases exhibited more than 20% of blasts on bone marrow smears). $Analyses performed on sample obtained after induction of chemotherapy, 70 days after diagnosis. £Fluorescence in situ hybridization (FISH) 7q36 on case N16: loss of EZH2 in 91 of 200 nuclei. ***VAF not available because ASXL1 c.1934dupG;p.Gly646TrpfsX12 was confirmed by Sanger sequencing. Mono: monocytes.
Figure 5.
Figure 5.
Maturation model in plasmacytoid dendritic cell-acute myeloid leukemia. (A) Representative CD45/SSC dot plot of plasmacytoid dendritic cells-acute myeloid leukemia (pDC-AML), with four populations identified: immature CD34+ blasts in black, pDC in pink, monocytes in green and lymphocyte in blue, with morphologies of these populations depicted above. (B) The maturation model: immature blast cells are mainly proliferative without maturation, but at least part of them conserved MDP (macrophage-DC progenitor)-like potential of maturation leading to variable amounts of clonal pDC, monocytes and conventional DC (cDC).

References

    1. Banchereau J, Briere F, Caux C, et al. Immunobiology of dendritic cells. Annu Rev Immunol. 2000;18767-811. - PubMed
    1. Jegalian AG, Facchetti F, Jaffe ES. Plasmacytoid dendritic cells: physiologic roles and pathologic states. Adv Anat Pathol. 2009;16(6):392-404. - PMC - PubMed
    1. Naik SH, Sathe P, Park H-Y, et al. Development of plasmacytoid and conventional dendritic cell subtypes from single precursor cells derived in vitro and in vivo. Nat Immunol. 2007;8(11):1217-1226. - PubMed
    1. Onai N, Obata-Onai A, Schmid MA, Ohteki T, Jarrossay D, Manz MG. Identification of clonogenic common Flt3+M-CSFR+ plasmacytoid and conventional dendritic cell progenitors in mouse bone marrow. Nat Immunol. 2007; 8(11):1207-1216. - PubMed
    1. Chaperot L, Bendriss N, Manches O, et al. Identification of a leukemic counterpart of the plasmacytoid dendritic cells. Blood. 2001;97(10):3210-3217. - PubMed