. 2020 Oct 15:9:e59281.
doi: 10.7554/eLife.59281.

Divergent projections of the prelimbic cortex bidirectionally regulate active avoidance

Affiliations

Divergent projections of the prelimbic cortex bidirectionally regulate active avoidance

Maria M Diehl et al. Elife. .

Abstract

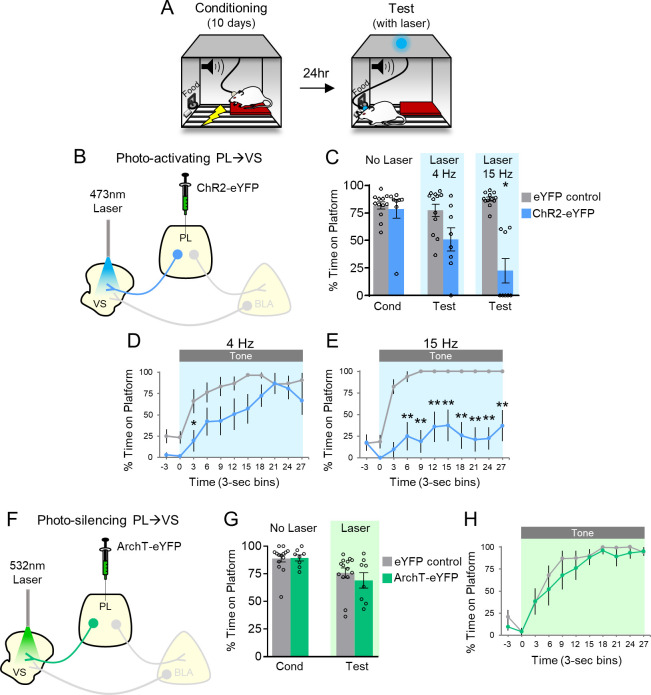
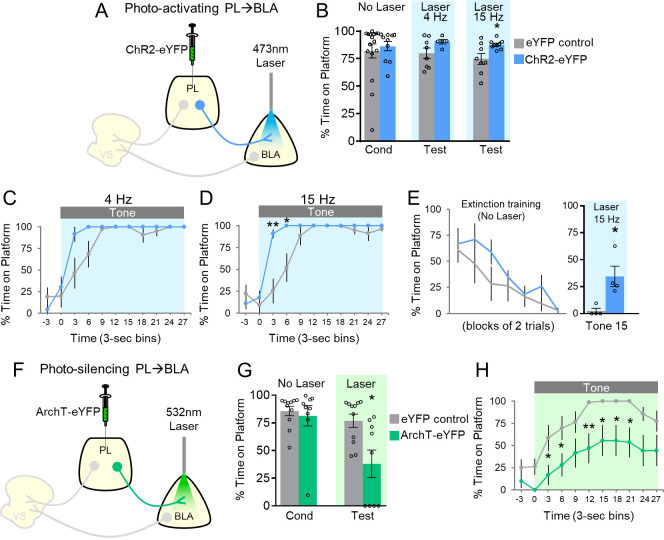
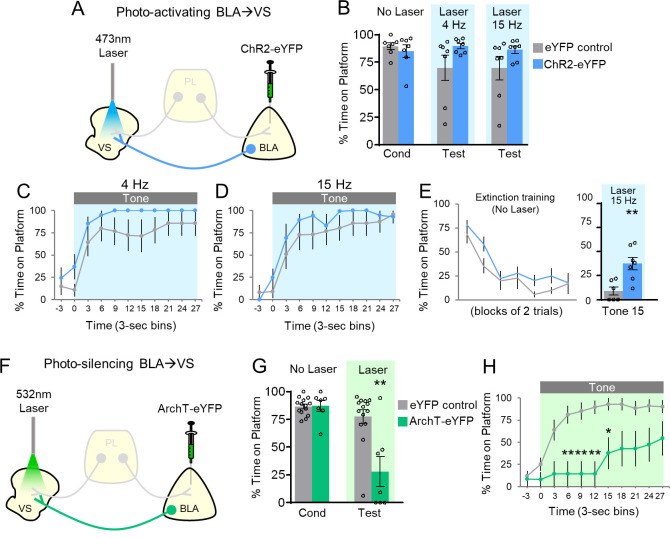
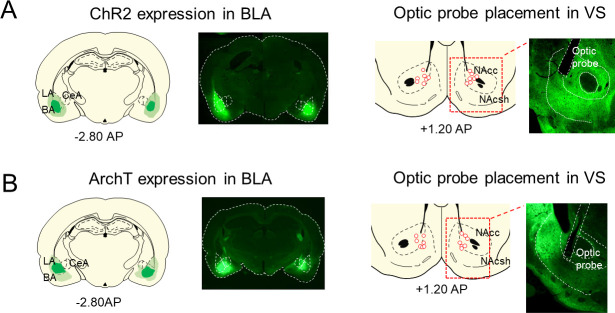
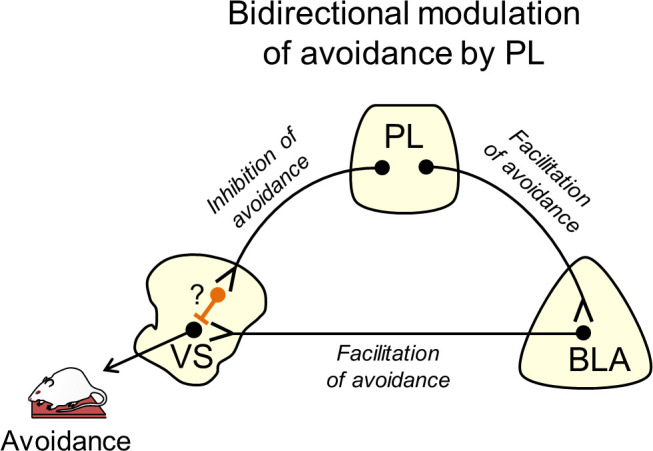
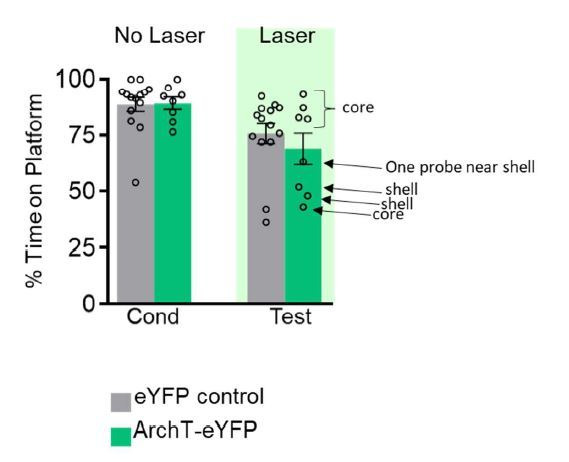
The prefrontal cortex (PFC) integrates incoming information to guide our actions. When motivation for food-seeking competes with avoidance of danger, the PFC likely plays a role in selecting the optimal choice. In platform-mediated active avoidance, rats avoid a tone-signaled footshock by stepping onto a nearby platform, delaying access to sucrose pellets. This avoidance requires prelimbic (PL) PFC, basolateral amygdala (BLA), and ventral striatum (VS). We previously showed that inhibitory tone responses of PL neurons correlate with avoidability of shock (Diehl et al., 2018). Here, we optogenetically modulated PL terminals in VS and BLA to identify PL outputs regulating avoidance. Photoactivating PL-VS projections reduced avoidance, whereas photoactivating PL-BLA projections increased avoidance. Moreover, photosilencing PL-BLA or BLA-VS projections reduced avoidance, suggesting that VS receives opposing inputs from PL and BLA. Bidirectional modulation of avoidance by PL projections to VS and BLA enables the animal to make appropriate decisions when faced with competing drives.

Keywords: Archaerhodopsin; amygdala; channelrhodopsin; fear; neuroscience; optogenetics; rat; striatum.


Conflict of interest statement

MD, JI, JM, GR, FG, VV, GQ No competing interests declared

Figures

Figure 1.
Figure 1.. Photoactivation of PL projections to VS impairs avoidance.
(A) Rats were trained in platform-mediated avoidance (PMA) for 10 days, followed by a test with laser illumination during the tone. (B) Schematic of virus infusion and optic probe placement. The CaMKII-α promoter was used for all AAVs. (C) Percent time on platform during the last day of avoidance conditioning (Cond; No Laser), and 4 Hz and 15 Hz Laser tests performed one or four days later. (D) Timecourse of avoidance during 4 Hz Laser revealed that PL-VS ChR2 (n = 8) rats showed delayed avoidance compared to eYFP (n = 12) controls (repeated-measures ANOVA, post-hoc Tukey). (E) Same as in panel D with 15 Hz Laser. (F) Schematic of ArchT virus infusion and optic probe placement. (G) Percent time on platform during the last day of avoidance conditioning (Cond; No Laser), and Test day (Tone with Laser). (H) Timecourse of avoidance during Test revealed that ArchT (n = 8) rats showed similar percent time on platform compared to eYFP (n = 14) controls (NS; repeated-measures ANOVA, post-hoc Tukey). All data are shown as mean ± SEM. *p<0.05, **p<0.01.
Figure 1—figure supplement 1.
Figure 1—figure supplement 1.. Spread of AAV expression and location of optic probes.
(A) Min/max spread of AAV expression with example micrograph. (B) Location of optic fiber tips with example micrograph for each projection tested.
Figure 2.
Figure 2.. Avoidance requires activation of PL projections to BLA.
(A) Schematic of ChR2 virus infusion and optic probe placement. (B) Percent time on platform during the last day of avoidance conditioning (Cond; No Laser), and 4 Hz and 15 Hz Tests (with Laser). (C) Timecourse of avoidance during the 4 Hz Test (ChR2 n = 5, eYFP n = 8). (D) Same as in panel B with 15 Hz Laser (ChR2 n = 9, eYFP n = 8). (E) Photoactivation of PL-BLA projections (15 Hz) reinstates avoidance following extinction (ChR2 n = 4, eYFP n = 4). (F) Schematic of ArchT virus infusion and optic probe placement. (G) Percent time on platform during the last day of avoidance conditioning (Cond; No Laser), and Test (Tone with Laser). (H) Timecourse of avoidance during Test revealed that ArchT (n = 9) rats showed delayed avoidance compared to eYFP (n = 11) controls (repeated-measures ANOVA, post-hoc Tukey). All data are shown as mean ± SEM. *p<0.05, **p<0.01.
Figure 2—figure supplement 1.
Figure 2—figure supplement 1.. Spread of AAV expression and location of optic probes.
(A) Min/max spread of AAV expression with example micrograph. (B) Location of optic fiber tips with example micrograph for each projection tested.
Figure 3.
Figure 3.. Avoidance requires activation of BLA projections to VS.
(A) Schematic of ChR2 virus infusion and optic probe placement. (B) Percent time on platform during the last day of avoidance conditioning (Cond; No Laser), and 4 Hz and 15 Hz Laser tests. (C) Timecourse of avoidance during 4 Hz Laser revealed that BLA-VS ChR2 (n = 7) rats showed no significant difference in percent time on platform compared to eYFP (n = 7) controls (repeated-measures ANOVA, post-hoc Tukey). (D) Same conventions as in panel C during 15 Hz Laser. (E) 15 Hz photoactivation of VS-BLA projections reinstates avoidance following extinction (ChR2 n = 7, eYFP n = 7). (F) Schematic of ArchT virus infusion and optic probe placement. (G) Percent time on platform during the last day of avoidance conditioning (Cond; No Laser), and Test (Tone with Laser). (H) Timecourse of avoidance during Test revealed that ArchT (n = 7) rats showed impaired avoidance compared to eYFP (n = 14) controls (repeated-measures ANOVA, post-hoc Tukey). All data are shown as mean ± SEM. *p<0.05, **p<0.01.
Figure 3—figure supplement 1.
Figure 3—figure supplement 1.. Spread of AAV expression and location of optic probes.
(A) Min/max spread of AAV expression with example micrograph. (B) Location of optic fiber tips with example micrograph for each projection tested.
Figure 4.
Figure 4.. Suggested circuit for bidirectional modulation of avoidance by PL.
Activity in PL projections to VS decreases avoidance (top left projection). These projections may target fast-spiking interneurons within VS (orange neuron with question mark), which serve to inhibit VS output neurons. Activity in PL projections to BLA increases avoidance (top right projection), as do BLA projections to VS (bottom projection). In this way, PL inputs to VS could gate the impact of BLA inputs on VS output neurons.
Author response image 1.

References

    1. Anglada-Figueroa D, Quirk GJ. Lesions of the basal amygdala block expression of conditioned fear but not extinction. Journal of Neuroscience. 2005;25:9680–9685. doi: 10.1523/JNEUROSCI.2600-05.2005. - DOI - PMC - PubMed
    1. Aupperle RL, Melrose AJ, Francisco A, Paulus MP, Stein MB. Neural substrates of approach-avoidance conflict decision-making. Human Brain Mapping. 2015;36:449–462. doi: 10.1002/hbm.22639. - DOI - PMC - PubMed
    1. Berke JD. Functional properties of striatal fast-spiking interneurons. Frontiers in Systems Neuroscience. 2011;5:45. doi: 10.3389/fnsys.2011.00045. - DOI - PMC - PubMed
    1. Beyeler A, Namburi P, Glober GF, Simonnet C, Calhoon GG, Conyers GF, Luck R, Wildes CP, Tye KM. Divergent routing of positive and negative information from the amygdala during memory retrieval. Neuron. 2016;90:348–361. doi: 10.1016/j.neuron.2016.03.004. - DOI - PMC - PubMed
    1. Bicks LK, Koike H, Akbarian S, Morishita H. Prefrontal cortex and social cognition in mouse and man. Frontiers in Psychology. 2015;6:1805. doi: 10.3389/fpsyg.2015.01805. - DOI - PMC - PubMed

Publication types