. 2021 Feb;27(2):722-732.
doi: 10.1109/TVCG.2020.3030415. Epub 2021 Jan 28.

Modeling in the Time of COVID-19: Statistical and Rule-based Mesoscale Models

Modeling in the Time of COVID-19: Statistical and Rule-based Mesoscale Models

Ngan Nguyen et al. IEEE Trans Vis Comput Graph. 2021 Feb.

Abstract

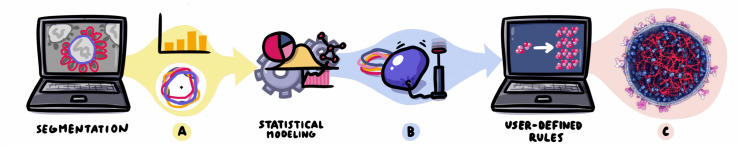
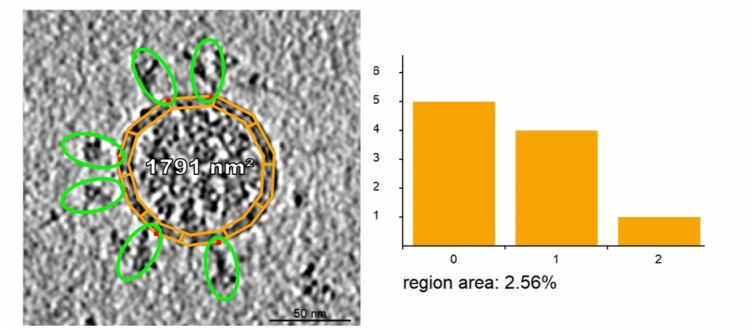
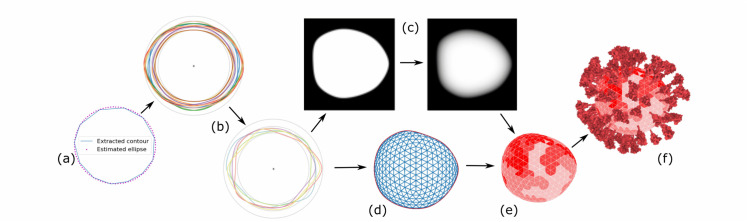
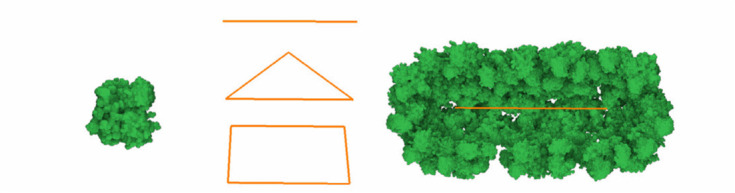
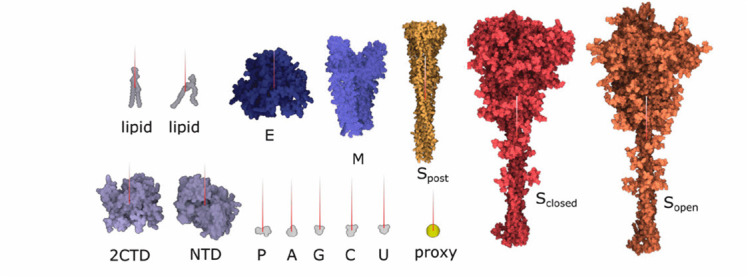
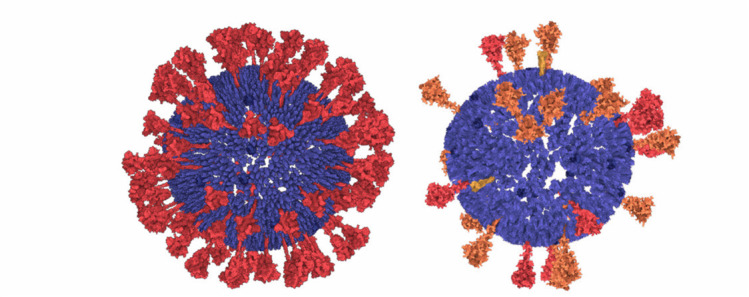
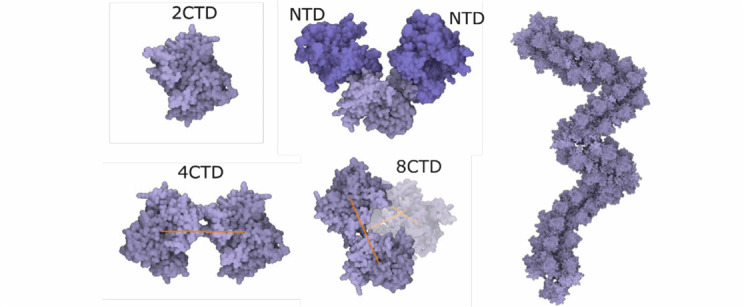
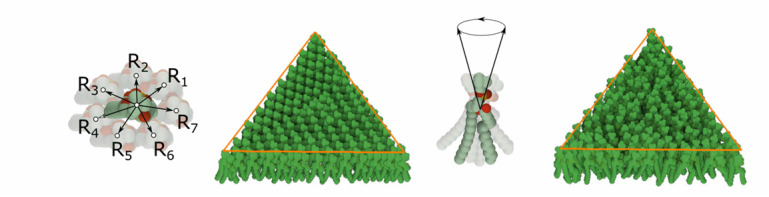
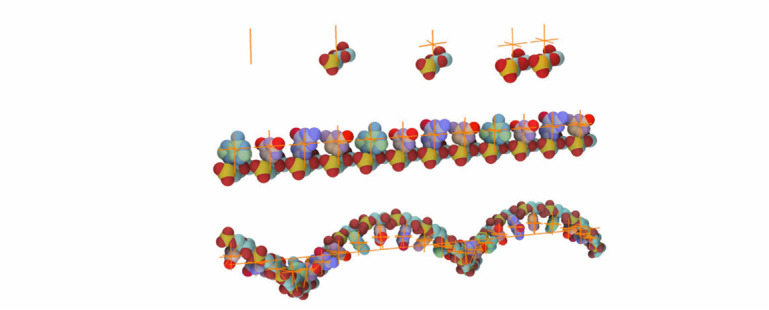
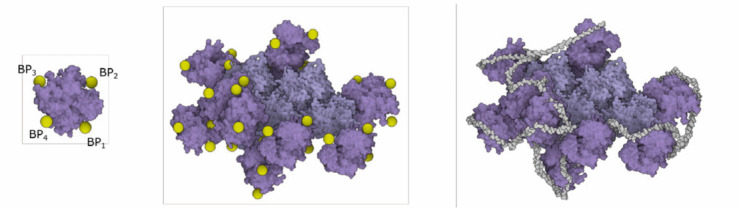
We present a new technique for the rapid modeling and construction of scientifically accurate mesoscale biological models. The resulting 3D models are based on a few 2D microscopy scans and the latest knowledge available about the biological entity, represented as a set of geometric relationships. Our new visual-programming technique is based on statistical and rule-based modeling approaches that are rapid to author, fast to construct, and easy to revise. From a few 2D microscopy scans, we determine the statistical properties of various structural aspects, such as the outer membrane shape, the spatial properties, and the distribution characteristics of the macromolecular elements on the membrane. This information is utilized in the construction of the 3D model. Once all the imaging evidence is incorporated into the model, additional information can be incorporated by interactively defining the rules that spatially characterize the rest of the biological entity, such as mutual interactions among macromolecules, and their distances and orientations relative to other structures. These rules are defined through an intuitive 3D interactive visualization as a visual-programming feedback loop. We demonstrate the applicability of our approach on a use case of the modeling procedure of the SARS-CoV-2 virion ultrastructure. This atomistic model, which we present here, can steer biological research to new promising directions in our efforts to fight the spread of the virus.


Figures

Fig. 1.
Fig. 1.. The ultrastructure of a sars-cov-2 virion created using our modeling technique. the membrane shape and distribution of the spike proteins are determined from microscopy image data. the internal assembly is a result of an interactive 3d rule specification approach. left: internal nucleoprotein complex. middle: rna condensed within the nucleoprotein. right: outer spike distribution.
Fig. 2.
Fig. 2.. An overview of our mesoscale modeling pipeline. first, the user specifies the segmentation of the membrane outlines (contours) and visible membrane-embedded proteins. contours and a histogram of amounts of proteins within individual parts of the membrane (a) are used for statistical contour modeling that is inflated into a 3d mesh and populated with membrane proteins (b). subsequently, the user specifies the rules outlining how invisible proteins should be placed within the 3d model. the output is the model (c), which can be iteratively refined by modifying the rules.
Fig. 3.
Fig. 3.. Input electron microscopy image after segmentation. left: the contour with a band is created. right: the histogram representing the number of spike proteins per contour band region.
Fig. 4.
Fig. 4.. Statistical contour modeling for virion mesh generation: the contour is approximated by an ellipse that is used for bringing all contours into a canonical form (a). statistical contour model is generated from a set of contours and new contours can be generated (b). a newly generated contour is rasterized for contour inflation (c). a two dimensional mesh is generated (d) which is then inflated into the 3d mesh with probability distribution assigned to its triangles (e). spike proteins are populated (f).
Fig. 5.
Fig. 5.. Illustration of element geometry. left: protein instance from a database. middle: a line segment, triangle, and rectangle. right: an arrangement of protein instances around a line segment.
Fig. 6.
Fig. 6.. Distance rule. left: the definition of a probabilistic distance function. top right: application of the rule to a triangular skeleton. bottom right: application of the rule to a point skeleton.
Fig. 7.
Fig. 7.. Relative rule. left: illustration of a relative rule created on a triangular skeleton. top right: the same rule applied to a pentagonal skeleton. the result is a pentameric structure. bottom right: the pentagonal skeleton model is bound to a triangular skeleton.
Fig. 8.
Fig. 8.. Siblings rule. left: all three transformations are applied in every iteration. right: one transformation is selected randomly per iteration.
Fig. 9.
Fig. 9.. Siblings-parent rule. left: creation of a rule. middle: application of the rule. right: two rules applied alternatively to place two different elements in a circle.
Fig. 10.
Fig. 10.. Setting of normal vectors to individual atomic structures.
Fig. 11.
Fig. 11.. Spikes scattered on the surface of the 3d mesh according to the estimated distribution function. membrane and envelope proteins are uniformly distributed on the membrane. left: model version 20–04. right model version 20–06.
Fig. 12.
Fig. 12.. Rope-like n protein complex rule. left: creating an n protein ctd octamer structure and its relation with ntd. right: connecting n protein octamer structure to form the rope.
Fig. 13.
Fig. 13.. Population of lipids. left: the rule with seven relations is created for a lipid. application of the rule on triangular skeleton forming patterns. right: modifying the rotation of the lipid by setting yaw, pitch, roll. resulting population on the triangular skeleton.
Fig. 14.
Fig. 14.. Illustration of rna building. top: creation of a nucleotide and binding of two rna nucleotides is illustrated (only the phosphate sugar backbone is shown; the bases will be populated at the point proxy above the backbone). middle: the replication of the rule and replacing of proxies with a,c,g,u models. bottom: the rule with a rotation incorporated applied to a line segment skeleton.
Fig. 15.
Fig. 15.. Rna proxy objects. left: specifying of the proxy objects representing rna binding pockets on the surface of a few n proteins. middle: the binding pockets computed on all n proteins in the model. right: the resulting rna after populating a,c,g,u,p along the 3d curve approximating the proxy objects.

References

    1. Baek M., Park T., Heo L., Park C., and Seok C.. Galaxyhomomer: a web server for protein homo-oligomer structure prediction from a monomer sequence or structure. Nucleic Acids Research, 45(W1):W320-W324, 04 2017. doi: 10.1093/nar/gkx246. - DOI - PMC - PubMed
    1. Bar-On Y., Flamholz A., Phillips R., and Milo R.. Sars-cov-2 (covid-19) by the numbers. eLife, 9, 03 2020. doi: 10.7554/eLife.57309. - DOI - PMC - PubMed
    1. Berman H., Henrick K., and Nakamura H.. Announcing the worldwide protein data bank. Nature structural biology, 10 (12)980, 2003. doi: 10.1038/nsbpp.1203-980. - DOI - PubMed
    1. Bhatia H., Ingolfsson H. I., Carpenter T. S., Lightstone F. C., and Bremer P.-T.. MemSurfer: A tool for robust computation and characterization of curved membranes. Journal of Chemical Theory and Computation, 15 (11) pp. 6411–6421, 2019. doi: 10.1021/acs.jctc.9b00453. - DOI - PubMed
    1. Blinn J. F.. A generalization of algebraic surface drawing. ACM Transactions on Graphics, 1 (3) pp. 235–256, 1982. doi: 10.1145/357306.357310. - DOI

Publication types