. 2020 Oct 14;6(42):eaaz4530.
doi: 10.1126/sciadv.aaz4530. Print 2020 Oct.

Circadian disruption promotes tumor-immune microenvironment remodeling favoring tumor cell proliferation

Affiliations

Circadian disruption promotes tumor-immune microenvironment remodeling favoring tumor cell proliferation

I Aiello et al. Sci Adv. .

Abstract

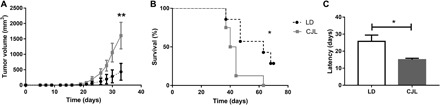
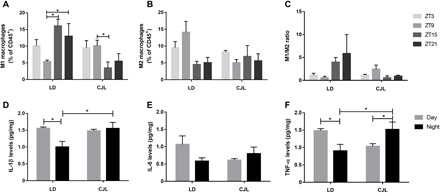
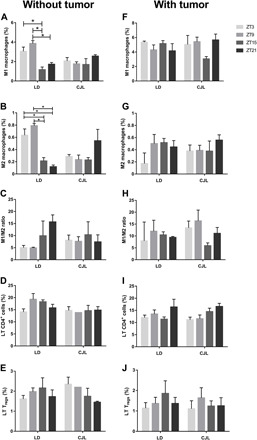
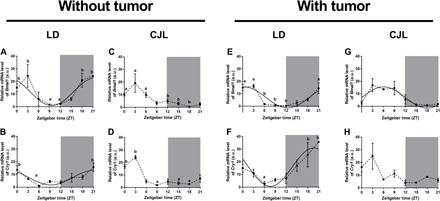
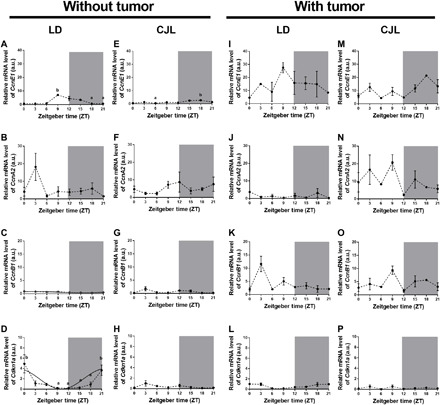
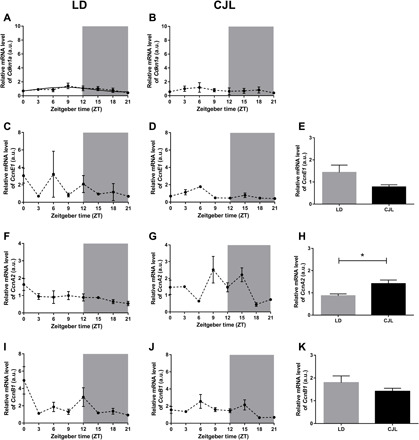
Circadian disruption negatively affects physiology, posing a global health threat that manifests in proliferative, metabolic, and immune diseases, among others. Because outputs of the circadian clock regulate daily fluctuations in the immune response, we determined whether circadian disruption results in tumor-associated immune cell remodeling, facilitating tumor growth. Our findings show that tumor growth rate increased and latency decreased under circadian disruption conditions compared to normal light-dark (LD) schedules in a murine melanoma model. Circadian disruption induced the loss or inversion of daily patterns of M1 (proinflammatory) and M2 (anti-inflammatory) macrophages and cytokine levels in spleen and tumor tissues. Circadian disruption also induced (i) deregulation of rhythmic expression of clock genes and (ii) of cyclin genes in the liver, (iii) increased CcnA2 levels in the tumor, and (iv) dampened expression of the cell cycle inhibitor p21WAF/CIP1 , all of which contribute to a proliferative phenotype.


Figures

Fig. 1
Fig. 1. Characterization of tumor growth and animal survival under CJL schedules.
Mean ± SEM of tumor size (A), survival (B), and tumor latency (C) in C57BL/6J mice under LD and CJL conditions injected subcutaneously with 30,000 cells of the murine melanoma cell line B16F0. Tumor latency: day of tumor detection by palpation (approximately 1 mm3). (A) Repeated-measures ANOVA interaction time × light schedule, P < 0.0001, post hoc test: day 33: CJL: 1607.5 ± 431.7 mm3, LD: 432.7 ± 272.9 mm3, **P < 0.01; (B) survival [log-rank (Mantel-Cox)] test: **P = 0.0153; (C) t test: *P = 0.037; n = 14 per condition.
Fig. 2
Fig. 2. Daily pattern of immune parameters in tumor under CJL conditions.
Mean ± SEM of the percentage of M1 (A) and M2 (B) macrophages, and the M1/M2 ratio (C) in tumor samples detected by flow cytometry taken at ZT3, ZT9, ZT15, and ZT21 as described in fig. S4, and mean ± SEM of protein levels of IL-1β (D), IL-6 (E), and TNF-α (F) in tumor tissue samples taken at ZT6 and ZT18 (day and night, respectively) measured by ELISA. (A) Kruskal Wallis test: P = 0.028, LD: ZT3: 10.09 ± 1.90%, ZT9: 5.41 ± 0.43%, ZT15: 16.07 ± 2.0%, ZT21: 12.99 ± 3.80%; CJL: ZT3: 9.55 ± 2.12%, ZT9: 10.15 ± 1.65%, ZT15: 3.49 ± 1.79%, ZT21: 5.51 ± 2.26; post hoc test: *P < 0.05. (D) Two-way ANOVA: interaction time × light schedule: P = 0.038, LD Day: 1.55 ± 0.04 pg/mg, LD Night: 1.03 ± 016 pg/mg, CJL Day: 1.48 ± 0.04 pg/mg, CJL Night: 1.55 ± 0.18 pg/mg; post hoc test: *P = 0.019 for LD Day versus LD Night, and *P = 0.027 for LD Night versus CJL Night. (F) Two-way ANOVA: interaction time × light schedule: P = 0.0067, LD Day: 1.48 ± 0.06 pg/mg, LD Night: 0.90 ± 0.19 pg/mg, CJL Day: 1.03 ± 0.06 pg/mg, CJL Night: 1.52 ± 0.21 pg/mg, post hoc test: *P = 0.03 for LD Day versus LD Night, *P = 0.04 for CJL Day versus CJL Night, and *P = 0.038 for LD Night versus CJL Night. n = 3 to 4 per condition and time point.
Fig. 3
Fig. 3. Daily pattern of immune cells in spleen tissue of mice carrying tumors under CJL conditions.
Mean ± SEM of the percentage of M1 (A and F) and M2 (B and G) macrophages, M1/M2 ratio (C and H), LT CD4+ (D and I), and LT Treg (E and J), detected by flow cytometry, in spleen tissue of control mice (A to D) or tumor-bearing mice (E to I) maintained under an LD or CJL schedule. (A) Kruskal-Wallis test: P = 0.01, LD: ZT3: 3.05 ± 0.43%, ZT9: 3.85 ± 0.29%, ZT15: 1.16 ± 0.27%, ZT21: 1.72 ± 0.18%; CJL: ZT3: 2.06 ± 0.34%, ZT9: 1.76 ± 0.20%, ZT15: 1.69 ± 0.60%, ZT21: 2.55 ± 0.14%. (B) Kruskal-Wallis test: P = 0.017; LD: ZT3: 0.63 ± 0.12%, ZT9: 0.79 ± 0.03%, ZT15: 0.21 ± 0.05%, ZT21: 0.12 ± 0.03%; CJL: ZT3: 0.17 ± 0.17%, ZT9: 0.50 ± 0.15%, ZT15: 0.51 ± 0.06%, ZT21: 0.44 ± 0.10%. For (C to H) Kruskal-Wallis test: P = n.s.; post hoc test: *P < 0.05. n = 3 to 4 per condition and time point.
Fig. 4
Fig. 4. Rhythms of clock genes in liver under the CJL schedule.
Mean ± SEM of relative mRNA levels of Bmal1 (A, C, E, and G) and Cry1 (B, D, F, and H) in the livers of mice carrying tumors (E to H) or controls (A to D), under LD (A, B, E and F) and CJL (C, D, G, and H) conditions detected by real-time PCR in eight time points (ZT0, ZT3, ZT6, ZT9, ZT12, ZT15, ZT18, and ZT21). Curves plotted over the data (A, B, and E to G) correspond to cosinor analysis adjusted to 24 hours. Only the statistically significant cosinor analyses were plotted (table S2). Nonparametric Kruskal-Wallis test: (A) P = 0.001, (B) P = 0.002, (C) P = 0.007, (D) P = 0.016, (E) P = 0.016, and (F) P = 0.048; post hoc test: P < 0.05: a versus b. n = 3 to 4 per condition and time point. a.u., arbitrary units.
Fig. 5
Fig. 5. Rhythms of cell cycle–related molecules in liver under a CJL schedule.
Mean ± SEM of relative mRNA levels of the CcnE1 (A, E, I, and M), CcnA2 (B, F, J, and N), and CcnB1 (C, G, K, and O) and the inhibitor p21WAF/CIP1 (Cdkn1a; D, H, L, and P) in liver tissues of control mice (A to H) or mice carrying tumors (I to P), under LD (A to D and I to L) or CJL (E to H and M to P) conditions, detected by real-time PCR in eight time points (ZT0, ZT3, ZT6, ZT9, ZT12, ZT15, ZT18, and ZT21). Curves plotted over the data (C and D) that correspond to the cosinor analysis were adjusted to 24 hours. Only statistically significant cosinors were plotted (table S2). Kruskal-Wallis test: (A) P = 0.011, (D) P = 0.012, and (E) P = 0.0023; post hoc test: P < 0.05: a versus b: n = 3 to 4 per condition and time point.
Fig. 6
Fig. 6. Daily pattern of cell cycle–related molecules in tumor tissue under a CJL schedule.
Mean ± SEM of relative mRNA levels of the inhibitor p21WAF/CIP1 (Cdkn1a) (A and B), and CcnE1 (C and D), CcnA2 (F and G) and CcnB1 (I and J) in tumor tissue of mice under LD (A, C, F, and I) and CJL (B, D, G, and J) conditions detected by real-time PCR at eight time points (ZT0, ZT3, ZT6, ZT9, ZT12, ZT15, ZT18, and ZT21), and mean ± SEM of 24-hour mean levels of CcnE1 (E), CcnA2 (H), and CcnB1 (K). Curves plotted over the data (A) correspond to cosinor analysis adjusted to 24 hours. Only the statistically significant cosinor analyses were plotted. Student t test: *P < 0.05; n = 3 to 4 per condition and time point.

References

    1. Chen Z., Yoo S. H., Takahashi J. S., Development and therapeutic potential of small-molecule modulators of circadian systems. Annu. Rev. Pharmacol. Toxicol. 58, 231–252 (2018). - PMC - PubMed
    1. Mohawk J. A., Green C. B., Takahashi J. S., Central and peripheral circadian clocks in mammals. Annu. Rev. Neurosci. 35, 445–462 (2012). - PMC - PubMed
    1. Golombek D. A., Casiraghi L. P., Agostino P. V., Paladino N., Duhart J. M., Plano S. A., Chiesa J. J., The times they’re a-changing: Effects of circadian desynchronization on physiology and disease. J. Physiol. Paris 107, 310–322 (2013). - PubMed
    1. Takahashi J. S., Transcriptional architecture of the mammalian circadian clock. Nat. Rev. Genet. 18, 164–179 (2017). - PMC - PubMed
    1. Cermakian N., Lange T., Golombek D., Sarkar D., Nakao A., Shibata S., Mazzoccoli G., Crosstalk between the circadian clock circuitry and the immune system. Chronobiol. Int. 30, 870–888 (2013). - PMC - PubMed

Publication types