. 2020 Oct 27;117(43):26773-26783.
doi: 10.1073/pnas.2002360117. Epub 2020 Oct 14.

The eukaryotic translation initiation factor eIF4E elevates steady-state m7G capping of coding and noncoding transcripts

Affiliations

The eukaryotic translation initiation factor eIF4E elevates steady-state m7G capping of coding and noncoding transcripts

Biljana Culjkovic-Kraljacic et al. Proc Natl Acad Sci U S A. .

Abstract

Methyl-7-guanosine (m7G) "capping" of coding and some noncoding RNAs is critical for their maturation and subsequent activity. Here, we discovered that eukaryotic translation initiation factor 4E (eIF4E), itself a cap-binding protein, drives the expression of the capping machinery and increased capping efficiency of ∼100 coding and noncoding RNAs. To quantify this, we developed enzymatic (cap quantification; CapQ) and quantitative cap immunoprecipitation (CapIP) methods. The CapQ method has the further advantage that it captures information about capping status independent of the type of 5' cap, i.e., it is not restricted to informing on m7G caps. These methodological advances led to unanticipated revelations: 1) Many RNA populations are inefficiently capped at steady state (∼30 to 50%), and eIF4E overexpression increased this to ∼60 to 100%, depending on the RNA; 2) eIF4E physically associates with noncoding RNAs in the nucleus; and 3) approximately half of eIF4E-capping targets identified are noncoding RNAs. eIF4E's association with noncoding RNAs strongly positions it to act beyond translation. Coding and noncoding capping targets have activities that influence survival, cell morphology, and cell-to-cell interaction. Given that RNA export and translation machineries typically utilize capped RNA substrates, capping regulation provides means to titrate the protein-coding capacity of the transcriptome and, for noncoding RNAs, to regulate their activities. We also discovered a cap sensitivity element (CapSE) which conferred eIF4E-dependent capping sensitivity. Finally, we observed elevated capping for specific RNAs in high-eIF4E leukemia specimens, supporting a role for cap dysregulation in malignancy. In all, levels of capping RNAs can be regulated by eIF4E.

Keywords: RNA capping; RNMT; eIF4E; methyl-7-guanosine cap.


Conflict of interest statement

The authors declare no competing interest.

Figures

Fig. 1.
Fig. 1.
eIF4E increases expression of the capping machinery. (A) The enrichment of mRNAs in eIF4E RIPs versus input RNAs from the nuclear fractions of vector control U2Os cells monitored by qRT-PCR. Data were normalized to input samples and are presented as a fold change. The means, SDs, and P values (from Student’s t test, *P < 0.05, **P < 0.01, ***P < 0.001) were derived from five independent experiments (each carried out in triplicate). Myc, Mcl1, and CCND1 are known eIF4E nuclear targets and served as positive controls, while ACTB, GAPDH, POLR2A, and 18S rRNA were negative controls. (B) RNA export assays for eIF4E-Flag wild-type (eIF4Ewt), S53A mutant-expressing, and vector control U2Os cell lines. RNA export assays were carried out by assessing target transcript levels in nuclear (Nc) and cytoplasmic (Cyt) compartments by qRT-PCR. Data were normalized to vector control to calculate fold change. The means, SDs, and P values were derived from three independent experiments (each carried out in triplicate). P values between eIF4Ewt and S53A mutant-overexpressing cells are shown. (C) Polysome profiling of RNAs encoding the capping machinery in eIF4E-Flag and vector control U2Os cell lines. RNA contents of individual fractions are displayed as a percentage of the given fraction compared with RNA content in the entire gradient for each transcript analyzed. VEGF served as a positive control. Experiments were carried out three independent times, and one representative experiment is shown. M, monosome fraction. (D) Western blot (WB) analysis of eIF4Ewt, eIF4E mutant S53A-Flag (S53A), and vector control (vector) U2Os cell lines. Myc, Mcl1, and CCND1 served as positive controls. ACTB is a loading control. Both eIF4E-Flag and endogenous eIF4E are shown. Each ACTB blot corresponds to the series of blots above it. Experiments were carried out at least three independent times, and one representative experiment is shown. (E) mRNA export assays for CRISPR-4E and CRISPR-Ctrl cell lines, carried out as in B. Data were normalized to the CRISPR-Ctrl cell line and presented as a fold change. The means, SDs, and P values were derived from three independent experiments (each carried out in technical triplicate). (F) WB analysis of capping machinery as a function of eIF4E reduction using CRISPR-4E and CRISPR-Ctrl cell lines. Myc, Mcl1, and CCND1 served as positive controls, while ACTB was used as a loading control. Each ACTB blot corresponds to the series of blots above it. Experiments were carried out at least three independent times, and one representative experiment is shown.
Fig. 2.
Fig. 2.
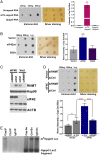
eIF4E increases m7G RNA capping. (A) Dot blot demonstrating the specificity of the anti-m7G cap antibody. Immunoblots with the indicated loading of in vitro transcribed uncapped, m7GpppG-capped, or GpppG-capped Luciferase RNAs (Left), silver-stained membranes to monitor sample loading (Middle), and quantification (Right) are shown. (B) eIF4Ewt but not the S53A mutant increased m7G cap levels as observed by immunoblot analysis using the m7G cap antibody (Left), silver-stained membrane for loading (Middle), and quantification (Right). Quantification is represented as a fold change relative to the vector control, derived from three independent experiments. Means and SDs are shown. (C) RNMT is required for eIF4E-dependent increases in m7G cap levels as assessed by siRNA-mediated knockdown of RNMT. eIF4E and vector control (Vect) U2Os cell lines were transfected with control (Ctrl) or RNMT siRNAs. RNMT knockdown was confirmed by WB and ACTB and Hsp90 were used as loading controls. Both eIF4E-Flag and endogenous eIF4E are shown and neither was altered by RNMT knockdown. Experiments were carried out at least three independent times, and one representative WB is shown. (D) Dot blot analysis using the anti-m7G cap antibody for RNAs isolated from vector control or eIF4E-Flag cells transfected with siCtrl or siRNMT. Dot blots are as in B. (E) m7G cap antibody is specific in CapIPs. Agarose gel of RNAs isolated from CapIP, IgGIP, CtrlIP (m7G cap antibody with an excess of m7GpppG), and corresponding supernatants (Cap-Sn, IgG-Sn, and Ctrl-Sn) on in vitro transcribed m7GpppG-capped Luciferase or GpppG-capped LacZ RNAs. P values are from Student’s t test (*P < 0.05, **P < 0.01, ***P < 0.001).
Fig. 3.
Fig. 3.
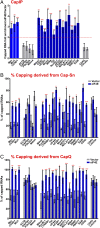
eIF4E increases capping percentages for specific RNAs. (A) Fold enrichment of RNAs in CapIPs from eIF4E-Flag relative to vector control U2Os cells by qRT-PCR. Data were first normalized to input and antibody control (m7G cap antibody with excess of m7GpppG; CtrlIP) samples for each vector and eIF4E set. Then, values were normalized to vector and presented as a fold change for each RNA. The means, SDs, and P values (from Student’s t test, *P < 0.05, **P < 0.01, ***P < 0.001) derived from three independent experiments (each carried out in triplicate) are shown. (B) Percentage of capped transcripts derived from the levels of transcripts in supernatant fractions after CapIPs (Cap-Sn) assessed by qRT-PCR. All samples were normalized to 18S rRNA, which is not m7G-capped, and the ratio of Cap-Sn RNA to Ctrl-Sn RNA levels provided the percent of uncapped RNA in the Cap-Sn, which was then converted to the percent of capped RNA. The means, SDs, and P values were derived from three independent experiments (each carried out in triplicate). (C) Percentage capping derived from CapQ. Percentage of capping was calculated as outlined in the text. The means, SDs, and P values were derived from three independent experiments (each carried out in triplicate).
Fig. 4.
Fig. 4.
Determination of an RNA element sufficient to support eIF4E-dependent capping. (A) Schematic representation of chimeric constructs used for mapping of CapSE. Full-length 5′ UTR or 3′ UTR constructs of human CCND1 mRNA were cloned up- or downstream of LacZ, respectively. Numbers represent the position of UTR fragments in CCND1 mRNA. (B) eIF4E-Flag U2Os cells were transiently transfected with LacZ or chimeric LacZ constructs containing the first exon (5′ UTR-LacZ) or indicated 3′ UTR portions of CCND1. Total RNAs were used for CapIPs. Data were normalized to input and antibody control (m7G cap antibody with an excess of m7GpppG) for each sample, and presented as a fold change for each RNA. The means and SDs derived from three independent experiments (each carried out in triplicate) are shown. (C) Nuclear fractions of the indicated cells were immunoprecipitated with an anti-RNMT antibody and IPs were monitored by qRT-PCR. Data were normalized to input samples and presented as a fold change relative to LacZ. The means, standard deviations, and P values (from Student’s t test, *P < 0.05, **P < 0.01, ***P < 0.001) derived from three independent experiments (each carried out in triplicate) are shown.
Fig. 5.
Fig. 5.
High-eIF4E AML specimens show increased RNMT protein levels and increased capping of selected transcripts. (A) WB analysis of RNMT levels in primary AML samples with high eIF4E levels and bone marrow mononuclear cells from healthy volunteers (Norm, normal). ACTB was used as a loading control. WB analysis for RNGTT is shown in SI Appendix, Fig. S7A. (B) Comparison of RNA enrichment in CapIPs using RNAs isolated from high-eIF4E primary AML cells (four samples) vs. bone marrow mononuclear (three samples) or CD34+ cells (one sample) from healthy volunteers (Norm), monitored by qRT-PCR. CapIPs were first normalized to input for each sample, then grouped and averaged for AML and normal samples, and finally normalized to values obtained for normal samples and presented as a fold change. The means, standard deviations, and P values (from Student’s t test, *P < 0.05, **P < 0.01, ***P < 0.001) calculated for AML and normal grouped samples (each carried out in triplicate) are shown. ACTB, POLR2A, CDK4, and Mdm4 served as negative controls. For the range of differences among AML and normal groups, see SI Appendix, Fig. S7B.

Similar articles

Cited by

References

    1. Cowling V. H., Regulation of mRNA cap methylation. Biochem. J. 425, 295–302 (2009). - PMC - PubMed
    1. Pillutla R. C., Shimamoto A., Furuichi Y., Shatkin A. J., Human mRNA capping enzyme (RNGTT) and cap methyltransferase (RNMT) map to 6q16 and 18p11.22-p11.23, respectively. Genomics 54, 351–353 (1998). - PubMed
    1. Varshney D., et al. ., Molecular basis of RNA guanine-7 methyltransferase (RNMT) activation by RAM. Nucleic Acids Res. 44, 10423–10436 (2016). - PMC - PubMed
    1. Mao X., Schwer B., Shuman S., Yeast mRNA cap methyltransferase is a 50-kilodalton protein encoded by an essential gene. Mol. Cell. Biol. 15, 4167–4174 (1995). - PMC - PubMed
    1. Fabrega C., Hausmann S., Shen V., Shuman S., Lima C. D., Structure and mechanism of mRNA cap (guanine-N7) methyltransferase. Mol. Cell 13, 77–89 (2004). - PubMed

Publication types