. 2020 Oct 15;5(20):e133157.
doi: 10.1172/jci.insight.133157.

Persistence of an intact HIV reservoir in phenotypically naive T cells

Affiliations

Persistence of an intact HIV reservoir in phenotypically naive T cells

Emmanuele Venanzi Rullo et al. JCI Insight. .

Abstract

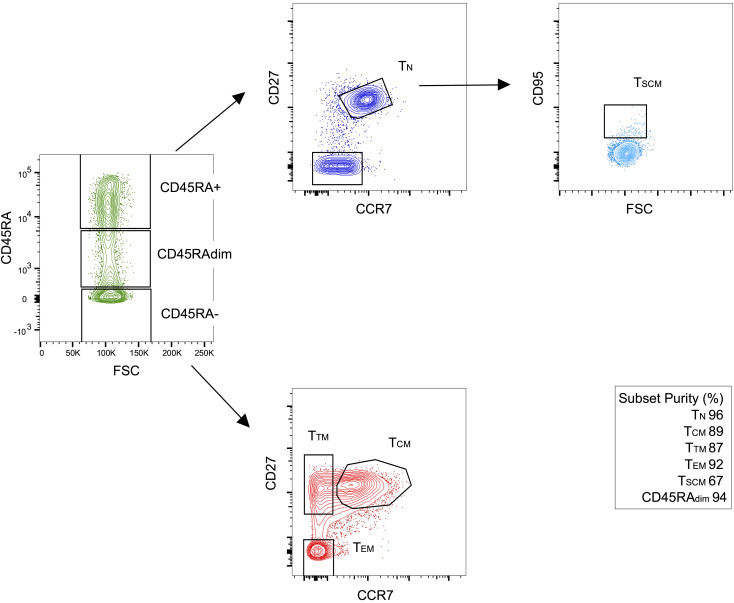
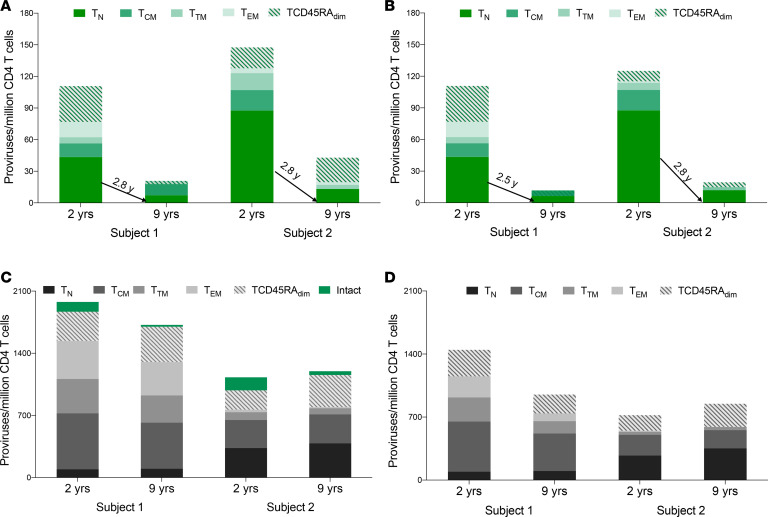
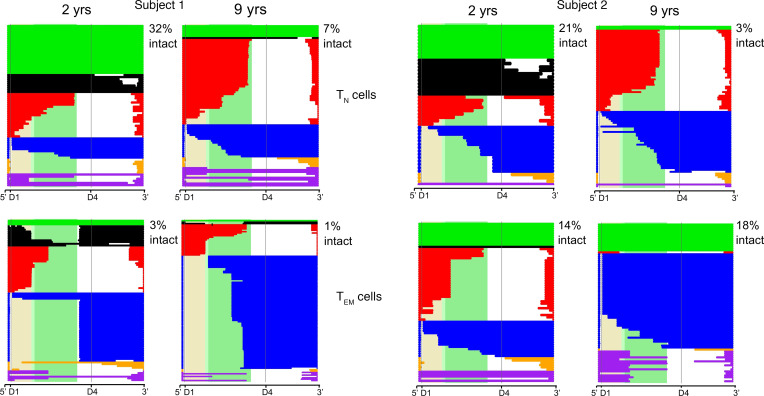
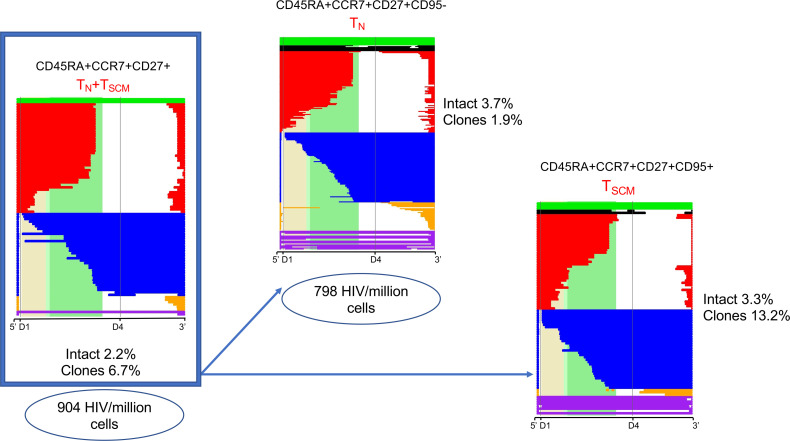
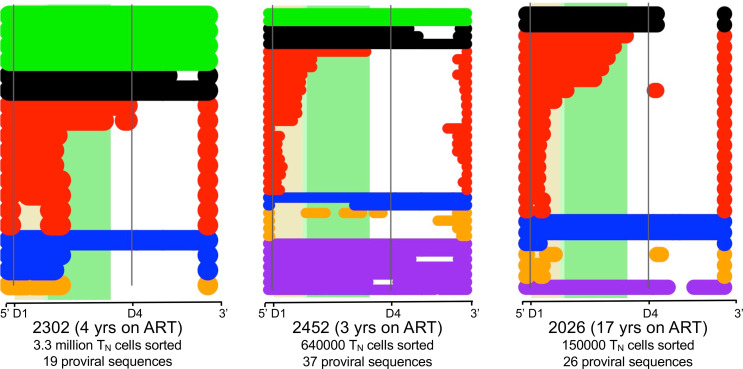
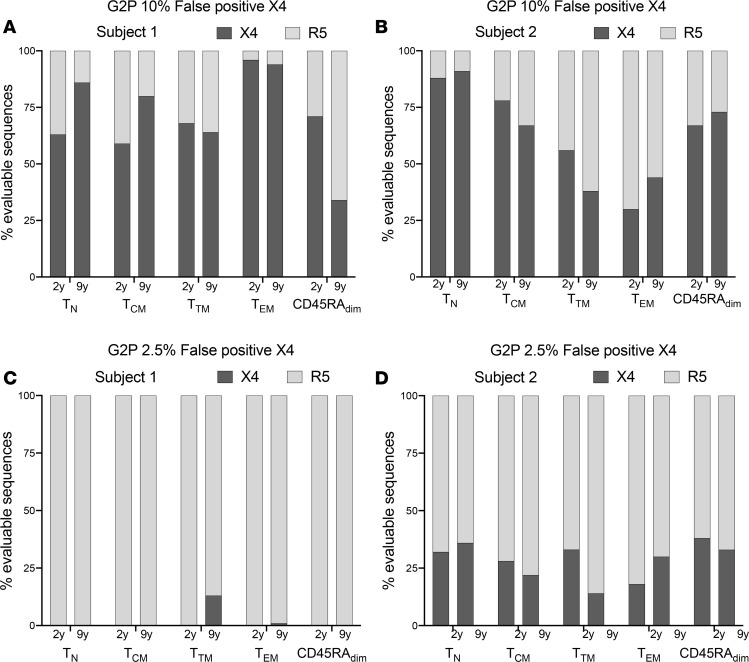
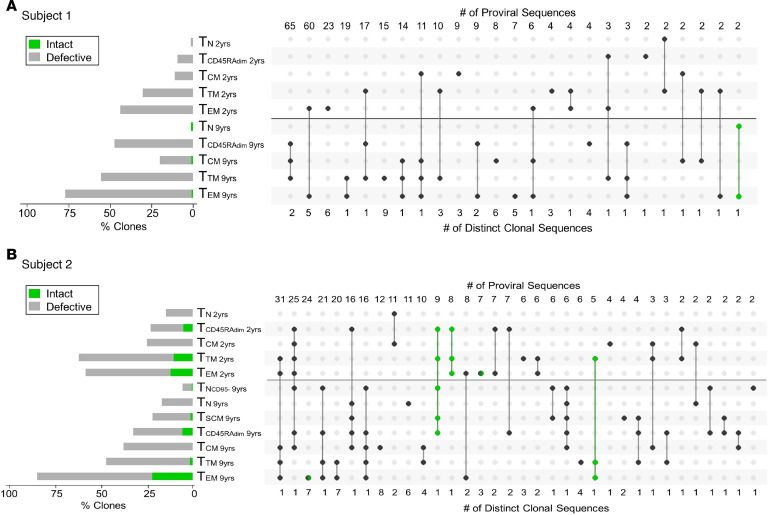
Despite the efficacy of antiretroviral therapy (ART), HIV persists in a latent form and remains a hurdle to eradication. CD4+ T lymphocytes harbor the majority of the HIV reservoir, but the role of individual subsets remains unclear. CD4+ T cells were sorted into central, transitional, effector memory, and naive T cells. We measured HIV DNA and performed proviral sequencing of more than 1900 proviruses in 2 subjects at 2 and 9 years after ART initiation to estimate the contribution of each subset to the reservoir. Although our study was limited to 2 subjects, we obtained comparable findings with publicly available sequences. While the HIV integration levels were lower in naive compared with memory T cells, naive cells were a major contributor to the intact proviral reservoir. Notably, proviral sequences isolated from naive cells appeared to be unique, while those retrieved from effector memory cells were mainly clonal. The number of clones increased as cells differentiated from a naive to an effector memory phenotype, suggesting naive cells repopulate the effector memory reservoir as previously shown for central memory cells. Naive T cells contribute substantially to the intact HIV reservoir and represent a significant hurdle for HIV eradication.

Keywords: AIDS/HIV; T cells.


Conflict of interest statement

Conflict of interest: The authors have declared that no conflict of interest exists.

Figures

Figure 1
Figure 1. Sorting strategy to obtain cellular subsets.
CD4+ T cells were negatively selected by immunomagnetic beads from peripheral blood mononuclear cells from 2 HIV-infected donors on ART at 2 time points corresponding to 2 and 9 years after ART initiation .TN cells were enriched by sorting for CD45RA+CCR7+CD27+ cells. TCM cells were CD45RACCR7+CD27+, TTM cells were CD45RACCR7CD27+, while TEM cells were CD45RACCR7CD27. Finally, CD45RAdim cells were also collected in an effort to sample almost all CD4+ T cell subsets. For selected experiments, we also sorted CD95 TN cells (CD45RA+CCR7+CD27+CD95) and TSCM cells (CD45RA+CCR7+CD27+CD95+). Purity was determined after sorting by flow cytometry. Here, we show 1 representative experiment. For these sorting experiments, we did not sort CD45RA+CD27CCR7 cells (TEMRA cells; ref. 66). The low purity of TSCM cells can be explained by the low levels of CD95 expressed by these cells, resulting in limited separation between the CD95+ and CD95 population. TEMRA, effector memory reexpressing CD45RA.
Figure 2
Figure 2. Contribution of T cell subsets to proviral DNA at 2 and 9 years after ART initiation.
(A and B) Contribution of each T cell subset to the total number of intact proviruses at 2 time points before (A) and after removing large clonal populations (B). The half-life of intact HIV for TN cells is shown in the graph. The half-life of each subset is provided in Supplemental Table 3. TN cells represent a major contributor to the intact reservoir at both time points. Removal of repeated sequences revealed that large clones were more frequent among the memory subsets compared with the naive population. Notably, the half-life of intact proviruses in TN cells was minimally affected by removing repeated sequences in contrast to the half-life of the memory cell subsets, which was shortened. (C and D) Contribution of each T cell subset to the total number of defective proviruses at 2 time points before (C) and after removing large clonal populations (D). We calculated the level of defective HIV DNA before and after removing repeated sequences at both time points. We calculated the percentage of defective proviruses by subtracting the percentage of intact proviral sequences (depicted as green bars in C) from the total number of HIV proviruses (as estimated by qPCR). This percentage was used to estimate the absolute number of defective proviruses. The levels of defective proviruses minimally changed over time in both individuals. Moreover, TN cells contributed less to the pool of defective HIV in comparison with intact HIV.
Figure 3
Figure 3. Deletion maps for proviruses retrieved from TN and TEM cells at 2 and 9 years after ART initiation.
Intact and defective proviruses from TN and TEM cells were aligned to HXB2 at an early and late time point after ART initiation. Each horizontal bar represents 1 proviral sequence. Proviruses are color-coded based on size and location of deletion. Green bars are intact (D1+D4+), black bars are nearly intact (D1+D4+), red bars are 3′ deleted (D1+D4), blue bars are 5′ deleted (D1D4+), and yellow bars are massively deleted (D1D4) proviruses. Hypermutated proviruses are represented as purple bars. The shaded beige, light green, and dark green regions correspond to the gag, gag-pol, and pol regions of HXB2, respectively. The percentage of intact proviruses is reported in the upper right corner of each deletion map.
Figure 4
Figure 4. Comparison of HIV DNA levels and reservoir composition by NFL sequencing in TN versus TSCM cells for Subject 2.
The sorting experiment described in Figure 1 was repeated, separating TSCM from CD95 TN cells. CD95 TN cells were defined as CD45RA+CCR7+CD27+CD95 cells, while TSCM cells were defined as CD45RA+CCR7+CD27+CD95+ cells. Sorted cells were used to measure HIV DNA levels by qPCR and to obtain proviral sequences. These proviral sequences were used to generate deletion maps, as described in Figure 3. TSCM and CD95 TN cells had similar levels of intact HIV, with a higher fraction of clones in TSCM cells.
Figure 5
Figure 5. Sequences from sorted naive cells support that TN cells contribute to the HIV reservoir.
Sequences from sorted TN cells were downloaded from Hiener et al. (14) and analyzed using our pipeline. The deletion maps were generated with the same bioinformatic tools used in Figure 3 and Figure 4 and Supplemental Figures 1 and 2 for our 2 subjects. No intact proviruses were detected for subject 2026, which might be explained by the low number of sorted TN cells, as well as the long time the patient has been on ART. Nonetheless, the composition of the reservoir in TN cells in these 3 individuals closely matches the proviral composition detected in TN cells in Figure 3.
Figure 6
Figure 6. Analysis of coreceptor tropism using Geno2Pheno (G2P) suggests that TN cells might harbor CCR5-tropic HIV.
We used G2P to study coreceptor tropism of proviral sequences retrieved from different subsets. We included all the evaluable env sequences. (A and B) We used G2P with a 10% FPR, where the FPR indicates the likelihood to misclassify a provirus as CXCR4-tropic (which is based on phenotypic assays). When using G2P FPR 10%, both subjects showed a predominance of CXCR4-tropic sequences. (C and D) We used G2P with a 2.5% FPR. With G2P FPR 2.5%, most evaluable env ORFs were predicted to be CCR5-tropic for Subject 1 at both time points (C), while Subject 2 had, on average, 30% CXCR4-tropic sequences across subsets (D). Interestingly, with either 10% or 2.5% FPR, TN cells were predicted to contain CCR5-tropic sequences in both individuals.
Figure 7
Figure 7. Modified proviral clone UpSet plots.
(A and B) Modified proviral clone UpSet plot for Subject 1 (A) and Subject 2 (B) shows that clonal expansion progressively increases with cell differentiation and is more prominent among defective proviruses. Proviral clones were identified as repeated sequences. The horizontal bars on the left side show the percentage of repeated sequences found in each subset (green for intact sequences and gray for defective ones). A black horizontal line separates the 2 time points (2 and 9 years after ART initiation). Intact proviral clones are shown in green. For those proviral clones that could be detected in multiple subsets, a solid line was used to connect these subsets. The numbers at the top of the UpSet plot represent the number of proviral sequences that could be found in the same subsets within a category. The numbers below the UpSet plot represent the number of distinct clonal sequences. For example, for Subject 2 (B), we identified 308 repeated sequences. The first column shows that we detected 1 distinct clone made up by 31 proviral sequences in TEM and TTM at both time points, as well as TCM cells at the second time point. For Subject 1, we identified 303 repeated sequences (A). We also identified 5 intact clones for Subject 2 (B) and 1 proviral clone for Subject 1 (A). yrs, years after ART initiation.

Similar articles

Cited by

References

    1. Barré-Sinoussi F, Ross AL, Delfraissy JF. Past, present and future: 30 years of HIV research. Nat Rev Microbiol. 2013;11(12):877–883. doi: 10.1038/nrmicro3132. - DOI - PubMed
    1. Finzi D, et al. Latent infection of CD4+ T cells provides a mechanism for lifelong persistence of HIV-1, even in patients on effective combination therapy. Nat Med. 1999;5(5):512–517. doi: 10.1038/8394. - DOI - PubMed
    1. Pinzone MR, Bertuccio MP, VanBelzen DJ, Zurakowski R, O’Doherty U. Next-Generation Sequencing in a Direct Model of HIV Infection Reveals Important Parallels to and Differences from In Vivo Reservoir Dynamics. J Virol. 2020;94(9):e01900-19. - PMC - PubMed
    1. Ho YC, et al. Replication-competent noninduced proviruses in the latent reservoir increase barrier to HIV-1 cure. Cell. 2013;155(3):540–551. doi: 10.1016/j.cell.2013.09.020. - DOI - PMC - PubMed
    1. Bruner KM, et al. Defective proviruses rapidly accumulate during acute HIV-1 infection. Nat Med. 2016;22(9):1043–1049. doi: 10.1038/nm.4156. - DOI - PMC - PubMed

Publication types

MeSH terms